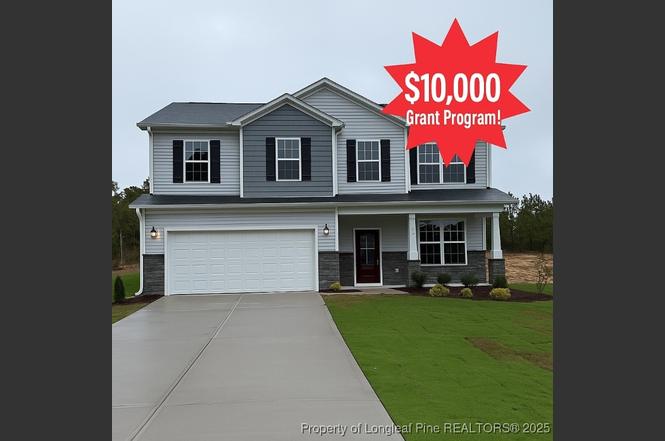
 🏗️ New Construction
55 Fern Ridge Dr · Spout Springs, NC
Flood risk No data
- FEMA flood zone
- —
- Chance of flooding over 30 yrs
- —
- Est. flood insurance / yr
- —
Fire risk No data
- Est. fire insurance / yr
- —
Heat risk No data
- Hot days now (above threshold)
- —
- Hot days in 30 yrs
- —
Wind risk No data
- Chance of severe wind over 30 yrs
- —
Air-quality risk No data
- Unhealthy air days now
- —
- Unhealthy air days in 30 yrs
- —
Risk factors via First Street. Map © Google.
Why this score? — see what drove the F grade
The composite is a weighted blend of 9 inputs, each scored 0–100. Each bar is that input's sub-score; the figure is the points it added to the 100-point composite (weight × sub-score).
- Cash flow +8.4/30.0
- ARV discount +7.5/15.0
- Rent growth +3.2/5.0
- Schools +3.0/10.0
- 1% rule +2.6/10.0
- Livability +2.5/5.0
- Condition / age +2.5/5.0
- DSCR +2.3/10.0
- Appreciation +0.0/10.0
$304,500
🖨 Deal sheet (PDF) 📄 Offer letter ✓ Due diligence
Listing remarks
NO HOA! Our beautiful move-in ready 4-bedroom Forsyth plan offers the perfect combination of space, style, and flexibility. The bright, open floor plan features a gourmet kitchen with granite countertops, stainless steel appliances, and a seamless flow into the dining and living areas—ideal for both everyday living and entertaining. On the main level, enjoy a dedicated office or flex room—perfect for working from home, hobbies, or a quiet retreat. The spacious primary suite includes a large walk-in closet and a private bath with a walk-in shower. Upstairs, a huge loft provides even more space for a game room, second office, or additional living area. Two roomy secondary bedrooms
Key facts
- Gourmet kitchen
- Dedicated office
- Granite countertops
Tags
Neighborhood map
What this means for you Summary
Snapshot
- This is a 4-bed/2.5-bath land listed at $304k.
Deal economics
- At list price, monthly cash flow is $-273 ($-3k/yr) — negative.
- To cash-flow at today's rent, offer at most $265k (13.0% below list).
- To meet the 1% rule (rent ≥ 1% of price), the offer needs to be $232k (23.9% below list).
- Recommended offer: $232k (23.9% below list) — sets the bar for 1% rule.
- Cap rate 5.2% vs local median 4.2% in Spout Springs — meaningfully above typical; check what's discounted (condition, days-on-market, listing class) to confirm the premium yield is real.
Location & tenants
- Location reads: area grade F — affects rentability + tenant quality, not the cash-flow math above.
- Harnett County Schools (rural): math 31% / reading 39% proficiency, ranked #130 of 178 in NC (top 73%) — families likely to look elsewhere, expect single-tenant / working-renter base with shorter leases.
- Zoned schools: Benhaven Elementary (math 50% / reading 48%, grade D, #459 of 1,410 statewide, top 33%, 1,030 students, 45% FRL); Highland Middle (math 34% / reading 41%, grade F, #256 of 475 statewide, top 55%, 875 students, 64% FRL); Western Harnett High (math 57% / reading 58%, grade C, #245 of 535 statewide, top 46%, 1,386 students, 60% FRL).
- Zoned-school proficiency averages 48% at this address vs 35% district-wide (+13 pts) — the actual schools serving this property are materially stronger than the Harnett County Schools average implies; a family-tenant draw the district grade alone would hide.
- Market conditions: Rents rising (+3.0%/yr); 248 active listings in the ZIP; 1 comparable units currently listed for rent nearby; solid renter incomes; 2,080 units permitted in Harnett County in 2024 (12 in 5+ unit buildings).
- This rent runs 37% of the median local income ($75k/yr) — at the standard rent-burdened threshold; future hikes will face affordability resistance.
Forward outlook
- Local home prices are declining (-3.0%/yr); year-one equity from $2k of loan paydown is wiped out by about $9k of value loss. Plan a longer hold.
- Harnett County population projected at +42% by 2050 — long-run rental-demand tailwind backs the buy-and-hold thesis.
Negotiation context
- It's been on market 57 days — a 3% lower offer ($295k) is reasonable based on typical stale-listing flexibility.
- 7 sale attempts since 2y ago; this cycle's ask is 12104% above the opening price — seller raised mid-cycle; expect resistance to lowballs.
- Current owner paid $38k; list at $304k implies a 712% gain — meaningful room to come down on a strong offer.
Questions for the listing agent
- What do current leases actually rent for vs. the listed asking? Can we see a recent rent roll and the last 12 months of T-12 income?
- It's been on market 57 days. Have you received any prior offers? Is the seller open to a 24% concession, seller financing, or rate buy-down credit?
- Is there a deadline driving the sale (1031 exchange, divorce, estate, relocation)? That informs how much negotiation room exists.
- The area grade is low — what's the realistic commute time and amenity access for the typical tenant pool here? Any planned neighborhood developments (good or bad) we should know about?
- What's the average days-on-market for RENTAL listings here right now (not sales)? A rising rental-DOM trend means longer vacancies and softer asking-rent achievability than the comps imply.
- What's the recent tenant-quality profile in this submarket — average credit score on applications, eviction rate, late-payment / NSF rate, and stable-employment percentage? A property-management company in the area should have these aggregated.
- How much new for-sale + rental construction is in the pipeline within 1–3 miles? Heavy new supply typically softens prices + rents 12–24 months out; constrained supply supports both.
Investment metrics
- 1% rule
- 0.76% ✗
- Cap rate
- 5.22%
- Cash-on-cash
- -3.85%
- DSCR
- 0.83
- GRM
- 10.9
CMA / ARV
No comps found within radius.
Projected returns pro-forma
-3.0% appreciation · 2.95% rent growth · sell at horizon
- IRR
- -22.8%
- Equity multiple
- 0.22×
- Total profit
- $-66,835
- Equity at exit
- $45,402
- IRR
- -17.3%
- Equity multiple
- 0.05×
- Total profit
- $-80,955
- Equity at exit
- $26,328
Cash invested: $85,260 (down + closing). Projections, not guarantees.
Landlord ↔ Tenant lean methodology
- Overall (STATE)
- 85 Strongly Landlord-Friendly
- State North Carolina
- 85 Strongly Landlord-Friendly · R+3
- County
- — inherits STATE
- City
- — inherits STATE
ZIP-level market 28326
- Home prices YoY
- -9.9%
- Rents YoY
- 3.0%
- Active inventory
- 248
- Price-to-rent
- 10.9×
Monthly cashflow live
- Estimated rent
- $2,318 medium interval (Pro) →
- Mortgage (P&I)
- −$1,597
- Tax est. 1.5%
- −$381 /mo · $4,568/yr
- Insurance
- −$127
- HOA
- −$0
- Vacancy / Maint / Mgmt
- −$487
- Net cashflow
- $-273
Break-even live
Sensitivity live
| Price | -10% $-63 | -5% $-168 | +0% $-273 | +5% $-379 | +10% $-484 |
|---|---|---|---|---|---|
| Rent | -10% $-456 | -5% $-365 | +0% $-273 | +5% $-182 | +10% $-90 |
| Rate | -1.0pp $-120 | -0.5pp $-196 | base $-273 | +0.5pp $-352 | +1.0pp $-433 |
UW: 25.0% down · 7.5% · 30yr · 1.5% tax · 5.0% vac · 8.0% maint · 8.0% mgmt
Financing live
Cash to close
- Down payment
- $76,125
- Closing costs
- $9,135
- Reserves months
- —
- Total cash needed
- —
Loan-product check · same deal, 3 products live
Conventional
25% down · 7.5% · 30yr
- Down + closing
- —
- Monthly P&I
- —
- Monthly cashflow
- —
- DSCR
- —
- Eligible?
- —
Personal DTI + credit; lowest rate.
DSCR
20% down · 8.5% · 30yr
- Down + closing
- —
- Monthly P&I
- —
- Monthly cashflow
- —
- DSCR
- —
- Eligible?
- —
No personal income docs; deal must DSCR.
Hard money
10% down · 12.0% · 12mo
- Down + closing
- —
- Monthly P&I
- —
- Monthly cashflow
- —
- DSCR
- —
- Eligible?
- —
Short-term bridge; refi at stabilization.
Rent comps 1 comps
| Address | Beds | Baths | Sqft | Rent | $/sqft | DOM | Units | Dist |
|---|---|---|---|---|---|---|---|---|
| 45 Summit Ct Cameron, NC | 3.0 | 2.0 | 1683 | $1,900 | $1.13 | 25d | 1 | 0.29mi |
Listing history 16 events
-
2025-12-05historical $2,495
-
2025-12-02status Pending
-
2025-11-26$2,495
-
2025-11-25price $304,500
-
2025-10-27price $329,990
-
2025-10-06$339,502 Active
-
2025-10-04historical
-
2025-06-16$338,907 Active
-
2025-06-02$338,907 Active
-
2025-05-22historical
-
2025-05-13soldstatus $37,500 Closed
-
2025-05-01$269,990 Active
-
2025-02-27status Pending
-
2025-01-17status Active
-
2024-12-09historical
-
2024-12-05$50,000 Active
ⓘ Source: listings_history table (triggers on properties + properties_extension) + one-shot
backfill from property_details.listing_events for pre-trigger history.
Nearby sold comps map
Loading sold comps map…
Walkable amenities ~0.75 mi
Loading nearby amenities…
Taxation est. · year 1
- Rental income
- $27,812
- − Mortgage interest
- −$17,057
- − Property taxes
- −$4,568
- − Insurance
- −$1,522
- − Repairs & maintenance
- −$2,225
- − Management
- −$2,225
- − Depreciation
- −$8,858
- Taxable loss
- −$8,643
- Est. tax savings @ 24.0%
- +$2,074
- After-tax cash flow
- $-1,206/yr
For passive investors: Depreciation is non-cash, so a rental often shows a tax loss while cash-flowing — sheltering income. Rental losses are passive: they offset passive income freely, and up to $25,000/yr can offset ordinary (W-2) income if you actively participate and your MAGI is under $100k (phasing out to $0 by $150k); unused losses carry forward. On sale, claimed depreciation is recaptured at up to 25%, and gains may owe capital-gains tax (a 1031 exchange can defer both). Figures are a year-1 estimate at your 24.0% rate — not tax advice; consult a CPA.
Schools (NCES district)
- District
- Harnett County Schools
- NCES district ID
- 3702010
- Math proficiency
- 31% ▼ -2.00%
- Reading proficiency
- 39% ▼ -1.00%
- Median HH income
- $45,400
- Composite
- 29.88/100
- National rank
- #6397
- State rank
- #130 of 178 in NC
Livability — Spout Springs
No livability data for this city. (Only ~50 U.S. cities are tracked.)
Census & demographics
- County
- Harnett County · 125,715 people
- Metro
- Fayetteville, NC
- Population (ZIP)
- 26,068
- Household income
- $75,431
- Rent vs Own
- Severe rent burden
- 456.0
Population outlook (Harnett County) Hauer SSP2
- Today (2025)
- 153,758 people
- By 2030
- 166,581 · +8.3%
- By 2040
- 192,741 · +25.4%
- By 2050
- 218,332 · +42.0%
- By 2075
- 275,422 · +79.1%
- By 2100
- 313,511 · +103.9%
Race, ethnicity, and origin ACS 2023
- Neighborhood character
- Diverse neighborhood (Simpson 0.64)
- Race & ethnicity
- White 52% Black 27% Hispanic / Latino 12% Two or more races 8% Asian 1%
- Hispanic origin (detail)
- Mexican 5% Puerto Rican 6%
- Common ancestry
- Slovak 3% Lithuanian 3% Serbian 2%
- Foreign-born
- 4% · Canada
- Languages at home
- 91% English-only · Spanish 7%
Political lean MEDSL · Harnett
- 2024 margin
- Strong R (+25.1) · D 36.9% · R 62.0% · Other 1.1%
- 2008→2024 swing
- -8.4pp toward R · 2008: -16.7pp · 2024: -25.1pp
- All cycles
- 2024: R+25.1 2020: R+22.4 2016: R+24.1 2012: R+19.4 2008: R+16.7
Not yet ingested
- Civics
- —
Market trends
- HPI YoY
- ▼ -24.96%
- Current HPI
- 226.8295
- Rent YoY
- ▲ 2.95%
- Metro
- Fayetteville, NC
- State GDP YoY
- ▲ 3.28%
- F500 in state
- 26
Industry mix (Fortune 500 HQ in NC)
| Industry | F500 HQs | Revenue |
|---|---|---|
| Financial Services | 2 | $213B |
|
||
| Retail | 2 | $95B |
|
||
| Industrial Conglomerate | 1 | $38B |
|
||
| Metals / Steel | 1 | $35B |
|
||
| Utilities | 1 | $30B |
|
||
| Industrial Machinery | 1 | $19B |
|
||
Price history
-95.0% since first listed16 events — show timeline
- 2025-12-05 Rental Removed $2,495 TURBOTENANT
- 2025-12-02 Pending — LPRMLS
- 2025-11-26 Listed for Rent $2,495 TURBOTENANT
- 2025-11-25 Price Changed $304,500 LPRMLS
- 2025-10-27 Price Changed $329,990 LPRMLS
- 2025-10-06 Listed $339,502 LPRMLS
- 2025-10-04 Listing Removed — TMLS
- 2025-06-16 Listed $338,907 LPRMLS
- 2025-06-02 Listed $338,907 TMLS
- 2025-05-22 Listing Removed — TMLS
- 2025-05-13 Sold (MLS) $37,500 LPRMLS
- 2025-05-01 Listed $269,990 TMLS
- 2025-02-27 Pending — LPRMLS
- 2025-01-17 Relisted — LPRMLS
- 2024-12-09 Delisted — LPRMLS
- 2024-12-05 Listed $50,000 LPRMLS
Cash-flow waterfall
monthlySold comps — $/sqft
last 12 mo · ≤1 miLoading sold comps…