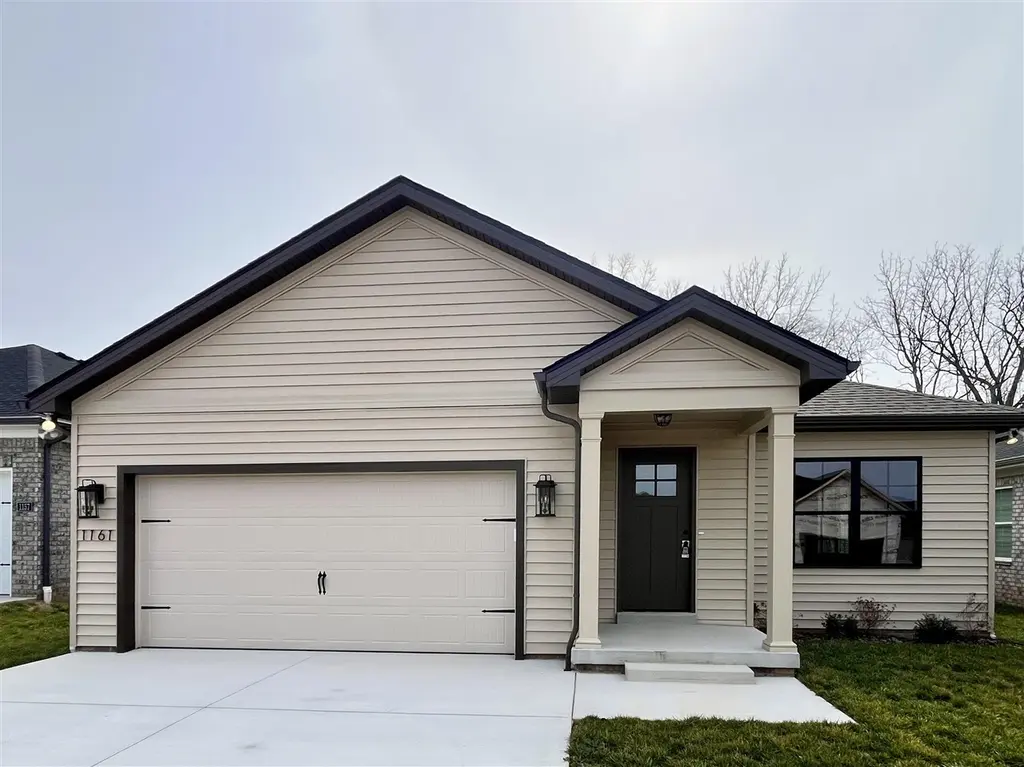
1161 Shallowford St · Bowling Green, KY
Flood risk No data
- FEMA flood zone
- —
- Chance of flooding over 30 yrs
- —
- Est. flood insurance / yr
- —
Fire risk No data
- Est. fire insurance / yr
- —
Heat risk No data
- Hot days now (above threshold)
- —
- Hot days in 30 yrs
- —
Wind risk No data
- Chance of severe wind over 30 yrs
- —
Air-quality risk No data
- Unhealthy air days now
- —
- Unhealthy air days in 30 yrs
- —
Risk factors via First Street. Map © Google.
Why this score? — see what drove the D- grade
The composite is a weighted blend of 9 inputs, each scored 0–100. Each bar is that input's sub-score; the figure is the points it added to the 100-point composite (weight × sub-score).
- ARV discount +11.6/15.0
- Cash flow +7.3/30.0
- Appreciation +5.0/10.0
- Schools +3.2/10.0
- Livability +3.2/5.0
- Rent growth +2.5/5.0
- Condition / age +2.5/5.0
- 1% rule +2.1/10.0
- DSCR +1.5/10.0
$274,900
🖨 Deal sheet 📄 Offer letter ✓ Due diligence
Listing remarks MLS
SAVE UP TO $17,500 WITH COMBINED BUILDER AND PREFERRED LENDER INCENTIVES+ 10 YEAR EXTENDED WARRANTY! Mix and match your savings to customize your purchase. The perfect floor plan to call home. .. 3 bed, 2 bath in the South Warren school district with an open concept floor plan, 2 car attached garage and a large covered back porch on a tree lined lot! The great room flows beautifully into the dining space and gorgeous airy kitchen with a 6 foot island. .. .as well as a huge walk in pantry! This beautifully built home is waiting just for you!
Key facts
- Huge walk in pantry
- Tree lined lot
- 6,970 sq ft lot
Tags
Neighborhood map
What this means for you Summary
Snapshot
- This is a 3-bed/2.0-bath other listed at $275k.
Deal economics
- At list price, monthly cash flow is $-363 ($-4k/yr) — negative.
- To cash-flow at today's rent, offer at most $222k (19.1% below list).
- To meet the 1% rule (rent ≥ 1% of price), the offer needs to be $195k (29.2% below list).
- Recommended offer: $195k (29.2% below list) — sets the bar for 1% rule.
- Cap rate 4.7% vs local median 3.2% in Bowling Green — top-decile yield for the area; either an underpriced asset or a hidden risk that comps aren't pricing in. Stress-test before assuming the spread holds.
Location & tenants
- Location reads 65/100 on livability (#255 in KY) — a middle-class / working-renter tenant base. Strengths: cost of living A+, housing A+; Watch: crime C-, schools D+, amenities F.
- Warren County (rural): math 30% / reading 43% proficiency, ranked #48 of 165 in KY (top 29%) — families likely to look elsewhere, expect single-tenant / working-renter base with shorter leases.
- Market conditions: 2 active listings in the ZIP; 12 comparable units currently listed for rent nearby; rentals lingering (median 44d on market — plan ~5-8 weeks vacancy on turnover, expect pricing pressure); 67% of comp listings sitting > 30 days — soft ceiling on asking rent; 2,286 units permitted in Warren County in 2024 (1,410 in 5+ unit buildings).
Forward outlook
- In year one you build about $10k of equity ($2k loan paydown + $8k appreciation (3.0% local appreciation)).
- Warren County population projected at +41% by 2050 — long-run rental-demand tailwind backs the buy-and-hold thesis.
- By year 4, paydown + projected appreciation supports a ~$34k cash-out refi (75% LTV) — recoverable capital for the next deal without selling this one.
Negotiation context
- It's been on market 188 days — a 12% lower offer ($242k) is reasonable based on typical stale-listing flexibility.
Questions for the listing agent
- What do current leases actually rent for vs. the listed asking? Can we see a recent rent roll and the last 12 months of T-12 income?
- It's been on market 188 days. Have you received any prior offers? Is the seller open to a 29% concession, seller financing, or rate buy-down credit?
- Why hasn't it sold? Are there any deal-killer items the seller is aware of (foundation, flood, title, zoning, code violations)?
- Is there a deadline driving the sale (1031 exchange, divorce, estate, relocation)? That informs how much negotiation room exists.
- Schools are D-rated, which usually means shorter tenancies and higher turnover. Who's the typical renter profile here, and what's been the actual vacancy rate?
- The area grade is low — what's the realistic commute time and amenity access for the typical tenant pool here? Any planned neighborhood developments (good or bad) we should know about?
- What's the average days-on-market for RENTAL listings here right now (not sales)? A rising rental-DOM trend means longer vacancies and softer asking-rent achievability than the comps imply.
- What's the recent tenant-quality profile in this submarket — average credit score on applications, eviction rate, late-payment / NSF rate, and stable-employment percentage? A property-management company in the area should have these aggregated.
- How much new for-sale + rental construction is in the pipeline within 1–3 miles? Heavy new supply typically softens prices + rents 12–24 months out; constrained supply supports both.
Investment metrics
- 1% rule
- 0.71% ✗
- Cap rate
- 4.71%
- Cash-on-cash
- -5.65%
- DSCR
- 0.75
- GRM
- 11.8
CMA / ARV
- ARV (median comp)
- $302,712
- List price
- $274,900
- Delta
- -5.88%
- Verdict
- FAIR
- Comps
- 20 within 1.0 mi
Projected returns pro-forma
3.0% appreciation · 3.0% rent growth · sell at horizon
- IRR
- 2.3%
- Equity multiple
- 1.13×
- Total profit
- $10,048
- Equity at exit
- $123,607
- IRR
- 5.8%
- Equity multiple
- 1.89×
- Total profit
- $68,222
- Equity at exit
- $190,493
Cash invested: $76,972 (down + closing). Projections, not guarantees.
Landlord ↔ Tenant lean methodology
- Overall (STATE)
- 83 Strongly Landlord-Friendly
- State Kentucky
- 83 Strongly Landlord-Friendly · R+16
- County
- — inherits STATE
- City
- — inherits STATE
ZIP-level market 42102
- Active inventory
- 2
- Price-to-rent
- 11.8×
Monthly cashflow live
- Estimated rent
- $1,946 high interval (Pro) →
- Mortgage (P&I)
- −$1,442
- Tax est. 1.5%
- −$344 /mo · $4,124/yr
- Insurance
- −$115
- HOA
- −$0
- Vacancy / Maint / Mgmt
- −$409
- Net cashflow
- $-363
Break-even live
UW: 25.0% down · 7.5% · 30yr · 1.5% tax · 5.0% vac · 8.0% maint · 8.0% mgmt
Financing live
Cash to close
- Down payment
- $68,725
- Closing costs
- $8,247
- Reserves months
- —
- Total cash needed
- —
Loan-product check · same deal, 3 products live
Conventional
25% down · 7.5% · 30yr
- Down + closing
- —
- Monthly P&I
- —
- Monthly cashflow
- —
- DSCR
- —
- Eligible?
- —
Personal DTI + credit; lowest rate.
DSCR
20% down · 8.5% · 30yr
- Down + closing
- —
- Monthly P&I
- —
- Monthly cashflow
- —
- DSCR
- —
- Eligible?
- —
No personal income docs; deal must DSCR.
Hard money
10% down · 12.0% · 12mo
- Down + closing
- —
- Monthly P&I
- —
- Monthly cashflow
- —
- DSCR
- —
- Eligible?
- —
Short-term bridge; refi at stabilization.
Rent comps 12 comps
| Address | Beds | Baths | Sqft | Rent | $/sqft | DOM | Units | Dist |
|---|---|---|---|---|---|---|---|---|
| 1156 Shallowford St Bowling Green, KY | 4.0 | 2.0 | 1616 | $2,200 | $1.36 | 43d | 1 | 0.07mi |
| 317 Cedar Run St Bowling Green, KY | 3.0 | 2.0 | 1450 | $1,900 | $1.31 | 43d | 1 | 0.30mi |
| 476 Cedar Hollow Dr Bowling Green, KY | 4.0 | 2.0 | 1665 | $2,100 | $1.26 | 13d | 1 | 0.41mi |
| 428 Turkey Run Dr Bowling Green, KY | 3.0 | 2.0 | 1688 | $1,900 | $1.13 | 43d | 1 | 0.42mi |
| 1184 County House Ln Bowling Green, KY | 3.0 | 2.0 | 1440 | $2,000 | $1.39 | 43d | 1 | 0.45mi |
| 360 Cedar Hollow Dr Bowling Green, KY | 3.0 | 1.0 | 1349 | $1,600 | $1.19 | 43d | 1 | 0.54mi |
| 6567 Nashville Rd Bowling Green, KY | 2.0 | 2.0 | 1200 | $1,200 | $1.00 | 13d | 1 | 0.56mi |
| 6461 Fortuna Ave Bowling Green, KY | 3.0 | 2.0 | 1329 | $1,850 | $1.39 | 43d | 1 | 0.70mi |
| 6481 Fortuna Ave Bowling Green, KY | 3.0 | 2.5 | 1648 | $1,895 | $1.15 | 43d | 1 | 0.73mi |
| 6530 Fortuna Ave Unit 1 Bowling Green, KY | 3.0 | 2.5 | 1250 | $1,650 | $1.32 | 21d | 1 | 0.77mi |
| 442 Bourbon St Bowling Green, KY | 1.0–3.0 | 1.0–2.0 | 992 | $1,500 | $1.51 | 13d | 11 | 1.07mi |
| 3216 S Oak St Bowling Green, KY | 4.0 | 2.5 | 1788 | $2,295 | $1.28 | 43d | 1 | 1.33mi |
Listing history 17 events
-
2026-06-19days on market $274,900 Active 188 DOM
-
2026-06-18pricedays on market $274,900 Active 187 DOM
-
2026-06-17days on market $284,900 Active 186 DOM
-
2026-06-16days on market $284,900 Active 185 DOM
-
2026-06-15days on market $284,900 Active 184 DOM
-
2026-06-14days on market $284,900 Active 182 DOM
-
2026-06-13days on market $284,900 Active 181 DOM
-
2026-06-10days on market $284,900 Active 179 DOM
-
2026-06-09days on market $284,900 Active 178 DOM
-
2026-06-08days on market $284,900 Active 177 DOM
-
2026-06-07days on market $284,900 Active 176 DOM
-
2026-06-05days on market $284,900 Active 173 DOM
-
2026-06-02days on market $284,900 Active 171 DOM
-
2026-06-01days on market $284,900 Active 170 DOM
-
2026-05-31days on market $284,900 Active 169 DOM
-
2026-05-30days on market $284,900 Active 168 DOM
-
2025-12-13$284,900 Active 546-char remark
Show marketing remark (546 chars)
SAVE UP TO $17,500 WITH COMBINED BUILDER AND PREFERRED LENDER INCENTIVES+ 10 YEAR EXTENDED WARRANTY! Mix and match your savings to customize your purchase. The perfect floor plan to call home. .. 3 bed, 2 bath in the South Warren school district with an open concept floor plan, 2 car attached garage and a large covered back porch on a tree lined lot! The great room flows beautifully into the dining space and gorgeous airy kitchen with a 6 foot island. .. .as well as a huge walk in pantry! This beautifully built home is waiting just for you!
ⓘ Source: listings_history table (triggers on properties + properties_extension) + one-shot
backfill from property_details.listing_events for pre-trigger history.
Nearby sold comps map
Loading sold comps map…
Walkable amenities ~0.75 mi
Loading nearby amenities…
Taxation est. · year 1
- Rental income
- $23,349
- − Mortgage interest
- −$15,399
- − Property taxes
- −$4,124
- − Insurance
- −$1,374
- − Repairs & maintenance
- −$1,868
- − Management
- −$1,868
- − Depreciation
- −$7,997
- Taxable loss
- −$9,281
- Est. tax savings @ 24.0%
- +$2,227
- After-tax cash flow
- $-2,124/yr
For passive investors: Depreciation is non-cash, so a rental often shows a tax loss while cash-flowing — sheltering income. Rental losses are passive: they offset passive income freely, and up to $25,000/yr can offset ordinary (W-2) income if you actively participate and your MAGI is under $100k (phasing out to $0 by $150k); unused losses carry forward. On sale, claimed depreciation is recaptured at up to 25%, and gains may owe capital-gains tax (a 1031 exchange can defer both). Figures are a year-1 estimate at your 24.0% rate — not tax advice; consult a CPA.
Schools (NCES district)
- District
- Warren County
- NCES district ID
- 2105730
- Math proficiency
- 30% ▼ -18.00%
- Reading proficiency
- 43% ▼ -16.00%
- Median HH income
- $50,092
- Composite
- 31.55/100
- National rank
- #5958
- State rank
- #48 of 165 in KY
Livability — Bowling Green
- Score
- 65/100
- State rank
- #255
- US rank
- #12782
Category grades
Schools grade is shown separately in the Schools card above.
Census & demographics
No demographic data for this ZIP.
Market trends
- HPI YoY
- —
- Current HPI
- —
- Rent YoY
- —
- Metro
- —
- State GDP YoY
- ▲ 1.81%
- F500 in state
- 4
Industry mix (Fortune 500 HQ in KY)
| Industry | F500 HQs | Revenue |
|---|---|---|
| Healthcare | 1 | $118B |
|
||
| Food / Beverage | 1 | $7B |
|
||
Price history
1 event — show timeline
- 2025-12-13 Listed $284,900 RASKMLS
Cash-flow waterfall
monthlySold comps — $/sqft
last 12 mo · ≤1 miLoading sold comps…