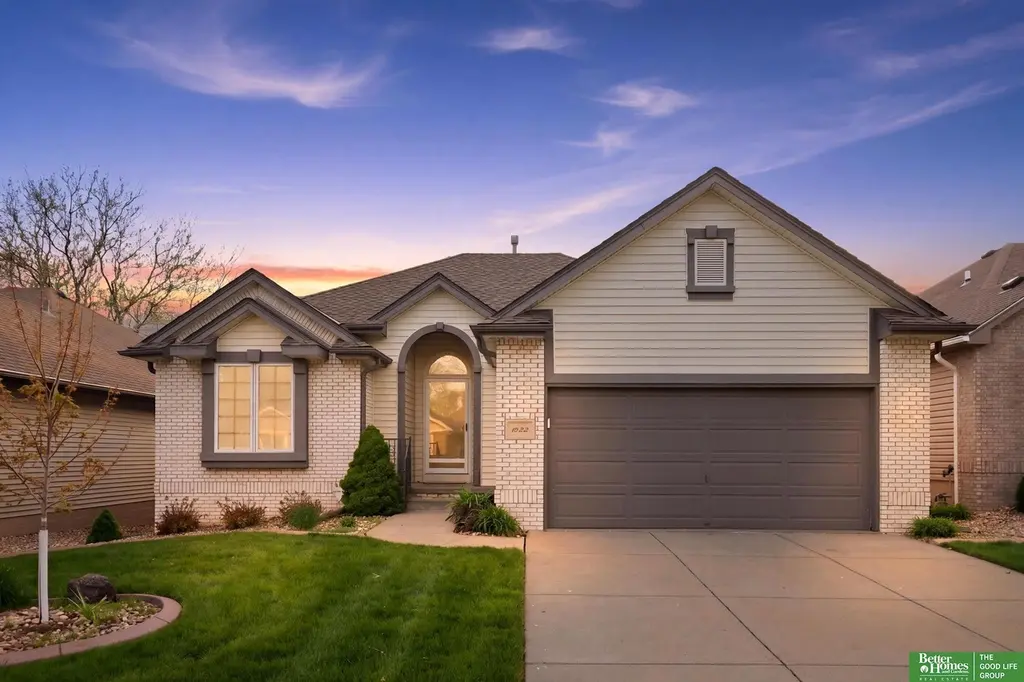
10032 S 172nd Cir · Gretna, NE
Flood risk 1/10 · Minimal
- FEMA flood zone
- X (unshaded)
- Chance of flooding over 30 yrs
- 0.0%
- Est. flood insurance / yr
- $473 – $860
Fire risk 1/10 · Minimal
- Est. fire insurance / yr
- $1,161 – $2,155
Heat risk 3/10 · Minor
- Hot days now (above 103°F)
- 7 days/yr
- Hot days in 30 yrs
- 16 days/yr
Wind risk 2/10 · Minimal
- Chance of severe wind over 30 yrs
- —
Air-quality risk 1/10 · Minimal
- Unhealthy air days now
- 0 days/yr
- Unhealthy air days in 30 yrs
- 0 days/yr
Risk factors via First Street. Map © Google.
Why this score? — see what drove the D- grade
The composite is a weighted blend of 9 inputs, each scored 0–100. Each bar is that input's sub-score; the figure is the points it added to the 100-point composite (weight × sub-score).
- ARV discount +10.2/15.0
- Cash flow +6.5/30.0
- Schools +5.8/10.0
- Appreciation +5.0/10.0
- Livability +4.1/5.0
- Rent growth +2.5/5.0
- Condition / age +2.5/5.0
- 1% rule +2.3/10.0
- DSCR +0.8/10.0
$400,000
🖨 Deal sheet 📄 Offer letter ✓ Due diligence
Listing remarks MLS
Step off your deck and walk over to the 9th tee on Hammerhead course. This par 5 ends up at the clubhouse and pool, 27 holes of golf. Lawn care and snow removal provided for your home. Front bedroom has new carpet, new paint throughout, new flooring in kitchen. Conforming lower level 3rd bedroom. New garbage disposal and faucet.
Key facts
- Office craft room
- Wood floors
- Spacious deck
Tags
Property features AI
Finance
- HOA & community: Association with monthly fee of $151; HOA covers maintenance of grounds, snow removal, common area maintenance, water and trash
Exterior
- Parking: Attached 2-car garage with garage door opener; Two covered parking spaces
- Utilities: Electricity available; Private water source; Public sewer
- Home design: Residential villa/patio home; Not new (built in 1996); Single-family design with finished basement
- Construction: Vinyl siding and brick exterior; Composition roof; Block foundation; Year built 1996
- Exterior features: Deck; Sprinkler system; Golf course frontage; Private roadway; Up to 1/4 acre lot
Interior
- Kitchen: Vaulted ceiling with dining area and interior balcony; Engineered wood floors; Range, Refrigerator, Microwave, Dishwasher
- Bedrooms: Primary bedroom on main floor with vaulted ceiling, bay/bow window, ceiling fan, walk-in closet and exterior door; Bedroom 2 on main floor with carpeting and window coverings; Bedroom 3 in basement with carpeting and window coverings; Basement contains additional finished living space
- Flooring: Engineered wood; Carpet; Ceramic tile; Vinyl
- Bathrooms: Three bathrooms total: two full and one three-quarter (includes primary bath with whirlpool and double sinks)
- Heating & cooling: Natural gas forced air heating; Central air conditioning
- Interior features: High ceilings; Ceiling fan(s); Fireplace in family room; Sump pump
- Laundry & utility: Washer and Dryer included
Neighborhood map
What this means for you Summary
Snapshot
- This is a 2-bed/2.0-bath single-family listed at $400k.
Deal economics
- At list price, monthly cash flow is $-670 ($-8k/yr) — negative.
- To cash-flow at today's rent, offer at most $282k (29.6% below list).
- To meet the 1% rule (rent ≥ 1% of price), the offer needs to be $290k (27.5% below list).
- Recommended offer: $282k (29.6% below list) — sets the bar for cash-flow.
- Cap rate 4.3% vs local median 2.5% in Gretna — top-decile yield for the area; either an underpriced asset or a hidden risk that comps aren't pricing in. Stress-test before assuming the spread holds.
Location & tenants
- Location reads 82/100 on livability (#13 in NE, #1,227 nationally) — a professional / high-income tenant draw. Strengths: crime A+, cost of living A+, housing A+; Watch: amenities F, commute F.
- Gretna Public Schools (suburban): math 64% / reading 64% proficiency, ranked #6 of 111 in NE (top 5%) — acceptable for families but not a draw, mixed tenant base, ~2y average lease; only 5% free/reduced lunch — higher-income household profile.
- Zoned schools: Palisades Elementary School (math 79% / reading 74%, grade A, #17 of 502 statewide, top 3%, 490 students, 6% FRL); Aspen Creek Middle School (math 65% / reading 63%, grade B+, #12 of 128 statewide, top 9%, 777 students, 9% FRL) — zoned schools at 8% FRL track the district average.
- Market conditions: 2 active listings in the ZIP; 1 comparable units currently listed for rent nearby; 1,612 units permitted in Sarpy County in 2024 (364 in 5+ unit buildings).
Forward outlook
- In year one you build about $15k of equity ($3k loan paydown + $12k appreciation (3.0% local appreciation)).
- Sarpy County population projected at +41% by 2050 — long-run rental-demand tailwind backs the buy-and-hold thesis.
- By year 3, paydown + projected appreciation supports a ~$37k cash-out refi (75% LTV) — recoverable capital for the next deal without selling this one.
Negotiation context
- It's been on market 16 days — a 2% lower offer ($394k) is reasonable based on typical stale-listing flexibility.
- 3 sale attempts since 14y ago with the ask held roughly flat each time — persistent listings suggest the price (not the market) is what's stuck; bring a comps-based counter.
- Current owner paid $183k; list at $400k implies a 119% gain — meaningful room to come down on a strong offer.
Questions for the listing agent
- What do current leases actually rent for vs. the listed asking? Can we see a recent rent roll and the last 12 months of T-12 income?
- What does the HOA fee cover, when was the last increase, and are there any pending special assessments or reserve-fund shortfalls?
- Is there a deadline driving the sale (1031 exchange, divorce, estate, relocation)? That informs how much negotiation room exists.
- Schools are A-rated — typically a magnet for longer-tenancy family renters. What's the average tenant stay here, and is there a school-zone premium baked into asking?
- The area grade is low — what's the realistic commute time and amenity access for the typical tenant pool here? Any planned neighborhood developments (good or bad) we should know about?
- What's the average days-on-market for RENTAL listings here right now (not sales)? A rising rental-DOM trend means longer vacancies and softer asking-rent achievability than the comps imply.
- What's the recent tenant-quality profile in this submarket — average credit score on applications, eviction rate, late-payment / NSF rate, and stable-employment percentage? A property-management company in the area should have these aggregated.
- How much new for-sale + rental construction is in the pipeline within 1–3 miles? Heavy new supply typically softens prices + rents 12–24 months out; constrained supply supports both.
Investment metrics
- 1% rule
- 0.73% ✗
- Cap rate
- 4.28%
- Cash-on-cash
- -7.18%
- DSCR
- 0.68
- GRM
- 11.5
CMA / ARV
- ARV (median comp)
- $425,099
- List price
- $400,000
- Delta
- -5.90%
- Verdict
- FAIR
- Comps
- 20 within 1.0 mi
Show comp detail 12 sales within ~0.75 mi
| Address | Dist | Beds/Ba | Sqft | Sold | Price | $/sf | Match |
|---|---|---|---|---|---|---|---|
| 17125 Colony Dr | 0.17mi | 3/3.0 (+1) | 2,330 (+0%) | 5mo | $345,000 | $148 | 78 |
| 17402 Augusta Cir | 0.30mi | 3/3.5 (+1) | 2,323 (+0%) | 1mo | $475,000 | $204 | 74 |
| 9810 S 175th Cir | 0.37mi | 2/2.5 | 2,478 (+7%) | 1mo | $345,000 | $139 | 69 |
| 17117 Colony Dr | 0.15mi | 3/2.5 (+1) | 2,457 (+6%) | 10mo | $380,000 | $155 | 68 |
| 17011 Colony Dr | 0.21mi | 3/3.0 (+1) | 2,298 (-1%) | 14mo | $377,000 | $164 | 68 |
| 10131 S 172 Cir | 0.09mi | 3/3.0 (+1) | 2,444 (+5%) | 18mo | $350,000 | $143 | 63 |
| 16815 Colony Cir | 0.31mi | 3/3.0 (+1) | 2,223 (-4%) | 14mo | $366,000 | $165 | 58 |
| 9983 S 171st St | 0.08mi | 3/3.0 (+1) | 2,002 (-14%) | 9mo | $301,000 | $150 | 57 |
| 9316 S 168th Avenue Circle | 0.49mi | 3/2.5 (+1) | 2,180 (-6%) | 22mo | $350,000 | $161 | 42 |
| 10814 S 172nd St | 0.61mi | 3/2.5 (+1) | 2,094 (-10%) | 12mo | $450,000 | $215 | 38 |
| 9516 S 175 Cir | 0.43mi | 3/2.5 (+1) | 2,608 (+12%) | 19mo | $450,000 | $173 | 36 |
| 17805 Palisades Dr | 0.74mi | 3/2.5 (+1) | 1,986 (-14%) | 11mo | $370,000 | $186 | 25 |
Match score weights: distance 35% · size 25% · config 20% · recency 20%. Top-matched comps best support the ARV.
Projected returns pro-forma
3.0% appreciation · 3.0% rent growth · sell at horizon
- IRR
- 0.9%
- Equity multiple
- 1.05×
- Total profit
- $5,660
- Equity at exit
- $179,857
- IRR
- 4.7%
- Equity multiple
- 1.72×
- Total profit
- $80,267
- Equity at exit
- $277,182
Cash invested: $112,000 (down + closing). Projections, not guarantees.
Landlord ↔ Tenant lean methodology
- Overall (STATE)
- 83 Strongly Landlord-Friendly
- State Nebraska
- 83 Strongly Landlord-Friendly · R+13
- County
- — inherits STATE
- City
- — inherits STATE
ZIP-level market 68136-9999
- Active inventory
- 2
- Price-to-rent
- 11.5×
Monthly cashflow live
- Estimated rent
- $2,900 medium interval (Pro) →
- Mortgage (P&I)
- −$2,098
- Tax from tax record
- −$546 /mo · $6,552/yr
- Insurance
- −$167
- HOA
- −$151
- Vacancy / Maint / Mgmt
- −$609
- Net cashflow
- $-670
Break-even live
UW: 25.0% down · 7.5% · 30yr · 1.5% tax · 5.0% vac · 8.0% maint · 8.0% mgmt
Financing live
Cash to close
- Down payment
- $100,000
- Closing costs
- $12,000
- Reserves months
- —
- Total cash needed
- —
Loan-product check · same deal, 3 products live
Conventional
25% down · 7.5% · 30yr
- Down + closing
- —
- Monthly P&I
- —
- Monthly cashflow
- —
- DSCR
- —
- Eligible?
- —
Personal DTI + credit; lowest rate.
DSCR
20% down · 8.5% · 30yr
- Down + closing
- —
- Monthly P&I
- —
- Monthly cashflow
- —
- DSCR
- —
- Eligible?
- —
No personal income docs; deal must DSCR.
Hard money
10% down · 12.0% · 12mo
- Down + closing
- —
- Monthly P&I
- —
- Monthly cashflow
- —
- DSCR
- —
- Eligible?
- —
Short-term bridge; refi at stabilization.
Rent comps 1 comps
| Address | Beds | Baths | Sqft | Rent | $/sqft | DOM | Units | Dist |
|---|---|---|---|---|---|---|---|---|
| 17510 Robin Dr Omaha, NE | 3.0 | 3.0 | 2201 | $2,900 | $1.32 | 2d | 1 | 1.22mi |
HOA detail
- Monthly dues
- $151 · $1,812/yr
- Likely covers
- trashlandscapingsnow removalpool
Listing history 17 events
-
2026-06-18days on market $400,000 Active 16 DOM
-
2026-06-17days on market $400,000 Active 15 DOM
-
2026-06-16days on market $400,000 Active 14 DOM
-
2026-06-15days on market $400,000 Active 13 DOM
-
2026-06-13days on market $400,000 Active 11 DOM
-
2026-06-10days on market $400,000 Active 8 DOM
-
2026-06-09days on market $400,000 Active 7 DOM
-
2026-06-08statusdays on market $400,000 Active 6 DOM
-
2026-06-07days on market $400,000 New 5 DOM
-
2026-06-03statusdays on market $400,000 New 1 DOM
-
2026-04-27$400,000 Active 890-char remark
-
2012-10-26soldstatus $183,000 333-char remark
Show marketing remark (333 chars)
Step off your deck and walk over to the 9th tee on Hammerhead course. This par 5 ends up at the clubhouse and pool, 27 holes of golf. Lawn care and snow removal provided for your home. Front bedroom has new carpet, new paint throughout, new flooring in kitchen. Conforming lower level 3rd bedroom. New garbage disposal and faucet.
-
2012-10-17soldstatus $183,000
-
2012-08-16historical 333-char remark
Show marketing remark (333 chars)
Step off your deck and walk over to the 9th tee on Hammerhead course. This par 5 ends up at the clubhouse and pool, 27 holes of golf. Lawn care and snow removal provided for your home. Front bedroom has new carpet, new paint throughout, new flooring in kitchen. Conforming lower level 3rd bedroom. New garbage disposal and faucet.
-
2012-06-11$189,000 333-char remark
Show marketing remark (333 chars)
Step off your deck and walk over to the 9th tee on Hammerhead course. This par 5 ends up at the clubhouse and pool, 27 holes of golf. Lawn care and snow removal provided for your home. Front bedroom has new carpet, new paint throughout, new flooring in kitchen. Conforming lower level 3rd bedroom. New garbage disposal and faucet.
-
1998-05-19soldstatus $200,000
-
1995-10-05soldstatus $159,707
ⓘ Source: listings_history table (triggers on properties + properties_extension) + one-shot
backfill from property_details.listing_events for pre-trigger history.
Tax reassessment forecast NE · Resets to sale price
- Current annual tax
- $6,552 · $546/mo
- Projected year-2 tax
- $6,920 · $577/mo
- Expected delta
- +$368/yr (+$31/mo · 5.6%)
ⓘ Screening estimate from a state-policy table — verify with the county assessor before closing.
Climate risk First Street
- Flood 1/10 Low FEMA zone X (unshaded) · 0% chance over 30 yrs
- Wildfire 1/10 Low
- Heat 3/10 Moderate 7 d/yr ≥103°F today · 16 d/yr by 30 yrs out
- Wind 2/10 Low
- Air quality 1/10 Low 0 unhealthy d/yr today · 0 by 30 yrs out
Nearby sold comps map
Loading sold comps map…
Walkable amenities ~0.75 mi
Loading nearby amenities…
Taxation est. · year 1
- Rental income
- $34,800
- − Mortgage interest
- −$22,406
- − Property taxes
- −$6,552
- − Insurance
- −$2,000
- − Repairs & maintenance
- −$2,784
- − Management
- −$2,784
- − HOA
- −$1,812
- − Depreciation
- −$11,636
- Taxable loss
- −$15,174
- Est. tax savings @ 24.0%
- +$3,642
- After-tax cash flow
- $-4,402/yr
For passive investors: Depreciation is non-cash, so a rental often shows a tax loss while cash-flowing — sheltering income. Rental losses are passive: they offset passive income freely, and up to $25,000/yr can offset ordinary (W-2) income if you actively participate and your MAGI is under $100k (phasing out to $0 by $150k); unused losses carry forward. On sale, claimed depreciation is recaptured at up to 25%, and gains may owe capital-gains tax (a 1031 exchange can defer both). Figures are a year-1 estimate at your 24.0% rate — not tax advice; consult a CPA.
Schools (NCES district)
- District
- Gretna Public Schools
- NCES district ID
- 3171220
- Math proficiency
- 64% ▼ -10.00%
- Reading proficiency
- 64% ▼ -4.00%
- Median HH income
- $89,845
- Composite
- 58.21/100
- National rank
- #1023
- State rank
- #6 of 111 in NE
Livability — Gretna
- Score
- 82/100
- State rank
- #13
- US rank
- #1227
Category grades
Schools grade is shown separately in the Schools card above.
Census & demographics
No demographic data for this ZIP.
Market trends
- HPI YoY
- —
- Current HPI
- —
- Rent YoY
- —
- Metro
- —
- State GDP YoY
- ▲ 0.68%
- F500 in state
- 2
Industry mix (Fortune 500 HQ in NE)
| Industry | F500 HQs | Revenue |
|---|---|---|
| Conglomerate | 1 | $371B |
|
||
Price history
+150.5% since first listed9 events — show timeline
- 2026-05-19 Listing Removed — GPRMLS
- 2026-05-19 Listed $400,000 GPRMLS
- 2026-04-27 Listed $400,000 GPRMLS
- 2012-10-26 Sold (MLS) $183,000 GPRMLS
- 2012-10-17 Sold (Public Records) $183,000 Public Records
- 2012-08-16 Listing Removed — GPRMLS
- 2012-06-11 Listed $189,000 GPRMLS
- 1998-05-19 Sold (Public Records) $200,000 Public Records
- 1995-10-05 Sold (Public Records) $159,707 Public Records
Property tax history
+3.2%/yrLatest (2025): $6,552 · -6.6% YoY. Source: county tax records.
Cash-flow waterfall
monthlySold comps — $/sqft
last 12 mo · ≤1 miLoading sold comps…