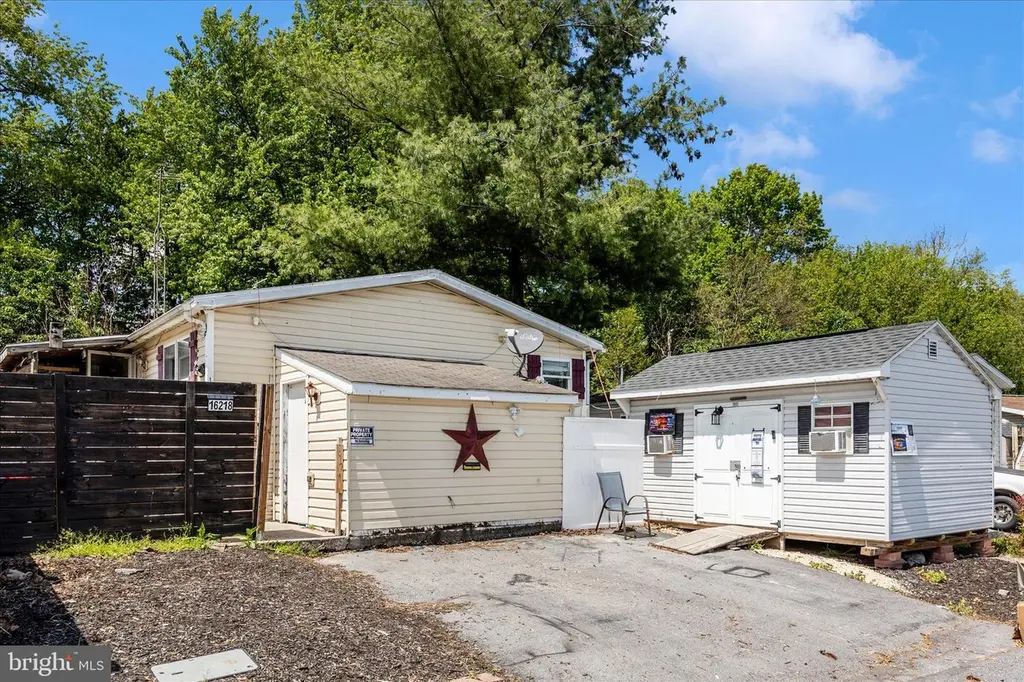
16218 Mcgregor Dr · Wilson-Conococheague, MD
Flood risk 1/10 · Minimal
- FEMA flood zone
- X (unshaded)
- Chance of flooding over 30 yrs
- 0.0%
- Est. flood insurance / yr
- $507 – $1,088
Fire risk 3/10 · Minor
- Est. fire insurance / yr
- $755 – $1,403
Heat risk 5/10 · Moderate
- Hot days now (above 102°F)
- 7 days/yr
- Hot days in 30 yrs
- 16 days/yr
Wind risk 2/10 · Minimal
- Chance of severe wind over 30 yrs
- 3.0%
Air-quality risk 3/10 · Minor
- Unhealthy air days now
- 2 days/yr
- Unhealthy air days in 30 yrs
- 4 days/yr
Risk factors via First Street. Map © Google.
Why this score? — see what drove the B- grade
The composite is a weighted blend of 9 inputs, each scored 0–100. Each bar is that input's sub-score; the figure is the points it added to the 100-point composite (weight × sub-score).
- Cash flow +27.6/30.0
- ARV discount +13.8/15.0
- DSCR +9.7/10.0
- 1% rule +6.9/10.0
- Rent growth +3.5/5.0
- Livability +2.5/5.0
- Condition / age +2.5/5.0
- Schools +2.3/10.0
- Appreciation +0.0/10.0
$140,000
🖨 Deal sheet (PDF) 📄 Offer letter ✓ Due diligence
Listing remarks
Spacious double-wide home featuring 3 bedrooms and 2 full bathrooms. Step into a bright and inviting living room with luxury vinyl plank flooring. The kitchen offers ample cabinet space and opens to a large dining area, perfect for everyday living and entertaining. The owner’s suite includes a private full bathroom, while bedrooms two and three are generously sized and share a second full bath. Enjoy outdoor living with a fenced yard and a storage shed. Private parking included. Conveniently located near shopping, restaurants, and major highways.
Key facts
- 5,500 sq ft lot
- Built 1991
- Listed 45 days
Property features AI
Finance
- Other: Fee simple ownership
- HOA & community: HOA fee of $209 collected semi-annually
Exterior
- Parking: Off-street parking
- Utilities: Public water; Public sewer; Natural gas; Electric hot water
- Home design: Detached structure; Modular/manufactured frame construction with vinyl siding; Shingle roof; Crawl space foundation; Single-story living (main-level bedrooms and baths)
- Construction: Frame and modular/manufactured construction; Vinyl siding exterior; Shingle roof; Crawl space foundation; Building not winterized
- Exterior features: Detached shed on the property; Not in a federal flood zone; Blacktop road access; Outside city limits (Hagerstown municipality)
Interior
- Kitchen: Dishwasher; Exhaust fan
- Bedrooms: Three bedrooms on the main level (Living Room, Master Bedroom, Bedroom 2, Bedroom 3 listed)
- Bathrooms: Two full bathrooms on the main level
- Heating & cooling: Forced air heating (natural gas); Ceiling fan(s) for cooling; Electric hot water
- Interior features: Combination kitchen and dining area; Window treatments; Drywall walls and ceilings; Not furnished
- Laundry & utility: No basement (no below-grade finished area listed)
Neighborhood map
What this means for you Summary
Snapshot
- This is a 3-bed/2.0-bath single-family listed at $140k.
Deal economics
- At list price, monthly cash flow is $420 ($5k/yr) — positive.
- The deal already cash-flows at list — no discount required.
- Meets the 1% rule at list price ($2k rent vs $140k).
- Recommended offer: $136k (3.0% below list) — sets the bar for market timing.
Location & tenants
- Location reads: area grade B — affects rentability + tenant quality, not the cash-flow math above.
- Washingtion County Public Schools (suburban): math 18% / reading 33% proficiency, ranked #13 of 24 in MD (top 54%) — low school quality limits family demand, transient renter base, plan for 1-2y turnover.
- Zoned schools: Clear Spring Middle (math 14% / reading 40%, grade F, #81 of 225 statewide, top 38%, 329 students, 49% FRL); Clear Spring High (math 62% / reading 77%, grade B, #40 of 222 statewide, top 19%, 451 students, 49% FRL).
- Zoned-school proficiency averages 48% at this address vs 26% district-wide (+23 pts) — the actual schools serving this property are materially stronger than the Washingtion County Public Schools average implies; a family-tenant draw the district grade alone would hide.
- Market conditions: Rents rising fast (+4.0%/yr); 383 active listings in the ZIP; 1 comparable units currently listed for rent nearby; 232 units permitted in Washington County in 2024 (12 in 5+ unit buildings).
- This rent runs 32% of the median local income ($63k/yr) — at the standard rent-burdened threshold; future hikes will face affordability resistance.
Forward outlook
- Local home prices are declining (-3.0%/yr); year-one equity from $968 of loan paydown is wiped out by about $4k of value loss. Plan a longer hold.
- At projected returns (-3.0% appreciation + 4.0% rent growth), your $39k cash investment doubles in ~9 years — after that, you're playing with house money.
Negotiation context
- It's been on market 45 days — a 3% lower offer ($136k) is reasonable based on typical stale-listing flexibility.
- 2 sale attempts since 28y ago; this cycle's ask has dropped $10k (7%) from the opening price — seller is motivated, your offer sets the floor, not the list.
- Current owner paid $61k; list at $140k implies a 130% gain — meaningful room to come down on a strong offer.
Risks & watch-outs
- Climate carrying-cost: extreme-heat days projected 7→16/yr by 2055 (HVAC capex compounding) — expect insurance premiums to compound above CPI over the hold.
Questions for the listing agent
- It's been on market 45 days. Have you received any prior offers? Is the seller open to a 3% concession, seller financing, or rate buy-down credit?
- What does the HOA fee cover, when was the last increase, and are there any pending special assessments or reserve-fund shortfalls?
- Is there a deadline driving the sale (1031 exchange, divorce, estate, relocation)? That informs how much negotiation room exists.
- What's the average days-on-market for RENTAL listings here right now (not sales)? A rising rental-DOM trend means longer vacancies and softer asking-rent achievability than the comps imply.
- What's the recent tenant-quality profile in this submarket — average credit score on applications, eviction rate, late-payment / NSF rate, and stable-employment percentage? A property-management company in the area should have these aggregated.
- How much new for-sale + rental construction is in the pipeline within 1–3 miles? Heavy new supply typically softens prices + rents 12–24 months out; constrained supply supports both.
Investment metrics
- 1% rule
- 1.19% ✓
- Cap rate
- 9.89%
- Cash-on-cash
- 12.84%
- DSCR
- 1.57
- GRM
- 7.0
CMA / ARV
- ARV (median comp)
- $162,827
- List price
- $140,000
- Delta
- -14.02%
- Verdict
- UNDERPRICED
- Comps
- 20 within 1.0 mi
Show comp detail 12 sales within ~0.75 mi
| Address | Dist | Beds/Ba | Sqft | Sold | Price | $/sf | Match |
|---|---|---|---|---|---|---|---|
| 12023 Heather Dr | 0.16mi | 3/2.0 | 1,056 (0%) | 13mo | $90,000 | $85 | 82 |
| 11925 Heather Dr | 0.25mi | 3/2.0 | 1,056 (0%) | 9mo | $162,500 | $154 | 81 |
| 12009 S Scottish Ct | 0.21mi | 3/1.0 | 1,064 (+1%) | 8mo | $142,400 | $134 | 78 |
| 12020 Heather Dr | 0.14mi | 3/2.0 | 1,056 (0%) | 18mo | $130,000 | $123 | 78 |
| 12110 Heather Dr | 0.12mi | 3/2.0 | 1,056 (0%) | 22mo | $169,900 | $161 | 76 |
| 12016 Heather Dr | 0.05mi | 3/2.0 | 1,152 (+9%) | 12mo | $162,000 | $141 | 73 |
| 12025 N Scottish Ct | 0.19mi | 2/2.0 (-1) | 960 (-9%) | 4mo | $145,000 | $151 | 67 |
| 12036 N Scottish Ct | 0.17mi | 3/1.0 | 960 (-9%) | 7mo | $145,000 | $151 | 67 |
| 16212 Mcgregor Dr | 0.02mi | 3/2.0 | 1,152 (+9%) | 21mo | $150,000 | $130 | 66 |
| 16301 Mcgregor Dr | 0.14mi | 3/1.5 | 960 (-9%) | 13mo | $139,000 | $145 | 65 |
| 16213 Dundee Ct | 0.08mi | 3/2.0 | 1,152 (+9%) | 23mo | $160,000 | $139 | 62 |
| 16305 Ayrshire Ct | 0.11mi | 3/1.5 | 960 (-9%) | 23mo | $130,000 | $135 | 59 |
Match score weights: distance 35% · size 25% · config 20% · recency 20%. Top-matched comps best support the ARV.
Projected returns pro-forma
-3.0% appreciation · 4.0% rent growth · sell at horizon
- IRR
- 3.7%
- Equity multiple
- 1.15×
- Total profit
- $5,707
- Equity at exit
- $20,874
- IRR
- 14.1%
- Equity multiple
- 2.18×
- Total profit
- $46,384
- Equity at exit
- $12,105
Cash invested: $39,200 (down + closing). Projections, not guarantees.
Landlord ↔ Tenant lean methodology
- Overall (STATE)
- 27 Tenant-Leaning
- State Maryland
- 27 Tenant-Leaning · D+14
- County
- — inherits STATE
- City
- — inherits STATE
ZIP-level market 21740
- Rents YoY
- 4.0%
- Active inventory
- 383
- Price-to-rent
- 7.0×
Monthly cashflow live
- Estimated rent
- $1,665 medium interval (Pro) →
- Mortgage (P&I)
- −$734
- Tax from tax record
- −$68 /mo · $816/yr
- Insurance
- −$58
- HOA
- −$35
- Lot rent
- −$0
- Vacancy / Maint / Mgmt
- −$350
- Net cashflow
- $420
Break-even live
Sensitivity live
| Price | -10% $499 | -5% $459 | +0% $420 | +5% $380 | +10% $340 |
|---|---|---|---|---|---|
| Rent | -10% $288 | -5% $354 | +0% $420 | +5% $485 | +10% $551 |
| Rate | -1.0pp $490 | -0.5pp $455 | base $420 | +0.5pp $383 | +1.0pp $346 |
UW: 25.0% down · 7.5% · 30yr · 1.5% tax · 5.0% vac · 8.0% maint · 8.0% mgmt
Financing live
Cash to close
- Down payment
- $35,000
- Closing costs
- $4,200
- Reserves months
- —
- Total cash needed
- —
Loan-product check · same deal, 3 products live
Conventional
25% down · 7.5% · 30yr
- Down + closing
- —
- Monthly P&I
- —
- Monthly cashflow
- —
- DSCR
- —
- Eligible?
- —
Personal DTI + credit; lowest rate.
DSCR
20% down · 8.5% · 30yr
- Down + closing
- —
- Monthly P&I
- —
- Monthly cashflow
- —
- DSCR
- —
- Eligible?
- —
No personal income docs; deal must DSCR.
Hard money
10% down · 12.0% · 12mo
- Down + closing
- —
- Monthly P&I
- —
- Monthly cashflow
- —
- DSCR
- —
- Eligible?
- —
Short-term bridge; refi at stabilization.
Rent comps 1 comps
| Address | Beds | Baths | Sqft | Rent | $/sqft | DOM | Units | Dist |
|---|---|---|---|---|---|---|---|---|
| 11906 Heather Dr Hagerstown, MD | 3.0 | 2.0 | 1344 | $1,800 | $1.34 | 23d | 1 | 0.24mi |
HOA detail
- Monthly dues
- $35 · $420/yr
- Likely covers
- parking
Listing history 21 events
-
2026-06-22pricedays on market $140,000 Active 45 DOM
-
2026-06-18days on market $145,000 Active 42 DOM
-
2026-06-17days on market $145,000 Active 41 DOM
-
2026-06-16days on market $145,000 Active 40 DOM
-
2026-06-15days on market $145,000 Active 39 DOM
-
2026-06-14days on market $145,000 Active 37 DOM
-
2026-06-13days on market $145,000 Active 36 DOM
-
2026-06-10days on market $145,000 Active 34 DOM
-
2026-06-09days on market $145,000 Active 33 DOM
-
2026-06-08pricedays on market $145,000 Active 32 DOM
-
2026-06-07days on market $150,000 Active 31 DOM
-
2026-06-03days on market $150,000 Active 27 DOM
-
2026-06-02days on market $150,000 Active 26 DOM
-
2026-06-01days on market $150,000 Active 25 DOM
-
2026-05-31days on market $150,000 Active 24 DOM
-
2026-05-30days on market $150,000 Active 23 DOM
-
2026-05-08$150,000 Active 558-char remark
-
2026-05-05historical $150,000 558-char remark
-
1999-03-02historical
-
1998-12-15
-
1991-10-30soldstatus $60,900
ⓘ Source: listings_history table (triggers on properties + properties_extension) + one-shot
backfill from property_details.listing_events for pre-trigger history.
Tax reassessment forecast MD · Partial reset (capped growth)
- Current annual tax
- $816 · $68/mo
- Projected year-2 tax
- $1,171 · $98/mo
- Expected delta
- +$355/yr (+$30/mo · 43.6%)
ⓘ Screening estimate from a state-policy table — verify with the county assessor before closing.
Climate risk First Street
- Flood 1/10 Low FEMA zone X (unshaded) · 0% chance over 30 yrs
- Wildfire 3/10 Moderate
- Heat 5/10 Major 7 d/yr ≥102°F today · 16 d/yr by 30 yrs out
- Wind 2/10 Low 3% chance of damaging wind over 30 yrs
- Air quality 3/10 Moderate 2 unhealthy d/yr today · 4 by 30 yrs out
Nearby sold comps map
Loading sold comps map…
Walkable amenities ~0.75 mi
Loading nearby amenities…
Taxation est. · year 1
- Rental income
- $19,975
- − Mortgage interest
- −$7,842
- − Property taxes
- −$816
- − Insurance
- −$700
- − Repairs & maintenance
- −$1,598
- − Management
- −$1,598
- − HOA
- −$420
- − Depreciation
- −$4,073
- Taxable income
- $2,929
- Est. tax owed @ 24.0%
- −$703
- After-tax cash flow
- $4,332/yr
For passive investors: Depreciation is non-cash, so a rental often shows a tax loss while cash-flowing — sheltering income. Rental losses are passive: they offset passive income freely, and up to $25,000/yr can offset ordinary (W-2) income if you actively participate and your MAGI is under $100k (phasing out to $0 by $150k); unused losses carry forward. On sale, claimed depreciation is recaptured at up to 25%, and gains may owe capital-gains tax (a 1031 exchange can defer both). Figures are a year-1 estimate at your 24.0% rate — not tax advice; consult a CPA.
Schools (NCES district)
- District
- Washingtion County Public Schools
- NCES district ID
- 2400660
- Math proficiency
- 18% ▼ -20.00%
- Reading proficiency
- 33% ▼ -17.00%
- Median HH income
- $54,784
- Composite
- 22.87/100
- National rank
- #8007
- State rank
- #13 of 24 in MD
Livability — Wilson-Conococheague
No livability data for this city. (Only ~50 U.S. cities are tracked.)
Census & demographics
- Census place
- Wilson-Conococheague, MD
- County
- Washington County · 98,861 people
- Metro
- Hagerstown-Martinsburg, MD-WV
- Population (ZIP)
- 64,792
- Household income
- $62,873
- Rent vs Own
- Severe rent burden
- 2832.0
Population outlook (Washington County) Hauer SSP2
- Today (2025)
- 151,614 people
- By 2030
- 151,455 · -0.1%
- By 2040
- 150,097 · -1.0%
- By 2050
- 148,193 · -2.3%
- By 2075
- 146,581 · -3.3%
- By 2100
- 138,025 · -9.0%
Race, ethnicity, and origin ACS 2023
- Neighborhood character
- Majority White (64%)
- Race & ethnicity
- White 64% Black 18% Two or more races 10% Hispanic / Latino 10% Asian 2%
- Hispanic origin (detail)
- Mexican 2% Puerto Rican 2% Dominican 2%
- Common ancestry
- Romanian 2% Lithuanian 1% Slovak 1%
- Foreign-born
- 9% · Canada, China
- Languages at home
- 86% English-only · Spanish 9% French/Haitian/Cajun 1% Chinese 1%
Political lean MEDSL · Washington
- 2024 margin
- Strong R (+23.0) · D 37.3% · R 60.4% · Other 2.3%
- 2008→2024 swing
- -10.2pp toward R · 2008: -12.9pp · 2024: -23.0pp
- All cycles
- 2024: R+23.0 2020: R+20.9 2016: R+32.4 2012: R+18.5 2008: R+12.9
Not yet ingested
- Civics
- —
Market trends
- HPI YoY
- ▼ -248.38%
- Current HPI
- 264.8018
- Rent YoY
- ▲ 4.00%
- Metro
- Hagerstown-Martinsburg, MD-WV
- State GDP YoY
- ▲ 2.97%
- F500 in state
- 12
Industry mix (Fortune 500 HQ in MD)
| Industry | F500 HQs | Revenue |
|---|---|---|
| Aerospace / Defense | 1 | $71B |
|
||
| Utilities | 1 | $25B |
|
||
| Hotels | 1 | $24B |
|
||
| Consumer Goods | 1 | $7B |
|
||
| Real Estate | 1 | $6B |
|
||
| Chemicals | 1 | $2B |
|
||
Price history
+138.1% since first listed6 events — show timeline
- 2026-06-08 Price Changed $145,000 BRIGHT MLS
- 2026-05-08 Listed $150,000 BRIGHT MLS
- 2026-05-05 Coming Soon $150,000 BRIGHT MLS
- 1999-03-02 Delisted — MRIS
- 1998-12-15 Listed — MRIS
- 1991-10-30 Sold (Public Records) $60,900 Public Records
Property tax history
-0.7%/yrLatest (2025): $816 · +5.6% YoY. Source: county tax records.
Cash-flow waterfall
monthlySold comps — $/sqft
last 12 mo · ≤1 miLoading sold comps…