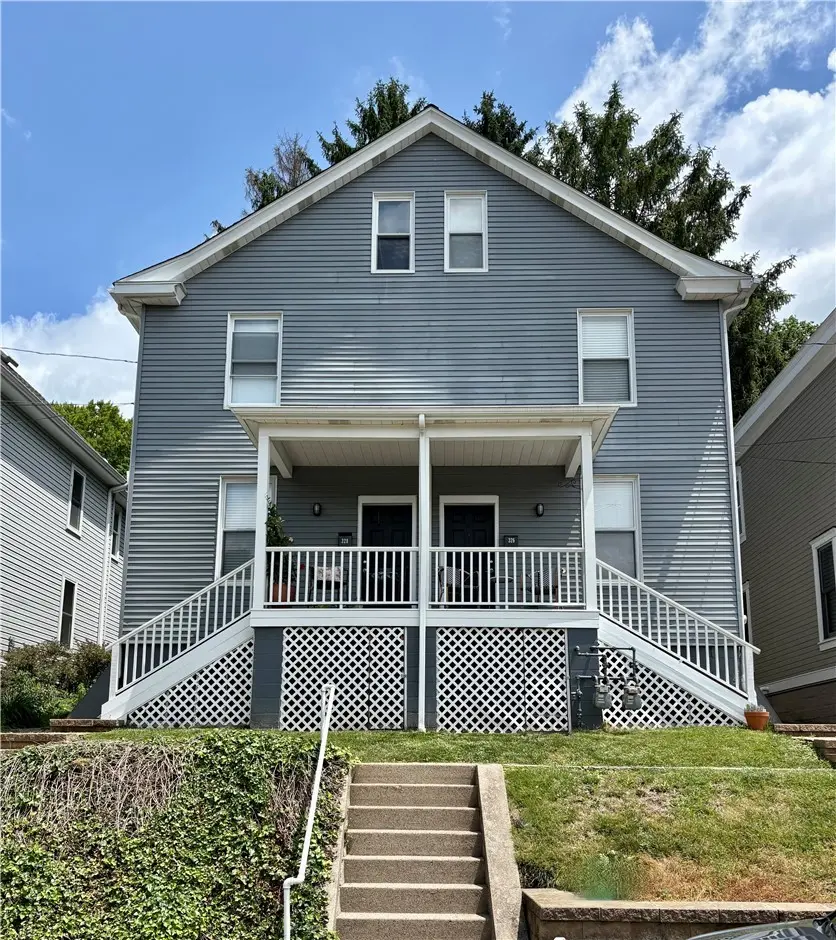
326/328 Highland Ln · Edgeworth, PA
Flood risk 1/10 · Minimal
- FEMA flood zone
- X (unshaded)
- Chance of flooding over 30 yrs
- 0.0%
- Est. flood insurance / yr
- $473 – $860
Fire risk 1/10 · Minimal
- Est. fire insurance / yr
- $511 – $949
Heat risk 3/10 · Minor
- Hot days now (above 98°F)
- 7 days/yr
- Hot days in 30 yrs
- 18 days/yr
Wind risk 2/10 · Minimal
- Chance of severe wind over 30 yrs
- —
Air-quality risk 3/10 · Minor
- Unhealthy air days now
- 2 days/yr
- Unhealthy air days in 30 yrs
- 3 days/yr
Risk factors via First Street. Map © Google.
Why this score? — see what drove the F grade
The composite is a weighted blend of 9 inputs, each scored 0–100. Each bar is that input's sub-score; the figure is the points it added to the 100-point composite (weight × sub-score).
- ARV discount +7.5/15.0
- Cash flow +7.0/30.0
- Schools +6.2/10.0
- Livability +3.9/5.0
- Rent growth +2.5/5.0
- Condition / age +2.5/5.0
- 1% rule +1.9/10.0
- DSCR +1.2/10.0
- Appreciation +0.0/10.0
$420,000
🖨 Deal sheet (PDF) 📄 Offer letter ✓ Due diligence
Listing remarks MLS
Duplex sold "as is" One unit is vacant. Quaker Valley School District, Convenient Location, near parks, roof @15 yrs old, new furnace 2014
Key facts
- Clean dry basements
- Bright living room
- Versatile bonus room
Tags
Property features AI
Finance
- Financial info: Two-unit property with current rent listed for one unit at $1,525
Exterior
- Parking: On-street parking
- Utilities: Electricity available; Natural gas available; Public water available; Public sewer available
- Home design: R3 zoning
- Construction: Frame construction; Asphalt roof; Built with a basement (walk-out)
- Exterior features: On-street parking
Interior
- Bedrooms: Two 2-bedroom units
- Bathrooms: Each unit has 2 bathrooms (1 full and 1 half)
- Interior features: Walk-out basement
Neighborhood map
What this means for you Summary
Snapshot
- This is a 4-bed/3.0-bath townhouse listed at $420k.
Deal economics
- At list price, monthly cash flow is $-625 ($-8k/yr) — negative.
- To cash-flow at today's rent, offer at most $330k (21.5% below list).
- To meet the 1% rule (rent ≥ 1% of price), the offer needs to be $288k (31.4% below list).
- Recommended offer: $288k (31.4% below list) — sets the bar for 1% rule.
Location & tenants
- Location reads 77/100 on livability (#323 in PA, #2,858 nationally) — a middle-class / working-renter tenant base. Strengths: crime A+, employment A+, housing A+; Watch: health & safety D, amenities F, cost of living F.
- Quaker Valley SD (suburban): math 61% / reading 82% proficiency, ranked #19 of 539 in PA (top 4%) — strong family-tenant draw, lease renewals of 3-5y typical; only 13% free/reduced lunch — higher-income household profile.
- Zoned schools: Quaker Valley Ms (math 45% / reading 80%, grade B+, #30 of 512 statewide, top 6%, 418 students, 25% FRL); Quaker Valley Hs (math 72%, 581 students, 18% FRL).
- Market conditions: 138 active listings in the ZIP; 8 comparable units currently listed for rent nearby; rentals leasing fast (median 3d on market — plan ~1-2 weeks tenant-placement turnaround); high-income renter base; 2,996 units permitted in Allegheny County in 2024 (1,588 in 5+ unit buildings).
Forward outlook
- Local home prices are declining (-3.0%/yr); year-one equity from $3k of loan paydown is wiped out by about $13k of value loss. Plan a longer hold.
Negotiation context
- Only 8 days on market — expect competitive offers; lowballing is unlikely to land.
- 2 sale attempts since 11y ago with the ask held roughly flat each time — persistent listings suggest the price (not the market) is what's stuck; bring a comps-based counter.
- Current owner paid $185k; list at $420k implies a 127% gain — meaningful room to come down on a strong offer.
Risks & watch-outs
- Watch-outs: built in 1920 — expect roof / HVAC / electrical / plumbing capex.
Questions for the listing agent
- What do current leases actually rent for vs. the listed asking? Can we see a recent rent roll and the last 12 months of T-12 income?
- Built in 1920 — when were the roof, HVAC, electrical panel, plumbing, and water heater last replaced?
- Is there a deadline driving the sale (1031 exchange, divorce, estate, relocation)? That informs how much negotiation room exists.
- Schools are A-rated — typically a magnet for longer-tenancy family renters. What's the average tenant stay here, and is there a school-zone premium baked into asking?
- The area grade is low — what's the realistic commute time and amenity access for the typical tenant pool here? Any planned neighborhood developments (good or bad) we should know about?
- What's the average days-on-market for RENTAL listings here right now (not sales)? A rising rental-DOM trend means longer vacancies and softer asking-rent achievability than the comps imply.
- What's the recent tenant-quality profile in this submarket — average credit score on applications, eviction rate, late-payment / NSF rate, and stable-employment percentage? A property-management company in the area should have these aggregated.
- How much new for-sale + rental construction is in the pipeline within 1–3 miles? Heavy new supply typically softens prices + rents 12–24 months out; constrained supply supports both.
Investment metrics
- 1% rule
- 0.69% ✗
- Cap rate
- 4.51%
- Cash-on-cash
- -6.38%
- DSCR
- 0.72
- GRM
- 12.1
CMA / ARV
No comps found within radius.
Projected returns pro-forma
-3.0% appreciation · 3.0% rent growth · sell at horizon
- IRR
- -27.3%
- Equity multiple
- 0.08×
- Total profit
- $-107,827
- Equity at exit
- $62,623
- IRR
- -25.3%
- Equity multiple
- -0.23×
- Total profit
- $-144,983
- Equity at exit
- $36,314
Cash invested: $117,600 (down + closing). Projections, not guarantees.
Landlord ↔ Tenant lean methodology
- Overall (STATE)
- 62 Landlord-Friendly
- State Pennsylvania
- 62 Landlord-Friendly · EVEN
- County
- — inherits STATE
- City
- — inherits STATE
ZIP-level market 15143
- Active inventory
- 138
- Price-to-rent
- 12.1×
Monthly cashflow live
- Estimated rent
- $2,883 high interval (Pro) →
- Mortgage (P&I)
- −$2,203
- Tax est. 1.5%
- −$525 /mo · $6,300/yr
- Insurance
- −$175
- HOA
- −$0
- Vacancy / Maint / Mgmt
- −$605
- Net cashflow
- $-625
Break-even live
Sensitivity live
| Price | -10% $-335 | -5% $-480 | +0% $-625 | +5% $-770 | +10% $-915 |
|---|---|---|---|---|---|
| Rent | -10% $-853 | -5% $-739 | +0% $-625 | +5% $-511 | +10% $-397 |
| Rate | -1.0pp $-414 | -0.5pp $-518 | base $-625 | +0.5pp $-734 | +1.0pp $-845 |
UW: 25.0% down · 7.5% · 30yr · 1.5% tax · 5.0% vac · 8.0% maint · 8.0% mgmt
Financing live
Cash to close
- Down payment
- $105,000
- Closing costs
- $12,600
- Reserves months
- —
- Total cash needed
- —
Loan-product check · same deal, 3 products live
Conventional
25% down · 7.5% · 30yr
- Down + closing
- —
- Monthly P&I
- —
- Monthly cashflow
- —
- DSCR
- —
- Eligible?
- —
Personal DTI + credit; lowest rate.
DSCR
20% down · 8.5% · 30yr
- Down + closing
- —
- Monthly P&I
- —
- Monthly cashflow
- —
- DSCR
- —
- Eligible?
- —
No personal income docs; deal must DSCR.
Hard money
10% down · 12.0% · 12mo
- Down + closing
- —
- Monthly P&I
- —
- Monthly cashflow
- —
- DSCR
- —
- Eligible?
- —
Short-term bridge; refi at stabilization.
Rent comps 8 comps
| Address | Beds | Baths | Sqft | Rent | $/sqft | DOM | Units | Dist |
|---|---|---|---|---|---|---|---|---|
| 325 Centennial Ave Sewickley, PA | 3.0 | 2.5 | 1654 | $3,850 | $2.33 | 3d | 1 | 0.84mi |
| 518 Broad St Unit 2 Sewickley, PA | 3.0 | 1.0 | 1200 | $2,350 | $1.96 | 45d | 1 | 1.03mi |
| 128 River Ridge Dr Coraopolis, PA | 4.0 | 3.0 | 2691 | $3,495 | $1.30 | 45d | 1 | 1.11mi |
| 327 Chestnut St Sewickley, PA | 3.0 | 1.0 | 1100 | $2,750 | $2.50 | 3d | 1 | 1.17mi |
| 732 Orchard Ter Sewickley, PA | 3.0 | 2.0 | 2090 | $3,300 | $1.58 | 3d | 1 | 1.20mi |
| 911 Nevin Ave Sewickley, PA | 4.0 | 2.0 | 1536 | $2,950 | $1.92 | 12d | 1 | 1.36mi |
| 634 Maple Ln Sewickley, PA | 3.0 | 2.5 | 1714 | $2,500 | $1.46 | 3d | 1 | 1.39mi |
| 220 Graham St Unit 5/E Sewickley, PA | 3.0 | 1.0 | 2000 | $2,000 | $1.00 | 3d | 1 | 1.40mi |
Listing history 7 events
-
2026-06-21days on market $420,000 Active 8 DOM
-
2026-06-18days on market $420,000 Active 5 DOM
-
2026-06-17days on market $420,000 Active 4 DOM
-
2026-06-16days on market $420,000 Active 3 DOM
-
2026-06-15days on market $420,000 Active 2 DOM
-
2026-06-13remarks 693-char remark
-
2026-06-13$420,000 Active 1 DOM
ⓘ Source: listings_history table (triggers on properties + properties_extension) + one-shot
backfill from property_details.listing_events for pre-trigger history.
Climate risk First Street
- Flood 1/10 Low FEMA zone X (unshaded) · 0% chance over 30 yrs
- Wildfire 1/10 Low
- Heat 3/10 Moderate 7 d/yr ≥98°F today · 18 d/yr by 30 yrs out
- Wind 2/10 Low
- Air quality 3/10 Moderate 2 unhealthy d/yr today · 3 by 30 yrs out
Nearby sold comps map
Loading sold comps map…
Walkable amenities ~0.75 mi
Loading nearby amenities…
Taxation est. · year 1
- Rental income
- $34,594
- − Mortgage interest
- −$23,527
- − Property taxes
- −$6,300
- − Insurance
- −$2,100
- − Repairs & maintenance
- −$2,768
- − Management
- −$2,768
- − Depreciation
- −$12,218
- Taxable loss
- −$15,086
- Est. tax savings @ 24.0%
- +$3,621
- After-tax cash flow
- $-3,881/yr
For passive investors: Depreciation is non-cash, so a rental often shows a tax loss while cash-flowing — sheltering income. Rental losses are passive: they offset passive income freely, and up to $25,000/yr can offset ordinary (W-2) income if you actively participate and your MAGI is under $100k (phasing out to $0 by $150k); unused losses carry forward. On sale, claimed depreciation is recaptured at up to 25%, and gains may owe capital-gains tax (a 1031 exchange can defer both). Figures are a year-1 estimate at your 24.0% rate — not tax advice; consult a CPA.
Schools (NCES district)
- District
- Quaker Valley SD
- NCES district ID
- 4219860
- Math proficiency
- 61% ▼ -7.00%
- Reading proficiency
- 82% ▼ -2.00%
- Median HH income
- $70,633
- Composite
- 62.5/100
- National rank
- #686
- State rank
- #19 of 539 in PA
Livability — Edgeworth
- Score
- 77/100
- State rank
- #323
- US rank
- #2858
Category grades
Schools grade is shown separately in the Schools card above.
Census & demographics
- Census place
- Edgeworth, PA
- County
- Allegheny County · 1,022,028 people
- Metro
- Pittsburgh, PA
- Population (ZIP)
- 21,851
- Household income
- $132,674
- Rent vs Own
- Severe rent burden
- 408.0
Population outlook (Allegheny County) Hauer SSP2
- Today (2025)
- 1,250,282 people
- By 2030
- 1,256,482 · +0.5%
- By 2040
- 1,256,318 · +0.5%
- By 2050
- 1,244,169 · -0.5%
- By 2075
- 1,197,693 · -4.2%
- By 2100
- 1,093,187 · -12.6%
Race, ethnicity, and origin ACS 2023
- Neighborhood character
- Predominantly White (83%)
- Race & ethnicity
- White 83% Asian 8% Two or more races 4% Black 3% Hispanic / Latino 1%
- Common ancestry
- Romanian 6% Slovak 2% Italian 2%
- Foreign-born
- 8% · China, Canada
- Languages at home
- 90% English-only · Other Asian/Pacific 3% Other Indo-European 3% Chinese 1%
Political lean MEDSL · Allegheny
- 2024 margin
- Strong D (+20.3) · D 59.7% · R 39.4%
- 2008→2024 swing
- +4.8pp toward D · 2008: 15.5pp · 2024: 20.3pp
- All cycles
- 2024: D+20.3 2020: D+20.4 2016: D+16.4 2012: D+14.4 2008: D+15.5
Not yet ingested
- Civics
- —
Market trends
- HPI YoY
- ▼ -209.16%
- Current HPI
- 262.7986
- Rent YoY
- —
- Metro
- Pittsburgh, PA
- State GDP YoY
- ▲ 1.68%
- F500 in state
- 34
Industry mix (Fortune 500 HQ in PA)
| Industry | F500 HQs | Revenue |
|---|---|---|
| Healthcare | 2 | $309B |
|
||
| Insurance | 2 | $27B |
|
||
| Telecommunications / Media | 1 | $124B |
|
||
| Industrial Distribution | 1 | $22B |
|
||
| Financial Services | 1 | $20B |
|
||
| Chemicals / Materials | 1 | $18B |
|
||
Price history
+110.0% since first listed6 events — show timeline
- 2026-06-12 Listed $420,000 West Penn MLS
- 2016-03-16 Price Changed $185,000 West Penn MLS
- 2016-03-15 Sold (MLS) $185,000 West Penn MLS
- 2016-02-06 Pending — West Penn MLS
- 2016-02-05 Price Changed $200,000 West Penn MLS
- 2015-12-09 Listed $200,000 West Penn MLS
Cash-flow waterfall
monthlySold comps — $/sqft
last 12 mo · ≤1 miLoading sold comps…