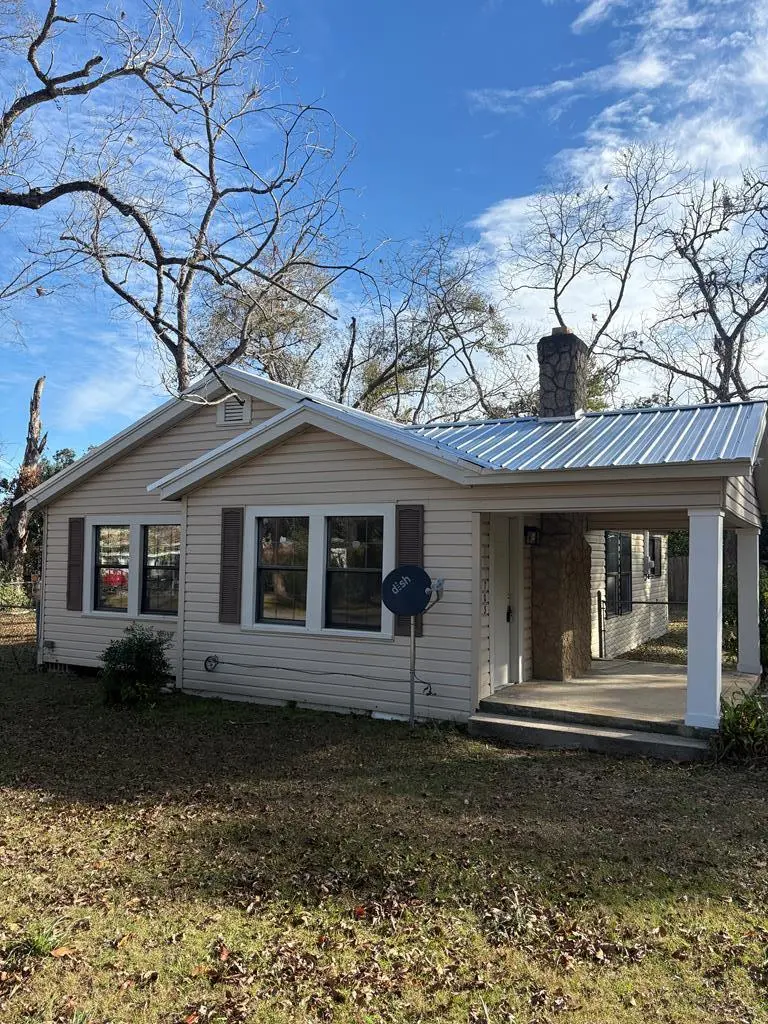
703 N Jackson St · Nashville, GA
Flood risk 1/10 · Minimal
- FEMA flood zone
- X (unshaded)
- Chance of flooding over 30 yrs
- 0.0%
- Est. flood insurance / yr
- $507 – $1,088
Fire risk 5/10 · Moderate
- Est. fire insurance / yr
- $963 – $1,789
Heat risk 7/10 · Major
- Hot days now (above 107°F)
- 7 days/yr
- Hot days in 30 yrs
- 20 days/yr
Wind risk 8/10 · Major
- Chance of severe wind over 30 yrs
- 99.0%
Air-quality risk 6/10 · Moderate
- Unhealthy air days now
- 12 days/yr
- Unhealthy air days in 30 yrs
- 14 days/yr
Risk factors via First Street. Map © Google.
Why this score? — see what drove the D+ grade
The composite is a weighted blend of 9 inputs, each scored 0–100. Each bar is that input's sub-score; the figure is the points it added to the 100-point composite (weight × sub-score).
- Cash flow +13.0/30.0
- ARV discount +11.1/15.0
- DSCR +3.9/10.0
- Schools +3.8/10.0
- Condition / age +3.8/5.0
- 1% rule +3.7/10.0
- Livability +3.5/5.0
- Rent growth +2.5/5.0
- Appreciation +0.0/10.0
$129,900
🖨 Deal sheet (PDF) 📄 Offer letter ✓ Due diligence
Listing remarks MLS
A great cottage style home just went through a major renovation including, a new kitchen, new bathroom new paint, new floors, new walk-in closet and much more.
Key facts
- New floors
- New walk-in closet
- New kitchen
Tags
Neighborhood map
What this means for you Summary
Snapshot
- This is a 2-bed/1.0-bath single-family listed at $130k. Condition is rated good.
Deal economics
- At list price, monthly cash flow is $-8 ($-97/yr) — negative.
- To cash-flow at today's rent, offer at most $129k (0.9% below list).
- To meet the 1% rule (rent ≥ 1% of price), the offer needs to be $113k (13.3% below list).
- Recommended offer: $113k (13.3% below list) — sets the bar for 1% rule.
- Cap rate 6.2% vs local median 3.6% in Nashville — top-decile yield for the area; either an underpriced asset or a hidden risk that comps aren't pricing in. Stress-test before assuming the spread holds.
Location & tenants
- Location reads 70/100 on livability (#90 in GA) — a middle-class / working-renter tenant base. Strengths: cost of living A+, health & safety A+, housing A-; Watch: crime D-, amenities F, commute F.
- Berrien County (rural): math 48% / reading 44% proficiency, ranked #24 of 174 in GA (top 14%) — families likely to look elsewhere, expect single-tenant / working-renter base with shorter leases.
- Zoned schools: Berrien Primary School (813 students, 83% FRL); Berrien Middle School (math 49% / reading 46%, grade C-, #84 of 470 statewide, top 19%, 684 students, 54% FRL); Berrien High School (math 32% / reading 42%, grade F, #68 of 424 statewide, top 17%, 851 students, 43% FRL) — zoned schools at 60% FRL track the district average.
- Market conditions: 78 active listings in the ZIP; 96 units permitted in Berrien County in 2024 (0 in 5+ unit buildings).
Forward outlook
- Local home prices are declining (-3.0%/yr); year-one equity from $898 of loan paydown is wiped out by about $4k of value loss. Plan a longer hold.
- Berrien County population projected at -23% by 2050 — secular population decline; favor cash flow + early exit over multi-decade hold.
Negotiation context
- It's been on market 67 days — a 6% lower offer ($122k) is reasonable based on typical stale-listing flexibility.
- 4 sale attempts with the ask held roughly flat each time — persistent listings suggest the price (not the market) is what's stuck; bring a comps-based counter.
Risks & watch-outs
- Watch-outs: built in 1950 — expect roof / HVAC / electrical / plumbing capex.
- Climate carrying-cost: severe wind risk, 99% chance of damaging wind over 30y; moderate wildfire risk; extreme-heat days projected 7→20/yr by 2055 (HVAC capex compounding) — expect insurance premiums to compound above CPI over the hold.
Questions for the listing agent
- What do current leases actually rent for vs. the listed asking? Can we see a recent rent roll and the last 12 months of T-12 income?
- It's been on market 67 days. Have you received any prior offers? Is the seller open to a 13% concession, seller financing, or rate buy-down credit?
- Built in 1950 — when were the roof, HVAC, electrical panel, plumbing, and water heater last replaced?
- Why hasn't it sold? Are there any deal-killer items the seller is aware of (foundation, flood, title, zoning, code violations)?
- Is there a deadline driving the sale (1031 exchange, divorce, estate, relocation)? That informs how much negotiation room exists.
- Schools are F-rated, which usually means shorter tenancies and higher turnover. Who's the typical renter profile here, and what's been the actual vacancy rate?
- Crime grade is D in this area — have there been break-ins, vandalism, or insurance claims at this property in the last 3 years? What carrier currently insures it and at what premium?
- The area grade is low — what's the realistic commute time and amenity access for the typical tenant pool here? Any planned neighborhood developments (good or bad) we should know about?
- What's the average days-on-market for RENTAL listings here right now (not sales)? A rising rental-DOM trend means longer vacancies and softer asking-rent achievability than the comps imply.
- What's the recent tenant-quality profile in this submarket — average credit score on applications, eviction rate, late-payment / NSF rate, and stable-employment percentage? A property-management company in the area should have these aggregated.
- How much new for-sale + rental construction is in the pipeline within 1–3 miles? Heavy new supply typically softens prices + rents 12–24 months out; constrained supply supports both.
Investment metrics
- 1% rule
- 0.87% ✗
- Cap rate
- 6.22%
- Cash-on-cash
- -0.27%
- DSCR
- 0.99
- GRM
- 9.6
CMA / ARV
- ARV (median comp)
- $141,238
- List price
- $129,900
- Delta
- -8.03%
- Verdict
- FAIR
- Comps
- 20 within 1.0 mi
Show comp detail 12 sales within ~0.75 mi
| Address | Dist | Beds/Ba | Sqft | Sold | Price | $/sf | Match |
|---|---|---|---|---|---|---|---|
| 501 Giddens Dr | 0.11mi | 3/1.0 (+1) | 1,148 (-1%) | 10mo | $115,000 | $100 | 80 |
| 402 Giddens Dr | 0.07mi | 2/2.5 | 1,250 (+8%) | 6mo | $110,000 | $88 | 73 |
| 508 Sharon Ave | 0.33mi | 3/1.0 (+1) | 1,200 (+4%) | 13mo | $147,500 | $123 | 63 |
| 734 N Taylor St | 0.24mi | 3/1.0 (+1) | 1,050 (-9%) | 8mo | $149,900 | $143 | 62 |
| 500 Perkins Dr | 0.11mi | 3/1.0 (+1) | 1,040 (-10%) | 14mo | $145,900 | $140 | 61 |
| 502 Perkins Dr | 0.13mi | 3/1.0 (+1) | 1,242 (+7%) | 19mo | $138,000 | $111 | 61 |
| 301 Kirby Cir | 0.52mi | 3/2.0 (+1) | 1,092 (-6%) | 3mo | $139,900 | $128 | 55 |
| 705 Beetree Ave | 0.25mi | 3/2.0 (+1) | 1,286 (+11%) | 8mo | $83,950 | $65 | 54 |
| 203 Guest Cir | 0.50mi | 3/1.5 (+1) | 1,050 (-9%) | 6mo | $153,700 | $146 | 50 |
| 505 S Bartow St | 0.73mi | 3/2.0 (+1) | 1,174 (+2%) | 18mo | $137,000 | $117 | 39 |
| 807 Zimmerman St | 0.61mi | 3/2.0 (+1) | 1,075 (-7%) | 15mo | $149,900 | $139 | 38 |
| 613 Middle School Cir | 0.73mi | 3/2.0 (+1) | 1,008 (-13%) | 10mo | $130,000 | $129 | 27 |
Match score weights: distance 35% · size 25% · config 20% · recency 20%. Top-matched comps best support the ARV.
Projected returns pro-forma
-3.0% appreciation · 3.0% rent growth · sell at horizon
- IRR
- -16.7%
- Equity multiple
- 0.41×
- Total profit
- $-21,549
- Equity at exit
- $19,369
- IRR
- -8.5%
- Equity multiple
- 0.47×
- Total profit
- $-19,361
- Equity at exit
- $11,231
Cash invested: $36,372 (down + closing). Projections, not guarantees.
Landlord ↔ Tenant lean methodology
- Overall (STATE)
- 90 Strongly Landlord-Friendly
- State Georgia
- 90 Strongly Landlord-Friendly · R+3
- County
- — inherits STATE
- City
- — inherits STATE
ZIP-level market 31639
- Home prices YoY
- -8.3%
- Active inventory
- 78
- Price-to-rent
- 9.6×
Monthly cashflow live
- Estimated rent
- $1,126 medium interval (Pro) →
- Mortgage (P&I)
- −$681
- Tax est. 1.5%
- −$162 /mo · $1,948/yr
- Insurance
- −$54
- HOA
- −$0
- Vacancy / Maint / Mgmt
- −$236
- Net cashflow
- $-8
Break-even live
Sensitivity live
| Price | -10% $82 | -5% $37 | +0% $-8 | +5% $-53 | +10% $-98 |
|---|---|---|---|---|---|
| Rent | -10% $-97 | -5% $-53 | +0% $-8 | +5% $36 | +10% $81 |
| Rate | -1.0pp $57 | -0.5pp $25 | base $-8 | +0.5pp $-42 | +1.0pp $-76 |
UW: 25.0% down · 7.5% · 30yr · 1.5% tax · 5.0% vac · 8.0% maint · 8.0% mgmt
Financing live
Cash to close
- Down payment
- $32,475
- Closing costs
- $3,897
- Reserves months
- —
- Total cash needed
- —
Loan-product check · same deal, 3 products live
Conventional
25% down · 7.5% · 30yr
- Down + closing
- —
- Monthly P&I
- —
- Monthly cashflow
- —
- DSCR
- —
- Eligible?
- —
Personal DTI + credit; lowest rate.
DSCR
20% down · 8.5% · 30yr
- Down + closing
- —
- Monthly P&I
- —
- Monthly cashflow
- —
- DSCR
- —
- Eligible?
- —
No personal income docs; deal must DSCR.
Hard money
10% down · 12.0% · 12mo
- Down + closing
- —
- Monthly P&I
- —
- Monthly cashflow
- —
- DSCR
- —
- Eligible?
- —
Short-term bridge; refi at stabilization.
Listing history 22 events
-
2026-06-21days on market $129,900 Active 67 DOM
-
2026-06-19days on market $129,900 Active 65 DOM
-
2026-06-18days on market $129,900 Active 64 DOM
-
2026-06-17days on market $129,900 Active 63 DOM
-
2026-06-16days on market $129,900 Active 62 DOM
-
2026-06-15days on market $129,900 Active 61 DOM
-
2026-06-14days on market $129,900 Active 59 DOM
-
2026-06-12days on market $129,900 Active 58 DOM
-
2026-06-09days on market $129,900 Active 55 DOM
-
2026-06-08days on market $129,900 Active 54 DOM
-
2026-06-07days on market $129,900 Active 53 DOM
-
2026-06-07days on market $129,900 Active 52 DOM
-
2026-06-03days on market $129,900 Active 49 DOM
-
2026-06-02days on market $129,900 Active 48 DOM
-
2026-06-01days on market $129,900 Active 47 DOM
-
2026-05-31days on market $129,900 Active 46 DOM
-
2026-05-30days on market $129,900 Active 45 DOM
-
2026-04-15$129,900 Active 159-char remark
Show marketing remark (159 chars)
A great cottage style home just went through a major renovation including, a new kitchen, new bathroom new paint, new floors, new walk-in closet and much more.
-
2026-03-27price $129,900
-
2026-01-12$139,900 Active
-
2026-01-02status Active
-
2025-08-26$149,900 Active
ⓘ Source: listings_history table (triggers on properties + properties_extension) + one-shot
backfill from property_details.listing_events for pre-trigger history.
Climate risk First Street
- Flood 1/10 Low FEMA zone X (unshaded) · 0% chance over 30 yrs
- Wildfire 5/10 Major
- Heat 7/10 Severe 7 d/yr ≥107°F today · 20 d/yr by 30 yrs out
- Wind 8/10 Severe 99% chance of damaging wind over 30 yrs
- Air quality 6/10 Major 12 unhealthy d/yr today · 14 by 30 yrs out
Nearby sold comps map
Loading sold comps map…
Walkable amenities ~0.75 mi
Loading nearby amenities…
Taxation est. · year 1
- Rental income
- $13,513
- − Mortgage interest
- −$7,276
- − Property taxes
- −$1,948
- − Insurance
- −$650
- − Repairs & maintenance
- −$1,081
- − Management
- −$1,081
- − Depreciation
- −$3,779
- Taxable loss
- −$2,303
- Est. tax savings @ 24.0%
- +$553
- After-tax cash flow
- $455/yr
For passive investors: Depreciation is non-cash, so a rental often shows a tax loss while cash-flowing — sheltering income. Rental losses are passive: they offset passive income freely, and up to $25,000/yr can offset ordinary (W-2) income if you actively participate and your MAGI is under $100k (phasing out to $0 by $150k); unused losses carry forward. On sale, claimed depreciation is recaptured at up to 25%, and gains may owe capital-gains tax (a 1031 exchange can defer both). Figures are a year-1 estimate at your 24.0% rate — not tax advice; consult a CPA.
Condition & rehab AI · 12 photos
This home has undergone a cosmetic renovation, featuring new kitchen and bathroom fixtures, flooring, and paint. It is move-in ready with good condition and potential for further value enhancement through exterior painting and landscaping.
Value-add opportunities
- Both Painting exterior and interior — Enhances curb appeal and interior aesthetics
- Both Landscaping — Improves curb appeal and enhances property value
- Both Upgrading appliances — Modernizes kitchen and increases appeal
Renovation cost estimate screening
Value-add ROI direction
- Both Painting exterior and interior — Enhances curb appeal and interior aesthetics ↑
- Both Landscaping — Improves curb appeal and enhances property value ↑
- Both Upgrading appliances — Modernizes kitchen and increases appeal ↑
ⓘ Cost ranges are severity-bucket heuristics (US national rule-of-thumb). Get contractor quotes + a written scope before underwriting a rehab budget.
Schools (NCES district)
- District
- Berrien County
- NCES district ID
- 1300390
- Math proficiency
- 48% ▲ 1.00%
- Reading proficiency
- 44% ▼ -3.00%
- Median HH income
- $33,858
- Composite
- 37.95/100
- National rank
- #4302
- State rank
- #24 of 174 in GA
Livability — Nashville
- Score
- 70/100
- State rank
- #90
- US rank
- #7347
Category grades
Schools grade is shown separately in the Schools card above.
Census & demographics
- Census place
- Nashville, GA
- Population (ZIP)
- 10,635
Population outlook (Berrien County) Hauer SSP2
- Today (2025)
- 17,982 people
- By 2030
- 17,282 · -3.9%
- By 2040
- 15,676 · -12.8%
- By 2050
- 13,876 · -22.8%
- By 2075
- 9,689 · -46.1%
- By 2100
- 6,430 · -64.2%
Race, ethnicity, and origin ACS 2023
- Neighborhood character
- Predominantly White (77%)
- Race & ethnicity
- White 77% Black 12% Two or more races 7% Hispanic / Latino 5% Asian 2%
- Common ancestry
- Italian 3% Slovak 1% Serbian 1%
- Foreign-born
- 1% · Philippines, Canada
- Languages at home
- 97% English-only · Spanish 2% Other Asian/Pacific 1%
Political lean MEDSL · Berrien
- 2024 margin
- Solid R (+69.8) · D 15.0% · R 84.8%
- 2008→2024 swing
- -16.6pp toward R · 2008: -53.2pp · 2024: -69.8pp
- All cycles
- 2024: R+69.8 2020: R+66.5 2016: R+66.5 2012: R+57.7 2008: R+53.2
Not yet ingested
- Civics
- —
Market trends
- HPI YoY
- ▼ -19.01%
- Current HPI
- 210.1024
- Rent YoY
- —
- Metro
- —
- State GDP YoY
- ▲ 2.66%
- F500 in state
- 28
Industry mix (Fortune 500 HQ in GA)
| Industry | F500 HQs | Revenue |
|---|---|---|
| Paper / Packaging | 2 | $29B |
|
||
| Retail | 1 | $160B |
|
||
| Transportation / Logistics | 1 | $91B |
|
||
| Airlines | 1 | $62B |
|
||
| Consumer Goods | 1 | $47B |
|
||
| Utilities | 1 | $25B |
|
||
Price history
-13.3% since first listed5 events — show timeline
- 2026-04-15 Listed $129,900 TBOR
- 2026-03-27 Price Changed $129,900 TBOR
- 2026-01-12 Listed $139,900 TBOR
- 2026-01-02 Relisted — TBOR
- 2025-08-26 Listed $149,900 TBOR
Cash-flow waterfall
monthlySold comps — $/sqft
last 12 mo · ≤1 miLoading sold comps…