 Duplex
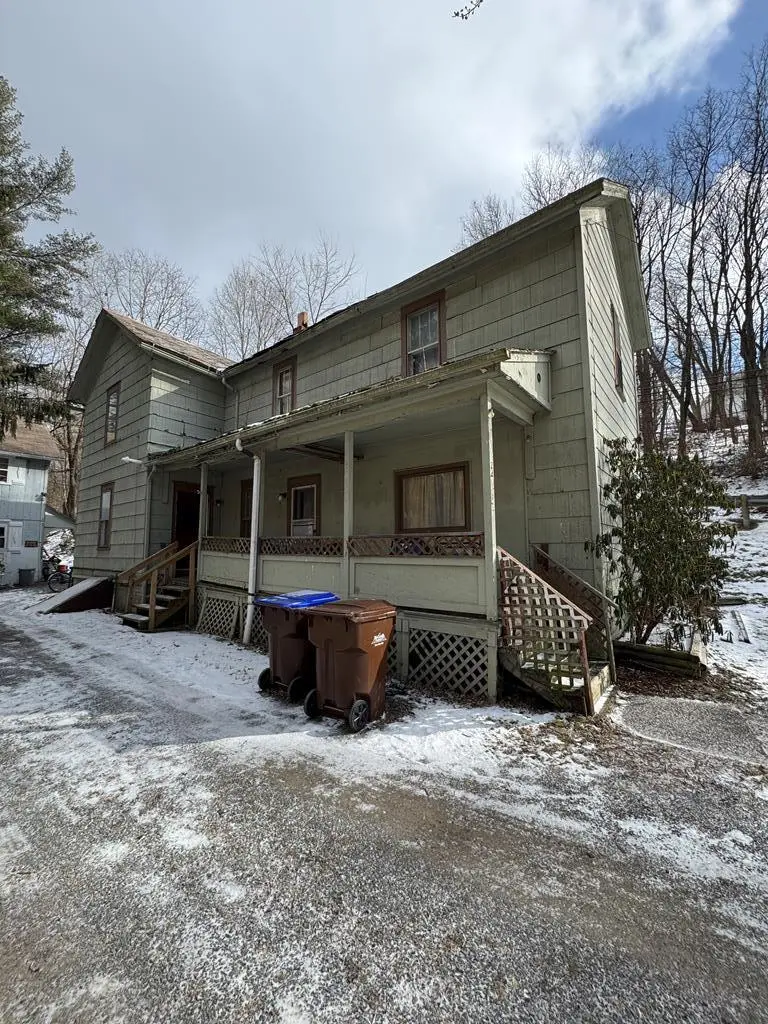
24 2nd Ave · Sugarcreek, PA
Flood risk 9/10 · Severe
- FEMA flood zone
- X (unshaded)
- Chance of flooding over 30 yrs
- 0.99%
- Est. flood insurance / yr
- $473 – $860
Fire risk 1/10 · Minimal
- Est. fire insurance / yr
- $511 – $949
Heat risk 3/10 · Minor
- Hot days now (above 95°F)
- 7 days/yr
- Hot days in 30 yrs
- 18 days/yr
Wind risk 1/10 · Minimal
- Chance of severe wind over 30 yrs
- —
Air-quality risk 2/10 · Minimal
- Unhealthy air days now
- 1 days/yr
- Unhealthy air days in 30 yrs
- 2 days/yr
Risk factors via First Street. Map © Google.
Why this score? — see what drove the B+ grade
The composite is a weighted blend of 9 inputs, each scored 0–100. Each bar is that input's sub-score; the figure is the points it added to the 100-point composite (weight × sub-score).
- Cash flow +30.0/30.0
- 1% rule +10.0/10.0
- DSCR +10.0/10.0
- Appreciation +10.0/10.0
- Schools +3.9/10.0
- Livability +3.3/5.0
- ARV discount +3.1/15.0
- Rent growth +2.5/5.0
- Condition / age +2.5/5.0
$59,999
🖨 Deal sheet (PDF) 📄 Offer letter ✓ Due diligence
Multi-family units
County records classify this as Multi-Family (2-4 Unit). Listing-text estimate: 2 units. confirmed
Listing remarks MLS
Calling all investors! This duplex has no vacancy and long term tenants. The units are side by side with the bedrooms on the second level, with off street parking. The unit next door (26 2nd Ave MLS# 162513) is for sale too! Same owner, let's make a deal! There are no interior images in order to protect the tenants privacy.
Key facts
- Off street parking
- 0.67 acre lot
- 2 parking spots
Tags
Neighborhood map
What this means for you Summary
Snapshot
- This is a 2 × 2-bed/1.0-bath units multifamily listed at $60k.
Deal economics
- At list price, monthly cash flow is $1k ($13k/yr) — positive. Per door: $550/mo.
- The deal already cash-flows at list — no discount required.
- Meets the 1% rule at list price ($2k rent vs $60k).
- Recommended offer: $53k (12.0% below list) — sets the bar for market timing.
Location & tenants
- Location reads 66/100 on livability (#1,056 in PA) — a middle-class / working-renter tenant base. Strengths: crime A+, cost of living A+, housing A+; Watch: health & safety C-, amenities F, commute F.
- Valley Grove SD (rural): math 36% / reading 58% proficiency, ranked #256 of 539 in PA (top 48%) — families likely to look elsewhere, expect single-tenant / working-renter base with shorter leases.
- Zoned schools: Valley Grove El Sch (math 38% / reading 59%, grade D, #718 of 1,518 statewide, top 48%, 442 students, 63% FRL); Rocky Grove Jshs (math 37% / reading 57%, grade D-, #167 of 437 statewide, top 39%, 369 students, 47% FRL).
- Market conditions: 51 active listings in the ZIP; 42 units permitted in Venango County in 2024 (0 in 5+ unit buildings).
Forward outlook
- In year one you build about $6k of equity ($415 loan paydown + $6k appreciation (10.0% local appreciation)).
- Venango County population projected at -30% by 2050 — secular population decline; favor cash flow + early exit over multi-decade hold.
- At projected returns (10.0% appreciation + 3.0% rent growth), your $17k cash investment doubles in ~1 year — after that, you're playing with house money.
- By year 6, paydown + projected appreciation supports a ~$38k cash-out refi (75% LTV) — recoverable capital for the next deal without selling this one.
Negotiation context
- It's been on market 145 days — a 12% lower offer ($53k) is reasonable based on typical stale-listing flexibility.
- Current owner paid $20k; list at $60k implies a 200% gain — meaningful room to come down on a strong offer.
Risks & watch-outs
- Watch-outs: flood insurance adds $56/mo; built in 1900 — expect roof / HVAC / electrical / plumbing capex.
- Climate carrying-cost: severe flood risk — expect insurance premiums to compound above CPI over the hold.
Questions for the listing agent
- It's been on market 145 days. Have you received any prior offers? Is the seller open to a 12% concession, seller financing, or rate buy-down credit?
- Can we see the unit-by-unit rent roll, current vacancy, and any below-market leases? What's the average tenancy length?
- What capital expenditures (roof, boiler, parking lot, exteriors) have been made in the last 5 years, and what's planned in the next 2?
- Built in 1900 — when were the roof, HVAC, electrical panel, plumbing, and water heater last replaced?
- What's the actual annual flood-insurance premium (NFIP or private), and is the property in a SFHA with mandatory coverage?
- Why hasn't it sold? Are there any deal-killer items the seller is aware of (foundation, flood, title, zoning, code violations)?
- Is there a deadline driving the sale (1031 exchange, divorce, estate, relocation)? That informs how much negotiation room exists.
- Schools are D-rated, which usually means shorter tenancies and higher turnover. Who's the typical renter profile here, and what's been the actual vacancy rate?
- What's the average days-on-market for RENTAL listings here right now (not sales)? A rising rental-DOM trend means longer vacancies and softer asking-rent achievability than the comps imply.
- What's the recent tenant-quality profile in this submarket — average credit score on applications, eviction rate, late-payment / NSF rate, and stable-employment percentage? A property-management company in the area should have these aggregated.
- How much new apartment / multifamily construction is in the pipeline within 1–3 miles? Heavy new supply (>2% of stock underway) typically softens rents 12–24 months out; light construction supports rent growth.
Investment metrics
- 1% rule
- 3.37% ✓
- Cap rate
- 29.40%
- Cash-on-cash
- 82.52%
- DSCR
- 4.67
- GRM
- 2.5
CMA / ARV
- ARV (median comp)
- $54,616
- List price
- $59,999
- Delta
- 9.86%
- Verdict
- FAIR
- Comps
- 9 within 1.0 mi
Show comp detail 1 sale within ~0.75 mi
| Address | Dist | Beds/Ba | Sqft | Sold | Price | $/sf | Match |
|---|---|---|---|---|---|---|---|
| 210 Gilfillan St | 0.55mi | 4/2.0 (-1) | 1,750 (-1%) | 20mo | $49,900 | $29 | 52 |
Match score weights: distance 35% · size 25% · config 20% · recency 20%. Top-matched comps best support the ARV.
Projected returns pro-forma
10.0% appreciation · 3.0% rent growth · sell at horizon
- IRR
- 88.7%
- Equity multiple
- 7.12×
- Total profit
- $102,802
- Equity at exit
- $54,052
- IRR
- 83.4%
- Equity multiple
- 15.75×
- Total profit
- $247,812
- Equity at exit
- $116,565
Cash invested: $16,800 (down + closing). Projections, not guarantees.
Landlord ↔ Tenant lean methodology
- Overall (STATE)
- 62 Landlord-Friendly
- State Pennsylvania
- 62 Landlord-Friendly · EVEN
- County
- — inherits STATE
- City
- — inherits STATE
ZIP-level market 16323
- Home prices YoY
- 12.2%
- Active inventory
- 51
- Price-to-rent
- 4.9×
Monthly cashflow live
- Estimated rent
- $2,020 medium interval (Pro) →
- Mortgage (P&I)
- −$315
- Tax from tax record
- −$101 /mo · $1,210/yr
- Insurance
- −$25
- Flood insurance flood zone
- −$56 /mo · $666/yr
- HOA
- −$0
- Vacancy / Maint / Mgmt
- −$424
- Net cashflow
- $1,100
Break-even live
Sensitivity live
| Price | -10% $1,134 | -5% $1,117 | +0% $1,100 | +5% $1,083 | +10% $1,066 |
|---|---|---|---|---|---|
| Rent | -10% $940 | -5% $1,020 | +0% $1,100 | +5% $1,180 | +10% $1,259 |
| Rate | -1.0pp $1,130 | -0.5pp $1,115 | base $1,100 | +0.5pp $1,084 | +1.0pp $1,068 |
2-unit breakdown (identical units grouped — click to expand)
| Units | Beds | Baths | Est. rent |
|---|---|---|---|
| 2× units | 2 | 1 | $2,020 |
| #1 | 2 | 1 | $1,010 |
| #2 | 2 | 1 | $1,010 |
| Total (2 units) | $2,020 | ||
UW: 25.0% down · 7.5% · 30yr · 1.5% tax · 5.0% vac · 8.0% maint · 8.0% mgmt
Financing live
Cash to close
- Down payment
- $15,000
- Closing costs
- $1,800
- Reserves months
- —
- Total cash needed
- —
Loan-product check · same deal, 3 products live
Conventional
25% down · 7.5% · 30yr
- Down + closing
- —
- Monthly P&I
- —
- Monthly cashflow
- —
- DSCR
- —
- Eligible?
- —
Personal DTI + credit; lowest rate.
DSCR
20% down · 8.5% · 30yr
- Down + closing
- —
- Monthly P&I
- —
- Monthly cashflow
- —
- DSCR
- —
- Eligible?
- —
No personal income docs; deal must DSCR.
Hard money
10% down · 12.0% · 12mo
- Down + closing
- —
- Monthly P&I
- —
- Monthly cashflow
- —
- DSCR
- —
- Eligible?
- —
Short-term bridge; refi at stabilization.
Listing history 19 events
-
2026-06-22days on market $59,999 Active 145 DOM
-
2026-06-21days on market $59,999 Active 144 DOM
-
2026-06-21days on market $59,999 Active 143 DOM
-
2026-06-18days on market $59,999 Active 141 DOM
-
2026-06-17days on market $59,999 Active 140 DOM
-
2026-06-16days on market $59,999 Active 139 DOM
-
2026-06-15days on market $59,999 Active 138 DOM
-
2026-06-13days on market $59,999 Active 136 DOM
-
2026-06-12days on market $59,999 Active 135 DOM
-
2026-06-09days on market $59,999 Active 132 DOM
-
2026-06-08days on market $59,999 Active 131 DOM
-
2026-06-08days on market $59,999 Active 130 DOM
-
2026-06-07days on market $59,999 Active 129 DOM
-
2026-06-04days on market $59,999 Active 126 DOM
-
2026-06-02days on market $59,999 Active 125 DOM
-
2026-06-01days on market $59,999 Active 124 DOM
-
2026-05-31days on market $59,999 Active 123 DOM
-
2026-01-28$59,999 Active 328-char remark
Show marketing remark (328 chars)
Calling all investors! This duplex has no vacancy and long term tenants. The units are side by side with the bedrooms on the second level, with off street parking. The unit next door (26 2nd Ave MLS# 162513) is for sale too! Same owner, let's make a deal! There are no interior images in order to protect the tenants privacy.
-
2013-08-30soldstatus $20,000
ⓘ Source: listings_history table (triggers on properties + properties_extension) + one-shot
backfill from property_details.listing_events for pre-trigger history.
Tax reassessment forecast PA · Partial reset (capped growth)
- Current annual tax
- $1,210 · $101/mo
- Projected year-2 tax
- $1,210 · $101/mo
- Expected delta
- $0/yr ($0/mo · 0.0%)
ⓘ Screening estimate from a state-policy table — verify with the county assessor before closing.
Climate risk First Street
- Flood 9/10 Extreme FEMA zone X (unshaded) · 99% chance over 30 yrs
- Wildfire 1/10 Low
- Heat 3/10 Moderate 7 d/yr ≥95°F today · 18 d/yr by 30 yrs out
- Wind 1/10 Low
- Air quality 2/10 Low 1 unhealthy d/yr today · 2 by 30 yrs out
Nearby sold comps map
Loading sold comps map…
Walkable amenities ~0.75 mi
Loading nearby amenities…
Taxation est. · year 1
- Rental income
- $24,240
- − Mortgage interest
- −$3,361
- − Property taxes
- −$1,210
- − Insurance
- −$966
- − Repairs & maintenance
- −$1,939
- − Management
- −$1,939
- − Depreciation
- −$1,745
- Taxable income
- $13,079
- Est. tax owed @ 24.0%
- −$3,139
- After-tax cash flow
- $10,058/yr
For passive investors: Depreciation is non-cash, so a rental often shows a tax loss while cash-flowing — sheltering income. Rental losses are passive: they offset passive income freely, and up to $25,000/yr can offset ordinary (W-2) income if you actively participate and your MAGI is under $100k (phasing out to $0 by $150k); unused losses carry forward. On sale, claimed depreciation is recaptured at up to 25%, and gains may owe capital-gains tax (a 1031 exchange can defer both). Figures are a year-1 estimate at your 24.0% rate — not tax advice; consult a CPA.
Schools (NCES district)
- District
- Valley Grove SD
- NCES district ID
- 4224630
- Math proficiency
- 36% ▼ -15.00%
- Reading proficiency
- 58% ▼ -7.00%
- Median HH income
- $42,090
- Composite
- 39.46/100
- National rank
- #3957
- State rank
- #256 of 539 in PA
Livability — Sugarcreek
- Score
- 66/100
- State rank
- #1056
- US rank
- #11914
Category grades
Schools grade is shown separately in the Schools card above.
Census & demographics
- Census place
- Sugarcreek, PA
- City population
- 15,310
- Population (ZIP)
- 14,694
Population outlook (Venango County) Hauer SSP2
- Today (2025)
- 48,827 people
- By 2030
- 46,061 · -5.7%
- By 2040
- 39,989 · -18.1%
- By 2050
- 34,094 · -30.2%
- By 2075
- 22,500 · -53.9%
- By 2100
- 13,659 · -72.0%
Race, ethnicity, and origin ACS 2023
- Neighborhood character
- Predominantly White (92%)
- Race & ethnicity
- White 92% Two or more races 3% Black 2%
- Common ancestry
- Romanian 4% Iranian 3% Serbian 2%
- Foreign-born
- 1% · Canada
Political lean MEDSL · Venango
- 2024 margin
- Solid R (+42.1) · D 28.5% · R 70.6%
- 2008→2024 swing
- -22.9pp toward R · 2008: -19.2pp · 2024: -42.1pp
- All cycles
- 2024: R+42.1 2020: R+41.4 2016: R+42.4 2012: R+26.3 2008: R+19.2
Not yet ingested
- Civics
- —
Market trends
- HPI YoY
- ▲ 26.68%
- Current HPI
- 245.9766
- Rent YoY
- —
- Metro
- —
- State GDP YoY
- ▲ 1.68%
- F500 in state
- 34
Industry mix (Fortune 500 HQ in PA)
| Industry | F500 HQs | Revenue |
|---|---|---|
| Healthcare | 2 | $309B |
|
||
| Insurance | 2 | $27B |
|
||
| Telecommunications / Media | 1 | $124B |
|
||
| Industrial Distribution | 1 | $22B |
|
||
| Financial Services | 1 | $20B |
|
||
| Chemicals / Materials | 1 | $18B |
|
||
Price history
+200.0% since first listed2 events — show timeline
- 2026-01-28 Listed $59,999 AVBREALTORS
- 2013-08-30 Sold (Public Records) $20,000 Public Records
Property tax history
+1.5%/yrLatest (2026): $1,210 · +3.0% YoY. Source: county tax records.
Cash-flow waterfall
monthlySold comps — $/sqft
last 12 mo · ≤1 miLoading sold comps…