184 Hill Top Dr · Grand Rivers, KY
Flood risk 1/10 · Minimal
- FEMA flood zone
- X (unshaded)
- Chance of flooding over 30 yrs
- 0.0%
- Est. flood insurance / yr
- $507 – $1,088
Fire risk 3/10 · Minor
- Est. fire insurance / yr
- $839 – $1,559
Heat risk 5/10 · Moderate
- Hot days now (above 111°F)
- 7 days/yr
- Hot days in 30 yrs
- 18 days/yr
Wind risk 3/10 · Minor
- Chance of severe wind over 30 yrs
- 7.0%
Air-quality risk 2/10 · Minimal
- Unhealthy air days now
- 0 days/yr
- Unhealthy air days in 30 yrs
- 1 days/yr
Risk factors via First Street. Map © Google.
Why this score? — see what drove the B grade
The composite is a weighted blend of 9 inputs, each scored 0–100. Each bar is that input's sub-score; the figure is the points it added to the 100-point composite (weight × sub-score).
- Cash flow +30.0/30.0
- DSCR +10.0/10.0
- 1% rule +9.8/10.0
- ARV discount +7.5/15.0
- Appreciation +4.5/10.0
- Livability +3.5/5.0
- Schools +2.8/10.0
- Rent growth +2.5/5.0
- Condition / age +2.5/5.0
$54,900
🖨 Deal sheet 📄 Offer letter ✓ Due diligence
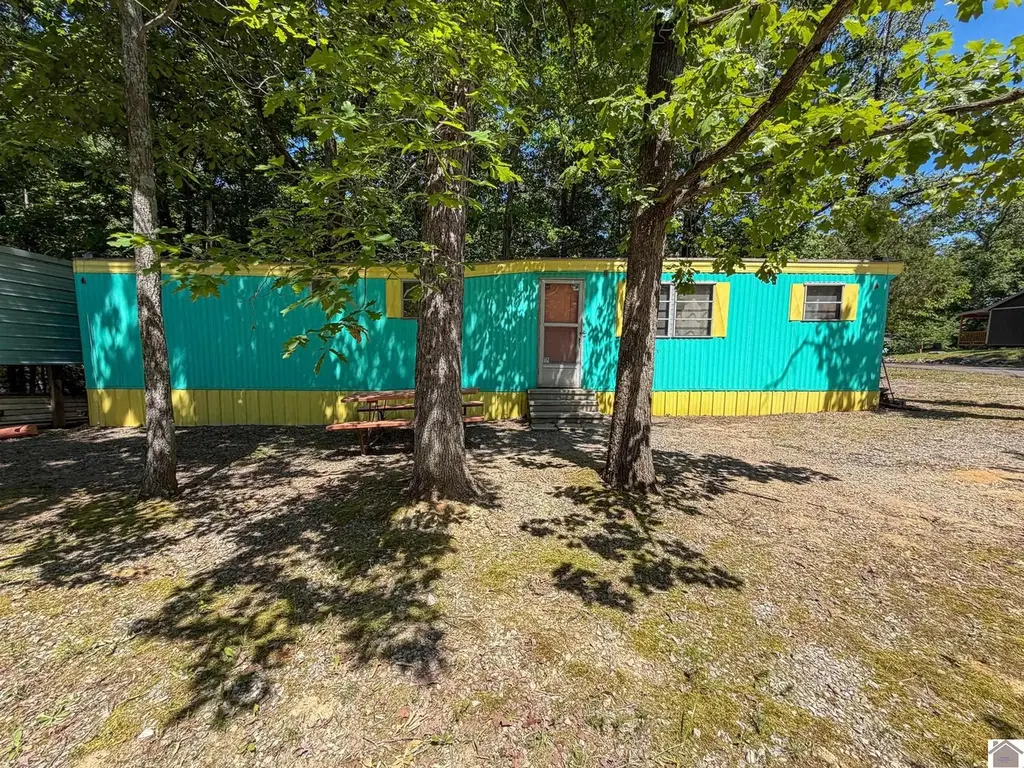
Listing remarks
Tucked into a prime lake-area location, this property offers a great opportunity for weekend getaways, rental potential, or a simple retreat near the water. The mobile home sits on the lot with a convenient carport for boat or camper providing covered parking or storage for your lake toys or vehicles. Location is the real highlight here—just 3 miles from Barkley Dam Boat Ramp and only 2.2 miles from Lighthouse Landing Resort and Marina, giving you quick and easy access to boating, fishing, and everything lake life has to offer. Whether you’re looking for an affordable basecamp for your weekends on the water, a property with potential to update & make your own or perhaps a
Key facts
- Covered parking
- Lake-area location
- Convenient carport
Tags
Property features AI
Exterior
- Parking: Carport (2 spaces); Circular gravel driveway
- Utilities: Public water; Public sewer
- Home design: Manufactured home; Single-story
- Construction: Aluminum siding; Metal roof
- Exterior features: Level to rolling slope corner lot; Gravel road access
Interior
- Kitchen: Refrigerator; Cooktop; Electric water heater
- Flooring: Carpet; Vinyl
- Bathrooms: 1 full bathroom
- Heating & cooling: Electric heating; Window unit cooling
- Interior features: Walk-in closet(s)
Neighborhood map
What this means for you Summary
Snapshot
- This is a 2-bed/1.0-bath other listed at $55k.
Deal economics
- At list price, monthly cash flow is $264 ($3k/yr) — positive.
- The deal already cash-flows at list — no discount required.
- Meets the 1% rule at list price ($815 rent vs $55k).
- Recommended offer: $53k (3.0% below list) — sets the bar for market timing.
- Cap rate 12.1% vs local median 1.2% in Grand Rivers — top-decile yield for the area; either an underpriced asset or a hidden risk that comps aren't pricing in. Stress-test before assuming the spread holds.
Location & tenants
- Location reads 69/100 on livability (#165 in KY) — a middle-class / working-renter tenant base. Strengths: cost of living A+, housing A+, crime A; Watch: amenities F, commute F, health & safety F.
- Livingston County (rural): math 27% / reading 39% proficiency, ranked #80 of 165 in KY (top 48%) — families likely to look elsewhere, expect single-tenant / working-renter base with shorter leases.
- Zoned schools: South Livingston Elementary School (math 27% / reading 37%, grade F, #348 of 676 statewide, top 55%, 362 students, 62% FRL); Livingston County Middle School (math 32% / reading 43%, grade F, #73 of 217 statewide, top 36%, 252 students, 60% FRL); Livingston Central High School (math 22% / reading 37%, grade F, #127 of 254 statewide, top 58%, 329 students, 47% FRL) — zoned schools at 56% FRL track the district average.
- Market conditions: 51 active listings in the ZIP.
Forward outlook
- Local home prices are declining (-1.0%/yr); year-one equity from $380 of loan paydown is wiped out by about $552 of value loss. Plan a longer hold.
- Livingston County population projected at -19% by 2050 — secular population decline; favor cash flow + early exit over multi-decade hold.
- At projected returns (-1.0% appreciation + 3.0% rent growth), your $15k cash investment doubles in ~5 years — after that, you're playing with house money.
Negotiation context
- It's been on market 38 days — a 3% lower offer ($53k) is reasonable based on typical stale-listing flexibility.
Risks & watch-outs
- Climate carrying-cost: extreme-heat days projected 7→18/yr by 2055 (HVAC capex compounding) — expect insurance premiums to compound above CPI over the hold.
Questions for the listing agent
- It's been on market 38 days. Have you received any prior offers? Is the seller open to a 3% concession, seller financing, or rate buy-down credit?
- Built in 1968 — when were the roof, HVAC, electrical panel, plumbing, and water heater last replaced?
- Is there a deadline driving the sale (1031 exchange, divorce, estate, relocation)? That informs how much negotiation room exists.
- Schools are F-rated, which usually means shorter tenancies and higher turnover. Who's the typical renter profile here, and what's been the actual vacancy rate?
- What's the average days-on-market for RENTAL listings here right now (not sales)? A rising rental-DOM trend means longer vacancies and softer asking-rent achievability than the comps imply.
- What's the recent tenant-quality profile in this submarket — average credit score on applications, eviction rate, late-payment / NSF rate, and stable-employment percentage? A property-management company in the area should have these aggregated.
- How much new for-sale + rental construction is in the pipeline within 1–3 miles? Heavy new supply typically softens prices + rents 12–24 months out; constrained supply supports both.
Investment metrics
- 1% rule
- 1.48% ✓
- Cap rate
- 12.07%
- Cash-on-cash
- 20.65%
- DSCR
- 1.92
- GRM
- 5.6
CMA / ARV
No comps found within radius.
Projected returns pro-forma
-1.0% appreciation · 3.0% rent growth · sell at horizon
- IRR
- 18.2%
- Equity multiple
- 1.83×
- Total profit
- $12,710
- Equity at exit
- $13,238
- IRR
- 23.8%
- Equity multiple
- 3.42×
- Total profit
- $37,266
- Equity at exit
- $13,888
Cash invested: $15,372 (down + closing). Projections, not guarantees.
Landlord ↔ Tenant lean methodology
- Overall (STATE)
- 83 Strongly Landlord-Friendly
- State Kentucky
- 83 Strongly Landlord-Friendly · R+16
- County
- — inherits STATE
- City
- — inherits STATE
ZIP-level market 42045
- Home prices YoY
- -0.5%
- Active inventory
- 51
- Price-to-rent
- 5.6×
Monthly cashflow live
- Estimated rent
- $815 medium interval (Pro) →
- Mortgage (P&I)
- −$288
- Tax est. 1.5%
- −$69 /mo · $824/yr
- Insurance
- −$23
- HOA
- −$0
- Vacancy / Maint / Mgmt
- −$171
- Net cashflow
- $264
Break-even live
UW: 25.0% down · 7.5% · 30yr · 1.5% tax · 5.0% vac · 8.0% maint · 8.0% mgmt
Financing live
Cash to close
- Down payment
- $13,725
- Closing costs
- $1,647
- Reserves months
- —
- Total cash needed
- —
Loan-product check · same deal, 3 products live
Conventional
25% down · 7.5% · 30yr
- Down + closing
- —
- Monthly P&I
- —
- Monthly cashflow
- —
- DSCR
- —
- Eligible?
- —
Personal DTI + credit; lowest rate.
DSCR
20% down · 8.5% · 30yr
- Down + closing
- —
- Monthly P&I
- —
- Monthly cashflow
- —
- DSCR
- —
- Eligible?
- —
No personal income docs; deal must DSCR.
Hard money
10% down · 12.0% · 12mo
- Down + closing
- —
- Monthly P&I
- —
- Monthly cashflow
- —
- DSCR
- —
- Eligible?
- —
Short-term bridge; refi at stabilization.
Listing history 17 events
-
2026-06-18days on market $54,900 Active 38 DOM
-
2026-06-17days on market $54,900 Active 37 DOM
-
2026-06-16days on market $54,900 Active 36 DOM
-
2026-06-15days on market $54,900 Active 35 DOM
-
2026-06-13days on market $54,900 Active 33 DOM
-
2026-06-12days on market $54,900 Active 32 DOM
-
2026-06-09days on market $54,900 Active 29 DOM
-
2026-06-08days on market $54,900 Active 28 DOM
-
2026-06-07days on market $54,900 Active 27 DOM
-
2026-06-05days on market $54,900 Active 25 DOM
-
2026-06-04days on market $54,900 Active 23 DOM
-
2026-06-02days on market $54,900 Active 22 DOM
-
2026-06-01price $54,900 Active 21 DOM
-
2026-06-01days on market $59,900 Active 21 DOM
-
2026-05-31days on market $59,900 Active 20 DOM
-
2026-05-31days on market $59,900 Active 19 DOM
-
2026-05-11$59,900 Active 792-char remark
ⓘ Source: listings_history table (triggers on properties + properties_extension) + one-shot
backfill from property_details.listing_events for pre-trigger history.
Climate risk First Street
- Flood 1/10 Low FEMA zone X (unshaded) · 0% chance over 30 yrs
- Wildfire 3/10 Moderate
- Heat 5/10 Major 7 d/yr ≥111°F today · 18 d/yr by 30 yrs out
- Wind 3/10 Moderate 7% chance of damaging wind over 30 yrs
- Air quality 2/10 Low 0 unhealthy d/yr today · 1 by 30 yrs out
Nearby sold comps map
Loading sold comps map…
Walkable amenities ~0.75 mi
Loading nearby amenities…
Taxation est. · year 1
- Rental income
- $9,780
- − Mortgage interest
- −$3,075
- − Property taxes
- −$824
- − Insurance
- −$274
- − Repairs & maintenance
- −$782
- − Management
- −$782
- − Depreciation
- −$1,597
- Taxable income
- $2,445
- Est. tax owed @ 24.0%
- −$587
- After-tax cash flow
- $2,587/yr
For passive investors: Depreciation is non-cash, so a rental often shows a tax loss while cash-flowing — sheltering income. Rental losses are passive: they offset passive income freely, and up to $25,000/yr can offset ordinary (W-2) income if you actively participate and your MAGI is under $100k (phasing out to $0 by $150k); unused losses carry forward. On sale, claimed depreciation is recaptured at up to 25%, and gains may owe capital-gains tax (a 1031 exchange can defer both). Figures are a year-1 estimate at your 24.0% rate — not tax advice; consult a CPA.
Schools (NCES district)
- District
- Livingston County
- NCES district ID
- 2103510
- Math proficiency
- 27% ▼ -10.00%
- Reading proficiency
- 39% ▼ -17.00%
- Median HH income
- $41,875
- Composite
- 27.87/100
- National rank
- #6873
- State rank
- #80 of 165 in KY
Livability — Grand Rivers
- Score
- 69/100
- State rank
- #165
- US rank
- #8446
Category grades
Schools grade is shown separately in the Schools card above.
Census & demographics
- Population (ZIP)
- 1,923
Population outlook (Livingston County) Hauer SSP2
- Today (2025)
- 8,790 people
- By 2030
- 8,413 · -4.3%
- By 2040
- 7,709 · -12.3%
- By 2050
- 7,090 · -19.3%
- By 2075
- 6,046 · -31.2%
- By 2100
- 5,202 · -40.8%
Race, ethnicity, and origin ACS 2023
- Neighborhood character
- Predominantly White (95%)
- Race & ethnicity
- White 95% Hispanic / Latino 5%
- Common ancestry
- Italian 3% Slovak 2% Portuguese 1%
- Foreign-born
- 0%
- Languages at home
- 99% English-only · Spanish 1%
Political lean MEDSL · Livingston
- 2024 margin
- Solid R (+63.0) · D 17.8% · R 80.9% · Other 1.3%
- 2008→2024 swing
- -35.4pp toward R · 2008: -27.6pp · 2024: -63.0pp
- All cycles
- 2024: R+63.0 2020: R+61.4 2016: R+57.8 2012: R+38.6 2008: R+27.6
Not yet ingested
- Civics
- —
Market trends
- HPI YoY
- ▼ -1.00%
- Current HPI
- 189.7508
- Rent YoY
- —
- Metro
- —
- State GDP YoY
- ▲ 1.81%
- F500 in state
- 4
Industry mix (Fortune 500 HQ in KY)
| Industry | F500 HQs | Revenue |
|---|---|---|
| Healthcare | 1 | $118B |
|
||
| Food / Beverage | 1 | $7B |
|
||
Price history
-8.3% since first listed2 events — show timeline
- 2026-06-01 Price Changed $54,900 WKRMLS
- 2026-05-11 Listed $59,900 WKRMLS
Property tax history
+1.0%/yrLatest (2025): $110 · +0.7% YoY. Source: county tax records.
Cash-flow waterfall
monthlySold comps — $/sqft
last 12 mo · ≤1 miLoading sold comps…