 Duplex
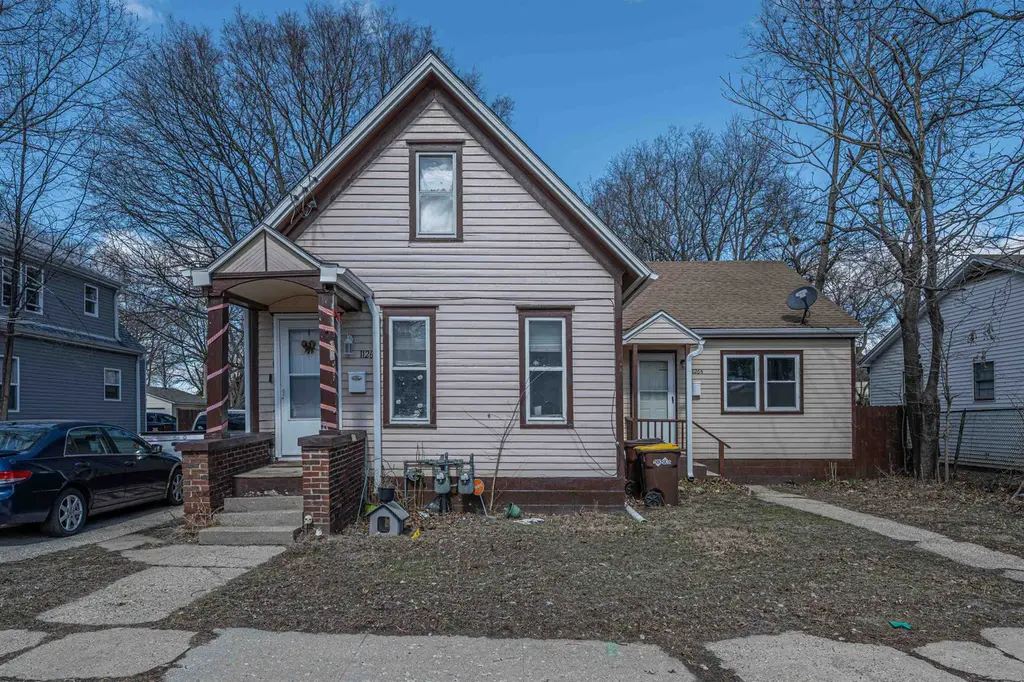
1126 16th Ave · Rockford, IL
Flood risk 1/10 · Minimal
- FEMA flood zone
- X (unshaded)
- Chance of flooding over 30 yrs
- 0.0%
- Est. flood insurance / yr
- $473 – $860
Fire risk 1/10 · Minimal
- Est. fire insurance / yr
- $804 – $1,492
Heat risk 2/10 · Minimal
- Hot days now (above 101°F)
- 7 days/yr
- Hot days in 30 yrs
- 15 days/yr
Wind risk 2/10 · Minimal
- Chance of severe wind over 30 yrs
- —
Air-quality risk 2/10 · Minimal
- Unhealthy air days now
- 1 days/yr
- Unhealthy air days in 30 yrs
- 2 days/yr
Risk factors via First Street. Map © Google.
Why this score? — see what drove the B- grade
The composite is a weighted blend of 9 inputs, each scored 0–100. Each bar is that input's sub-score; the figure is the points it added to the 100-point composite (weight × sub-score).
- Cash flow +30.0/30.0
- 1% rule +10.0/10.0
- DSCR +10.0/10.0
- Rent growth +4.9/5.0
- ARV discount +4.8/15.0
- Livability +3.1/5.0
- Condition / age +2.5/5.0
- Schools +1.2/10.0
- Appreciation +0.0/10.0
$139,900
🖨 Deal sheet (PDF) 📄 Offer letter ✓ Due diligence
Multi-family units
County records classify this as Multi-Family (2-4 Unit). Listing-text estimate: 2 units. confirmed
Listing remarks MLS
This 1,430 sq ft multi-family property features two units, each with 2 bedrooms and 1 bathroom. Both units offer comfortable living spaces, and the large yard adds extra appeal for tenants or outdoor use. Perfect for investors or owner-occupants looking to generate rental income.
Key facts
- Large yard
- Two units
- 2 parking spots
Tags
Neighborhood map
What this means for you Summary
Snapshot
- This is a 2 × 2-bed/1-bath units multifamily listed at $140k.
Deal economics
- At list price, monthly cash flow is $824 ($10k/yr) — positive. Per door: $412/mo.
- The deal already cash-flows at list — no discount required.
- Meets the 1% rule at list price ($2k rent vs $140k).
- Recommended offer: $136k (3.0% below list) — sets the bar for market timing.
- Cap rate 13.4% vs local median 6.1% in Rockford — top-decile yield for the area; either an underpriced asset or a hidden risk that comps aren't pricing in. Stress-test before assuming the spread holds.
Location & tenants
- Location reads 62/100 on livability (#876 in IL) — a middle-class / working-renter tenant base. Strengths: cost of living A+, housing A+, health & safety A+; Watch: schools F, crime F, amenities F.
- Rockford SD 205 (urban): math 12% / reading 16% proficiency, ranked #533 of 620 in IL (top 86%) — low school quality limits family demand, transient renter base, plan for 1-2y turnover; 73% free/reduced lunch — lower-income household profile, screen leases tightly.
- Market conditions: Rents rising fast (+9.7%/yr); 69 active listings in the ZIP; 16 comparable units currently listed for rent nearby; rentals lingering (median 45d on market — plan ~5-8 weeks vacancy on turnover, expect pricing pressure); 62% of comp listings sitting > 30 days — soft ceiling on asking rent; lower-income renter base — watch delinquency; 285 units permitted in Winnebago County in 2024 (0 in 5+ unit buildings).
- At $2,195/mo this rent would consume 78% of the median local household income ($34k/yr) (locally 1406% of renters already pay >50% of income on rent) — very limited rent-growth headroom before tenants either downsize or default.
Forward outlook
- Local home prices are declining (-3.0%/yr); year-one equity from $967 of loan paydown is wiped out by about $4k of value loss. Plan a longer hold.
- Winnebago County population projected at -20% by 2050 — secular population decline; favor cash flow + early exit over multi-decade hold.
- At projected returns (-3.0% appreciation + 8.0% rent growth), your $39k cash investment doubles in ~5 years — after that, you're playing with house money.
Negotiation context
- It's been on market 47 days — a 3% lower offer ($136k) is reasonable based on typical stale-listing flexibility.
- 2 sale attempts since 4y ago; this cycle's ask has dropped $9k (6%) from the opening price — seller is motivated, your offer sets the floor, not the list.
- Current owner paid $55k; list at $140k implies a 155% gain — meaningful room to come down on a strong offer.
Risks & watch-outs
- Watch-outs: built in 1915 — expect roof / HVAC / electrical / plumbing capex.
Questions for the listing agent
- It's been on market 47 days. Have you received any prior offers? Is the seller open to a 3% concession, seller financing, or rate buy-down credit?
- Can we see the unit-by-unit rent roll, current vacancy, and any below-market leases? What's the average tenancy length?
- What capital expenditures (roof, boiler, parking lot, exteriors) have been made in the last 5 years, and what's planned in the next 2?
- Built in 1915 — when were the roof, HVAC, electrical panel, plumbing, and water heater last replaced?
- Is there a deadline driving the sale (1031 exchange, divorce, estate, relocation)? That informs how much negotiation room exists.
- Schools are F-rated, which usually means shorter tenancies and higher turnover. Who's the typical renter profile here, and what's been the actual vacancy rate?
- Crime grade is F in this area — have there been break-ins, vandalism, or insurance claims at this property in the last 3 years? What carrier currently insures it and at what premium?
- What's the average days-on-market for RENTAL listings here right now (not sales)? A rising rental-DOM trend means longer vacancies and softer asking-rent achievability than the comps imply.
- What's the recent tenant-quality profile in this submarket — average credit score on applications, eviction rate, late-payment / NSF rate, and stable-employment percentage? A property-management company in the area should have these aggregated.
- How much new apartment / multifamily construction is in the pipeline within 1–3 miles? Heavy new supply (>2% of stock underway) typically softens rents 12–24 months out; light construction supports rent growth.
Investment metrics
- 1% rule
- 1.57% ✓
- Cap rate
- 13.36%
- Cash-on-cash
- 25.25%
- DSCR
- 2.12
- GRM
- 5.3
CMA / ARV
- ARV (median comp)
- $131,942
- List price
- $139,900
- Delta
- 6.03%
- Verdict
- FAIR
- Comps
- 20 within 1.0 mi
Show comp detail 12 sales within ~0.75 mi
| Address | Dist | Beds/Ba | Sqft | Sold | Price | $/sf | Match |
|---|---|---|---|---|---|---|---|
| 1126 16th Ave | 0.00mi | 4/2.0 | — | 0mo | $132,000 | — | 87 |
| 1627 7th St | 0.07mi | 4/2.0 | — | 4mo | $115,000 | — | 81 |
| 1821 7th St | 0.16mi | 5/2.0 (+1) | — | 2mo | $190,000 | — | 73 |
| 1611 S 4th St | 0.30mi | 4/2.0 | — | 2mo | $170,000 | — | 72 |
| 1323 Broadway | 0.24mi | 3/2.0 (-1) | — | 2mo | $75,000 | — | 69 |
| 1204 S 6th St | 0.36mi | 4/2.0 | — | 3mo | $128,000 | — | 68 |
| 1509 16th Ave | 0.34mi | 5/2.0 (+1) | — | 1mo | $203,000 | — | 66 |
| 2242 7th St | 0.51mi | 4/2.0 | — | 1mo | $170,000 | — | 63 |
| 2111 S 4th St | 0.46mi | 4/2.0 | — | 4mo | $151,000 | — | 63 |
| 906 S 5th St | 0.58mi | 4/2.0 | — | 1mo | $138,000 | — | 59 |
| 1531 12th Ave | 0.47mi | 4/4.0 | — | 4mo | $160,000 | — | 55 |
| 1443 8th Ave | 0.66mi | 4/4.0 | 1,388 | 3mo | $219,900 | $158 | 46 |
Match score weights: distance 35% · size 25% · config 20% · recency 20%. Top-matched comps best support the ARV.
Projected returns pro-forma
-3.0% appreciation · 8.0% rent growth · sell at horizon
- IRR
- 24.2%
- Equity multiple
- 2.06×
- Total profit
- $41,433
- Equity at exit
- $20,860
- IRR
- 34.9%
- Equity multiple
- 4.99×
- Total profit
- $156,476
- Equity at exit
- $12,096
Cash invested: $39,172 (down + closing). Projections, not guarantees.
Landlord ↔ Tenant lean methodology
- Overall (STATE)
- 43 Moderately Tenant-Leaning
- State Illinois
- 43 Moderately Tenant-Leaning · D+7
- County
- — inherits STATE
- City
- — inherits STATE
ZIP-level market 61104
- Home prices YoY
- -21.4%
- Rents YoY
- 9.7%
- Active inventory
- 69
- Price-to-rent
- 10.6×
Monthly cashflow live
- Estimated rent
- $2,195 high interval (Pro) →
- Mortgage (P&I)
- −$734
- Tax from tax record
- −$118 /mo · $1,413/yr
- Insurance
- −$58
- HOA
- −$0
- Vacancy / Maint / Mgmt
- −$461
- Net cashflow
- $824
Break-even live
Sensitivity live
| Price | -10% $904 | -5% $864 | +0% $824 | +5% $785 | +10% $745 |
|---|---|---|---|---|---|
| Rent | -10% $651 | -5% $738 | +0% $824 | +5% $911 | +10% $998 |
| Rate | -1.0pp $895 | -0.5pp $860 | base $824 | +0.5pp $788 | +1.0pp $751 |
2-unit breakdown (identical units grouped — click to expand)
| Units | Beds | Baths | Est. rent |
|---|---|---|---|
| 2× units | 2 | 1 | $2,196 |
| #1 | 2 | 1 | $1,098 |
| #2 | 2 | 1 | $1,098 |
| Total (2 units) | $2,195 | ||
UW: 25.0% down · 7.5% · 30yr · 1.5% tax · 5.0% vac · 8.0% maint · 8.0% mgmt
Financing live
Cash to close
- Down payment
- $34,975
- Closing costs
- $4,197
- Reserves months
- —
- Total cash needed
- —
Loan-product check · same deal, 3 products live
Conventional
25% down · 7.5% · 30yr
- Down + closing
- —
- Monthly P&I
- —
- Monthly cashflow
- —
- DSCR
- —
- Eligible?
- —
Personal DTI + credit; lowest rate.
DSCR
20% down · 8.5% · 30yr
- Down + closing
- —
- Monthly P&I
- —
- Monthly cashflow
- —
- DSCR
- —
- Eligible?
- —
No personal income docs; deal must DSCR.
Hard money
10% down · 12.0% · 12mo
- Down + closing
- —
- Monthly P&I
- —
- Monthly cashflow
- —
- DSCR
- —
- Eligible?
- —
Short-term bridge; refi at stabilization.
Rent comps 16 comps
| Address | Beds | Baths | Sqft | Rent | $/sqft | DOM | Units | Dist |
|---|---|---|---|---|---|---|---|---|
| 1612 10th St Unit 2 Rockford, IL | 3.0 | 1.0 | — | $1,250 | — | 45d | 1 | 0.26mi |
| 1231 11th Ave Rockford, IL | 4.0 | 1.0 | 1284 | $1,450 | $1.13 | 45d | 1 | 0.37mi |
| 1519 17th Ave Rockford, IL | 3.0 | 2.0 | 1500 | $1,600 | $1.07 | 14d | 1 | 0.38mi |
| 2217 8th St Rockford, IL | 3.0 | 1.0 | 1260 | $1,500 | $1.19 | 45d | 1 | 0.45mi |
| 1119 9th Ave Unit 1W Rockford, IL | 3.0 | 1.0 | 1155 | $1,600 | $1.39 | 45d | 1 | 0.50mi |
| 344 Buckbee St Rockford, IL | 3.0 | 2.0 | — | $1,300 | — | 45d | 1 | 0.67mi |
| 1351 7th Ave Rockford, IL | 4.0 | 2.0 | 1040 | $2,000 | $1.92 | 45d | 1 | 0.69mi |
| 1209 6th Ave Rockford, IL | 3.0 | 1.0 | — | $1,500 | — | 22d | 1 | 0.71mi |
| 713 S 4th St Unit Upper Rockford, IL | 4.0 | 2.0 | — | $1,500 | — | 45d | 1 | 0.75mi |
| 1004 15th St Rockford, IL | 4.0 | 1.5 | 1267 | $1,450 | $1.14 | 22d | 1 | 0.90mi |
| 1202 18th St Unit 3 Rockford, IL | 3.0 | 1.0 | 1500 | $1,700 | $1.13 | 14d | 1 | 1.01mi |
| 333 S Gardiner Ave Unit AVE2 Rockford, IL | 4.0 | 1.0 | 1306 | $1,600 | $1.23 | 45d | 1 | 1.16mi |
| 507 Oak St Unit 2 Rockford, IL | 3.0 | 2.5 | — | $1,250 | — | 22d | 1 | 1.17mi |
| 222 S 2nd St Unit 224 Rockford, IL | 3.0 | 1.0 | — | $1,350 | — | 22d | 1 | 1.19mi |
| 512 Market St Unit 512 UPPER Rockford, IL | 3.0 | 1.0 | — | $1,750 | — | 45d | 1 | 1.31mi |
| 1229 S Church St Unit 2 Rockford, IL | 3.0 | 1.0 | 1096 | $1,300 | $1.19 | 45d | 1 | 1.34mi |
Listing history 8 events
-
2026-05-05status Pending 280-char remark
Show marketing remark (280 chars)
This 1,430 sq ft multi-family property features two units, each with 2 bedrooms and 1 bathroom. Both units offer comfortable living spaces, and the large yard adds extra appeal for tenants or outdoor use. Perfect for investors or owner-occupants looking to generate rental income.
-
2026-04-20price $139,900 280-char remark
Show marketing remark (280 chars)
This 1,430 sq ft multi-family property features two units, each with 2 bedrooms and 1 bathroom. Both units offer comfortable living spaces, and the large yard adds extra appeal for tenants or outdoor use. Perfect for investors or owner-occupants looking to generate rental income.
-
2026-03-18$149,000 Active 280-char remark
Show marketing remark (280 chars)
This 1,430 sq ft multi-family property features two units, each with 2 bedrooms and 1 bathroom. Both units offer comfortable living spaces, and the large yard adds extra appeal for tenants or outdoor use. Perfect for investors or owner-occupants looking to generate rental income.
-
2022-11-28historical 507-char remark
Show marketing remark (507 chars)
(2) family residential nestled between the 11th Street and Kishwaukee corridor. Each unit has 2 bedrooms and 1 full bath. Both sides occupied by owner/family. (Property IS NOT currently used for rental income. ) Each unit has gas stove, microwave, and refrigerator. 1126 has new vanity and new toilet. 1126 1/2 unit has new tile flooring, new vanity, toilet and bath tub. Window A/C units stay. Water heater on 1126 1/2 side is appx 5 yrs old. New roof September 2021. Fully fenced yard. Basement is clean!
-
2022-11-10soldstatus $54,900
-
2022-11-07soldstatus $54,900 Closed 507-char remark
Show marketing remark (507 chars)
(2) family residential nestled between the 11th Street and Kishwaukee corridor. Each unit has 2 bedrooms and 1 full bath. Both sides occupied by owner/family. (Property IS NOT currently used for rental income. ) Each unit has gas stove, microwave, and refrigerator. 1126 has new vanity and new toilet. 1126 1/2 unit has new tile flooring, new vanity, toilet and bath tub. Window A/C units stay. Water heater on 1126 1/2 side is appx 5 yrs old. New roof September 2021. Fully fenced yard. Basement is clean!
-
2022-10-11historical 507-char remark
Show marketing remark (507 chars)
(2) family residential nestled between the 11th Street and Kishwaukee corridor. Each unit has 2 bedrooms and 1 full bath. Both sides occupied by owner/family. (Property IS NOT currently used for rental income. ) Each unit has gas stove, microwave, and refrigerator. 1126 has new vanity and new toilet. 1126 1/2 unit has new tile flooring, new vanity, toilet and bath tub. Window A/C units stay. Water heater on 1126 1/2 side is appx 5 yrs old. New roof September 2021. Fully fenced yard. Basement is clean!
-
2022-10-09$54,900 507-char remark
Show marketing remark (507 chars)
(2) family residential nestled between the 11th Street and Kishwaukee corridor. Each unit has 2 bedrooms and 1 full bath. Both sides occupied by owner/family. (Property IS NOT currently used for rental income. ) Each unit has gas stove, microwave, and refrigerator. 1126 has new vanity and new toilet. 1126 1/2 unit has new tile flooring, new vanity, toilet and bath tub. Window A/C units stay. Water heater on 1126 1/2 side is appx 5 yrs old. New roof September 2021. Fully fenced yard. Basement is clean!
ⓘ Source: listings_history table (triggers on properties + properties_extension) + one-shot
backfill from property_details.listing_events for pre-trigger history.
Tax reassessment forecast IL · Partial reset (capped growth)
- Current annual tax
- $1,413 · $118/mo
- Projected year-2 tax
- $2,294 · $191/mo
- Expected delta
- +$881/yr (+$73/mo · 62.4%)
ⓘ Screening estimate from a state-policy table — verify with the county assessor before closing.
Climate risk First Street
- Flood 1/10 Low FEMA zone X (unshaded) · 0% chance over 30 yrs
- Wildfire 1/10 Low
- Heat 2/10 Low 7 d/yr ≥101°F today · 15 d/yr by 30 yrs out
- Wind 2/10 Low
- Air quality 2/10 Low 1 unhealthy d/yr today · 2 by 30 yrs out
Nearby sold comps map
Loading sold comps map…
Walkable amenities ~0.75 mi
Loading nearby amenities…
Taxation est. · year 1
- Rental income
- $26,340
- − Mortgage interest
- −$7,837
- − Property taxes
- −$1,413
- − Insurance
- −$700
- − Repairs & maintenance
- −$2,107
- − Management
- −$2,107
- − Depreciation
- −$4,070
- Taxable income
- $8,107
- Est. tax owed @ 24.0%
- −$1,946
- After-tax cash flow
- $7,947/yr
For passive investors: Depreciation is non-cash, so a rental often shows a tax loss while cash-flowing — sheltering income. Rental losses are passive: they offset passive income freely, and up to $25,000/yr can offset ordinary (W-2) income if you actively participate and your MAGI is under $100k (phasing out to $0 by $150k); unused losses carry forward. On sale, claimed depreciation is recaptured at up to 25%, and gains may owe capital-gains tax (a 1031 exchange can defer both). Figures are a year-1 estimate at your 24.0% rate — not tax advice; consult a CPA.
Schools (NCES district)
- District
- Rockford SD 205
- NCES district ID
- 1734510
- Math proficiency
- 12% ▼ -2.00%
- Reading proficiency
- 16% ▼ -3.00%
- Median HH income
- $42,533
- Composite
- 12.21/100
- National rank
- #9649
- State rank
- #533 of 620 in IL
Livability — Rockford
- Score
- 62/100
- State rank
- #876
- US rank
- #17035
Category grades
Schools grade is shown separately in the Schools card above.
Census & demographics
- Census place
- Rockford, IL
- County
- Winnebago County · 147,297 people
- City population
- 147,297
- Metro
- Rockford, IL
- Population (ZIP)
- 17,222
- Household income
- $33,772
- Rent vs Own
- Severe rent burden
- 1406.0
Population outlook (Winnebago County) Hauer SSP2
- Today (2025)
- 271,080 people
- By 2030
- 260,684 · -3.8%
- By 2040
- 238,405 · -12.1%
- By 2050
- 216,129 · -20.3%
- By 2075
- 172,882 · -36.2%
- By 2100
- 135,336 · -50.1%
Race, ethnicity, and origin ACS 2023
- Neighborhood character
- Highly diverse neighborhood (Simpson 0.70)
- Race & ethnicity
- White 41% Hispanic / Latino 26% Black 25% Two or more races 13% Asian 4%
- Hispanic origin (detail)
- Mexican 22% Puerto Rican 2%
- Common ancestry
- Romanian 2% Portuguese 2% Lithuanian 2%
- Foreign-born
- 16% · Canada, South Korea, Philippines
- Languages at home
- 74% English-only · Spanish 18% Other Asian/Pacific 3% Russian/Polish/Slavic 1%
Political lean MEDSL · Winnebago
- 2024 margin
- Toss-up / Even · D 49.5% · R 49.0% · Other 1.5%
- 2008→2024 swing
- -12.2pp toward R · 2008: 12.8pp · 2024: 0.6pp
- All cycles
- 2024: D+0.6 2020: D+2.5 2016: R+1.2 2012: D+5.7 2008: D+12.8
Not yet ingested
- Civics
- —
Market trends
- HPI YoY
- ▼ -63.40%
- Current HPI
- 233.0219
- Rent YoY
- ▲ 9.67%
- Metro
- Rockford, IL
- State GDP YoY
- ▲ 1.59%
- F500 in state
- 60
Industry mix (Fortune 500 HQ in IL)
| Industry | F500 HQs | Revenue |
|---|---|---|
| Insurance | 4 | $201B |
|
||
| Consumer Goods | 4 | $87B |
|
||
| Industrial Machinery | 3 | $64B |
|
||
| Healthcare | 2 | $55B |
|
||
| Retail / Pharmacy | 1 | $148B |
|
||
| Agriculture / Food | 1 | $86B |
|
||
Price history
+154.8% since first listed8 events — show timeline
- 2026-05-05 Pending — NWIAR
- 2026-04-20 Price Changed $139,900 NWIAR
- 2026-03-18 Listed $149,000 NWIAR
- 2022-11-28 Delisted — NWIAR
- 2022-11-10 Sold (Public Records) $54,900 Public Records
- 2022-11-07 Sold (MLS) $54,900 NWIAR
- 2022-10-11 Delisted — NWIAR
- 2022-10-09 Listed $54,900 NWIAR
Property tax history
-1.6%/yrLatest (2024): $1,413 · +3.5% YoY. Source: county tax records.
Cash-flow waterfall
monthlySold comps — $/sqft
last 12 mo · ≤1 miLoading sold comps…