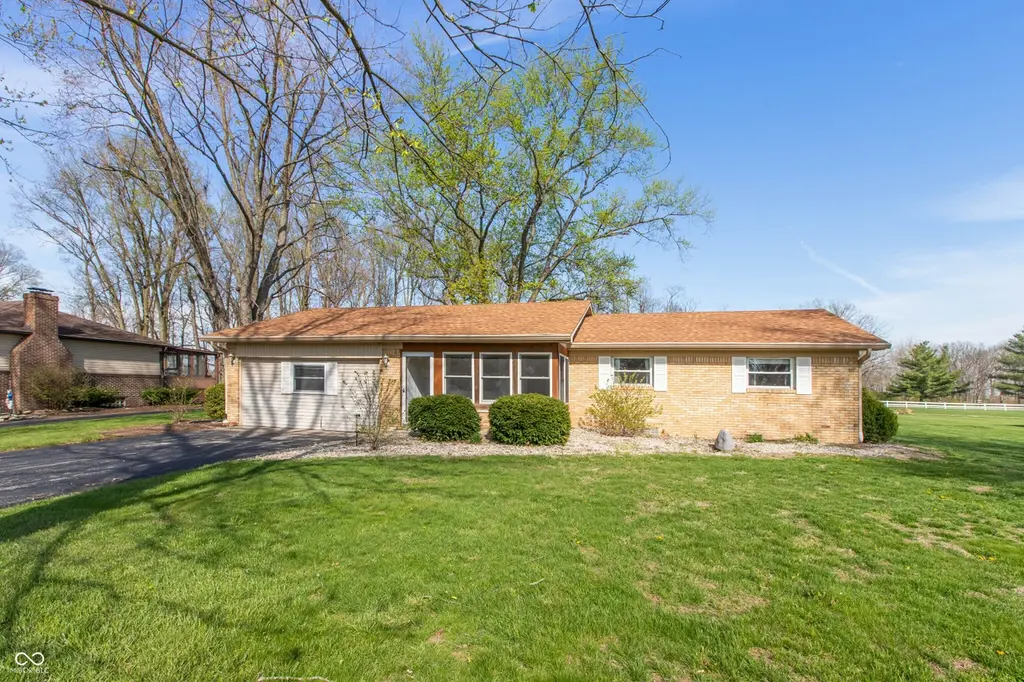
3605 N County Road 950 E · Brownsburg, IN
Flood risk 1/10 · Minimal
- FEMA flood zone
- X (unshaded)
- Chance of flooding over 30 yrs
- 0.0%
- Est. flood insurance / yr
- $507 – $1,088
Fire risk 1/10 · Minimal
- Est. fire insurance / yr
- $717 – $1,331
Heat risk 3/10 · Minor
- Hot days now (above 101°F)
- 7 days/yr
- Hot days in 30 yrs
- 19 days/yr
Wind risk 2/10 · Minimal
- Chance of severe wind over 30 yrs
- 1.0%
Air-quality risk 2/10 · Minimal
- Unhealthy air days now
- 1 days/yr
- Unhealthy air days in 30 yrs
- 2 days/yr
Risk factors via First Street. Map © Google.
Why this score? — see what drove the C- grade
The composite is a weighted blend of 9 inputs, each scored 0–100. Each bar is that input's sub-score; the figure is the points it added to the 100-point composite (weight × sub-score).
- Cash flow +18.0/30.0
- ARV discount +9.5/15.0
- Schools +6.3/10.0
- DSCR +5.6/10.0
- Rent growth +4.1/5.0
- Livability +3.8/5.0
- 1% rule +3.7/10.0
- Condition / age +2.5/5.0
- Appreciation +0.0/10.0
$279,900
🖨 Deal sheet 📄 Offer letter ✓ Due diligence
Listing remarks
Enjoy peaceful country living in this charming ranch home situated on nearly half an acre. A welcoming enclosed front porch leads you inside to a spacious layout featuring both a formal living room and a cozy family room. The family room opens directly to the kitchen, making entertaining effortless. This home offers a desirable three-bedroom split floor plan and beautiful laminate flooring throughout. Step outside to the expansive covered back patio that spans the entire length of the house-a perfect spot to relax and enjoy the quiet surroundings. The fully fenced backyard includes two storage sheds (one with a loft) plus an impressive heated 4+ car garage/pole barn with loft and dog kennel
Key facts
- Cozy family room
- Formal living room
- Spacious layout
Tags
Property features AI
Exterior
- Parking: Detached garage (4 car)
- Utilities: Private water; Septic
- Home design: Single-family residence; One level
- Construction: Vinyl siding; Crawl space foundation
- Exterior features: Covered, glass-enclosed patio/porch; Mini barn and pole barn; Additional storage; Full yard fencing
Interior
- Kitchen: Electric cooktop; Electric oven; Dishwasher; Refrigerator; Garbage disposal; Water softener (owned)
- Bedrooms: Primary bedroom with walk-in closet; bedroom split layout; Four bedrooms on the main level
- Bathrooms: Three full bathrooms; Primary bathroom with tub and shower
- Heating & cooling: Natural gas heating; Central air conditioning
- Interior features: Attic access; Breakfast bar; Laundry in unit / utility room
- Laundry & utility: Laundry room on main level; Utility room
Neighborhood map
What this means for you Summary
Snapshot
- This is a 3-bed/1.5-bath single-family listed at $280k.
Deal economics
- At list price, monthly cash flow is $239 ($3k/yr) — positive.
- The deal already cash-flows at list — no discount required.
- To meet the 1% rule (rent ≥ 1% of price), the offer needs to be $243k (13.1% below list).
- Recommended offer: $243k (13.1% below list) — sets the bar for 1% rule.
- Cap rate 7.3% vs local median 3.8% in Brownsburg — top-decile yield for the area; either an underpriced asset or a hidden risk that comps aren't pricing in. Stress-test before assuming the spread holds.
Location & tenants
- Location reads 75/100 on livability (#61 in IN, #4,105 nationally) — a middle-class / working-renter tenant base. Strengths: schools A+, crime A+, employment A+; Watch: amenities F, commute F, health & safety F.
- Brownsburg Community School Corporation (suburban): math 72% / reading 72% proficiency, ranked #2 of 301 in IN (top 1%) — strong family-tenant draw, lease renewals of 3-5y typical; only 17% free/reduced lunch — higher-income household profile.
- Market conditions: Rents rising fast (+6.3%/yr); 328 active listings in the ZIP; 2 comparable units currently listed for rent nearby; high-income renter base; 1,294 units permitted in Hendricks County in 2024 (18 in 5+ unit buildings).
Forward outlook
- Local home prices are declining (-3.0%/yr); year-one equity from $2k of loan paydown is wiped out by about $8k of value loss. Plan a longer hold.
- Hendricks County population projected at +35% by 2050 — long-run rental-demand tailwind backs the buy-and-hold thesis.
Negotiation context
- It's been on market 20 days — a 2% lower offer ($276k) is reasonable based on typical stale-listing flexibility.
- 2 sale attempts; this cycle's ask has dropped $20k (7%) from the opening price — seller is motivated, your offer sets the floor, not the list.
Questions for the listing agent
- Built in 1970 — when were the roof, HVAC, electrical panel, plumbing, and water heater last replaced?
- Is there a deadline driving the sale (1031 exchange, divorce, estate, relocation)? That informs how much negotiation room exists.
- Schools are A-rated — typically a magnet for longer-tenancy family renters. What's the average tenant stay here, and is there a school-zone premium baked into asking?
- What's the average days-on-market for RENTAL listings here right now (not sales)? A rising rental-DOM trend means longer vacancies and softer asking-rent achievability than the comps imply.
- What's the recent tenant-quality profile in this submarket — average credit score on applications, eviction rate, late-payment / NSF rate, and stable-employment percentage? A property-management company in the area should have these aggregated.
- How much new for-sale + rental construction is in the pipeline within 1–3 miles? Heavy new supply typically softens prices + rents 12–24 months out; constrained supply supports both.
Investment metrics
- 1% rule
- 0.87% ✗
- Cap rate
- 7.32%
- Cash-on-cash
- 3.66%
- DSCR
- 1.16
- GRM
- 9.6
CMA / ARV
- ARV (on-the-fly)
- $292,800
- Comps found
- 12
Show comp detail 12 sales within ~0.75 mi
| Address | Dist | Beds/Ba | Sqft | Sold | Price | $/sf | Match |
|---|---|---|---|---|---|---|---|
| 3605 N County Road 950 E | 0.00mi | 4/3.0 (+1) | 1,600 (0%) | 1mo | $284,900 | $178 | 88 |
| 3530 N County Road 950 E | 0.07mi | 3/2.0 | 1,540 (-4%) | 14mo | $267,875 | $174 | 76 |
| 9159 E County Road 400 N | 0.52mi | 3/2.0 | 1,634 (+2%) | 12mo | $369,900 | $226 | 60 |
| 3085 N County Road 950 E | 0.50mi | 3/2.0 | 1,520 (-5%) | 8mo | $315,000 | $207 | 60 |
| 3700 Country Ln | 0.28mi | 3/2.0 | 1,540 (-4%) | 23mo | $354,000 | $230 | 60 |
| 9405 E County Road 400 N | 0.41mi | 3/2.0 | 1,523 (-5%) | 15mo | $266,444 | $175 | 58 |
| 9303 Leroy Rd | 0.46mi | 3/2.5 | 1,677 (+5%) | 13mo | $288,000 | $172 | 56 |
| 3225 N County Road 950 E | 0.36mi | 3/2.0 | 1,501 (-6%) | 20mo | $275,000 | $183 | 54 |
| 9189 Dawn Dr | 0.63mi | 3/2.0 | 1,545 (-3%) | 11mo | $250,000 | $162 | 54 |
| 3733 N County Road 900 E | 0.49mi | 3/2.0 | 1,694 (+6%) | 16mo | $340,000 | $201 | 52 |
| 3790 N County Road 950 E | 0.17mi | 3/2.5 | 1,835 (+15%) | 18mo | $290,000 | $158 | 48 |
| 9170 E County Road 300 N | 0.64mi | 3/2.0 | 1,369 (-14%) | 2mo | $260,000 | $190 | 42 |
Match score weights: distance 35% · size 25% · config 20% · recency 20%. Top-matched comps best support the ARV.
Projected returns pro-forma
-3.0% appreciation · 6.31% rent growth · sell at horizon
- IRR
- -7.3%
- Equity multiple
- 0.72×
- Total profit
- $-21,887
- Equity at exit
- $41,734
- IRR
- 5.6%
- Equity multiple
- 1.47×
- Total profit
- $36,806
- Equity at exit
- $24,201
Cash invested: $78,372 (down + closing). Projections, not guarantees.
Landlord ↔ Tenant lean methodology
- Overall (STATE)
- 90 Strongly Landlord-Friendly
- State Indiana
- 90 Strongly Landlord-Friendly · R+11
- County
- — inherits STATE
- City
- — inherits STATE
ZIP-level market 46112
- Rents YoY
- 6.3%
- Active inventory
- 328
- Price-to-rent
- 9.6×
Monthly cashflow live
- Estimated rent
- $2,431 medium interval (Pro) →
- Mortgage (P&I)
- −$1,468
- Tax from tax record
- −$97 /mo · $1,167/yr
- Insurance
- −$117
- HOA
- −$0
- Vacancy / Maint / Mgmt
- −$511
- Net cashflow
- $239
Break-even live
UW: 25.0% down · 7.5% · 30yr · 1.5% tax · 5.0% vac · 8.0% maint · 8.0% mgmt
Financing live
Cash to close
- Down payment
- $69,975
- Closing costs
- $8,397
- Reserves months
- —
- Total cash needed
- —
Loan-product check · same deal, 3 products live
Conventional
25% down · 7.5% · 30yr
- Down + closing
- —
- Monthly P&I
- —
- Monthly cashflow
- —
- DSCR
- —
- Eligible?
- —
Personal DTI + credit; lowest rate.
DSCR
20% down · 8.5% · 30yr
- Down + closing
- —
- Monthly P&I
- —
- Monthly cashflow
- —
- DSCR
- —
- Eligible?
- —
No personal income docs; deal must DSCR.
Hard money
10% down · 12.0% · 12mo
- Down + closing
- —
- Monthly P&I
- —
- Monthly cashflow
- —
- DSCR
- —
- Eligible?
- —
Short-term bridge; refi at stabilization.
Rent comps 2 comps
| Address | Beds | Baths | Sqft | Rent | $/sqft | DOM | Units | Dist |
|---|---|---|---|---|---|---|---|---|
| 460 Brookview Dr Brownsburg, IN | 4.0 | 2.5 | 2240 | $2,600 | $1.16 | 43d | 1 | 1.02mi |
| 8267 Templederry Dr Brownsburg, IN | 3.0 | 2.0 | 1804 | $2,145 | $1.19 | 43d | 1 | 1.37mi |
Listing history 7 events
-
2026-05-08status Pending
-
2026-05-08status Active
-
2026-04-30status Pending
-
2026-04-19price $279,900
-
2026-04-17price $285,000
-
2026-04-15price $289,900
-
2026-04-09$299,900 Active
ⓘ Source: listings_history table (triggers on properties + properties_extension) + one-shot
backfill from property_details.listing_events for pre-trigger history.
Tax reassessment forecast IN · Partial reset (capped growth)
- Current annual tax
- $1,167 · $97/mo
- Projected year-2 tax
- $1,773 · $148/mo
- Expected delta
- +$606/yr (+$50/mo · 51.9%)
ⓘ Screening estimate from a state-policy table — verify with the county assessor before closing.
Climate risk First Street
- Flood 1/10 Low FEMA zone X (unshaded) · 0% chance over 30 yrs
- Wildfire 1/10 Low
- Heat 3/10 Moderate 7 d/yr ≥101°F today · 19 d/yr by 30 yrs out
- Wind 2/10 Low 100% chance of damaging wind over 30 yrs
- Air quality 2/10 Low 1 unhealthy d/yr today · 2 by 30 yrs out
Nearby sold comps map
Loading sold comps map…
Walkable amenities ~0.75 mi
Loading nearby amenities…
Taxation est. · year 1
- Rental income
- $29,175
- − Mortgage interest
- −$15,679
- − Property taxes
- −$1,167
- − Insurance
- −$1,400
- − Repairs & maintenance
- −$2,334
- − Management
- −$2,334
- − Depreciation
- −$8,143
- Taxable loss
- −$1,881
- Est. tax savings @ 24.0%
- +$451
- After-tax cash flow
- $3,319/yr
For passive investors: Depreciation is non-cash, so a rental often shows a tax loss while cash-flowing — sheltering income. Rental losses are passive: they offset passive income freely, and up to $25,000/yr can offset ordinary (W-2) income if you actively participate and your MAGI is under $100k (phasing out to $0 by $150k); unused losses carry forward. On sale, claimed depreciation is recaptured at up to 25%, and gains may owe capital-gains tax (a 1031 exchange can defer both). Figures are a year-1 estimate at your 24.0% rate — not tax advice; consult a CPA.
Schools (NCES district)
- District
- Brownsburg Community School Corporation
- NCES district ID
- 1801020
- Math proficiency
- 72% ▼ -5.00%
- Reading proficiency
- 72% ▼ -4.00%
- Median HH income
- $75,304
- Composite
- 63.45/100
- National rank
- #616
- State rank
- #2 of 301 in IN
Livability — Brownsburg
- Score
- 75/100
- State rank
- #61
- US rank
- #4105
Category grades
Schools grade is shown separately in the Schools card above.
Census & demographics
- County
- Hendricks County · 143,373 people
- City population
- 44,220
- Metro
- Indianapolis-Carmel-Anderson, IN
- Population (ZIP)
- 44,220
- Household income
- $112,565
- Rent vs Own
- Severe rent burden
- 614.0
Population outlook (Hendricks County) Hauer SSP2
- Today (2025)
- 187,418 people
- By 2030
- 201,494 · +7.5%
- By 2040
- 228,487 · +21.9%
- By 2050
- 253,068 · +35.0%
- By 2075
- 308,920 · +64.8%
- By 2100
- 336,510 · +79.6%
Race, ethnicity, and origin ACS 2023
- Neighborhood character
- Predominantly White (83%)
- Race & ethnicity
- White 83% Black 10% Two or more races 4% Hispanic / Latino 4%
- Common ancestry
- Slovak 3% Iranian 2% Romanian 2%
- Foreign-born
- 6% · Canada, China
- Languages at home
- 93% English-only · Spanish 2% French/Haitian/Cajun 1%
Political lean MEDSL · Hendricks
- 2024 margin
- Strong R (+21.5) · D 38.4% · R 59.9% · Other 1.7%
- 2008→2024 swing
- +1.9pp toward D · 2008: -23.4pp · 2024: -21.5pp
- All cycles
- 2024: R+21.5 2020: R+23.9 2016: R+34.2 2012: R+34.9 2008: R+23.4
Not yet ingested
- Civics
- —
Market trends
- HPI YoY
- ▼ -135.99%
- Current HPI
- 217.3787
- Rent YoY
- ▲ 6.31%
- Metro
- Indianapolis-Carmel-Anderson, IN
- State GDP YoY
- ▲ 2.90%
- F500 in state
- 18
Industry mix (Fortune 500 HQ in IN)
| Industry | F500 HQs | Revenue |
|---|---|---|
| Industrial Machinery | 2 | $37B |
|
||
| Healthcare | 1 | $177B |
|
||
| Pharmaceuticals | 1 | $45B |
|
||
| Metals / Steel | 1 | $18B |
|
||
| Agriculture | 1 | $17B |
|
||
| Packaging | 1 | $12B |
|
||
Price history
-6.7% since first listed7 events — show timeline
- 2026-05-08 Pending — MIBOR as Distributed by MLS Grid
- 2026-05-08 Relisted — MIBOR as Distributed by MLS Grid
- 2026-04-30 Pending — MIBOR as Distributed by MLS Grid
- 2026-04-19 Price Changed $279,900 MIBOR as Distributed by MLS Grid
- 2026-04-17 Price Changed $285,000 MIBOR as Distributed by MLS Grid
- 2026-04-15 Price Changed $289,900 MIBOR as Distributed by MLS Grid
- 2026-04-09 Listed $299,900 MIBOR as Distributed by MLS Grid
Property tax history
-2.3%/yrLatest (2025): $1,167 · -8.2% YoY. Source: county tax records.
Cash-flow waterfall
monthlySold comps — $/sqft
last 12 mo · ≤1 miLoading sold comps…