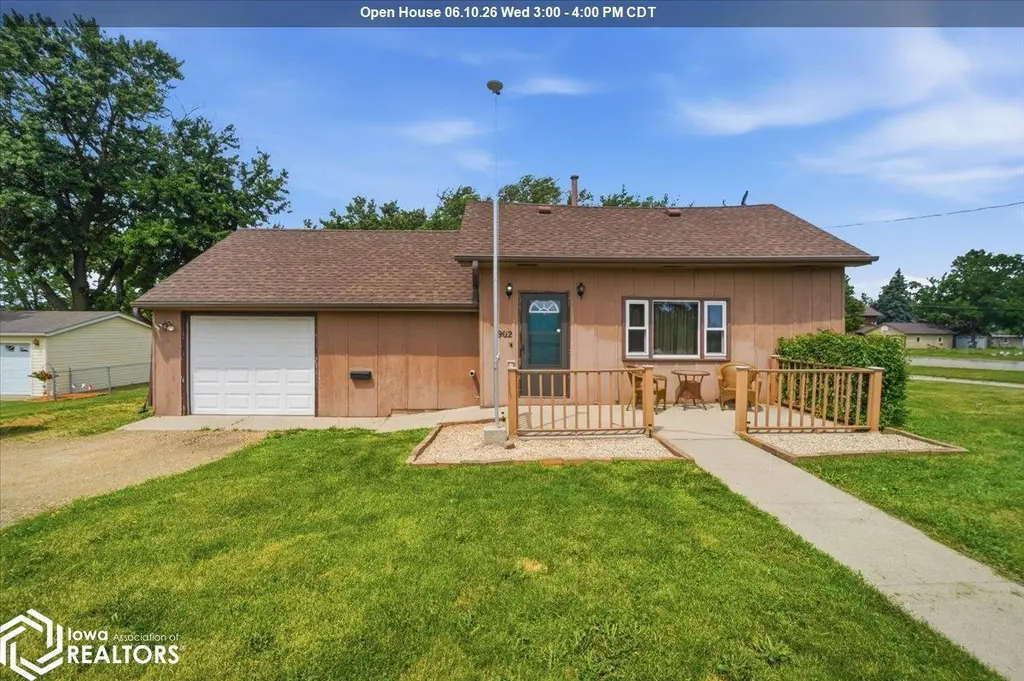
1902 12th St · Eldora, IA
Flood risk 1/10 · Minimal
- FEMA flood zone
- X (unshaded)
- Chance of flooding over 30 yrs
- 0.0%
- Est. flood insurance / yr
- $473 – $860
Fire risk 4/10 · Minor
- Est. fire insurance / yr
- $902 – $1,676
Heat risk 3/10 · Minor
- Hot days now (above 103°F)
- 7 days/yr
- Hot days in 30 yrs
- 15 days/yr
Wind risk 2/10 · Minimal
- Chance of severe wind over 30 yrs
- —
Air-quality risk 1/10 · Minimal
- Unhealthy air days now
- 0 days/yr
- Unhealthy air days in 30 yrs
- 0 days/yr
Risk factors via First Street. Map © Google.
Why this score? — see what drove the C+ grade
The composite is a weighted blend of 9 inputs, each scored 0–100. Each bar is that input's sub-score; the figure is the points it added to the 100-point composite (weight × sub-score).
- Cash flow +28.3/30.0
- DSCR +10.0/10.0
- 1% rule +7.5/10.0
- Schools +5.3/10.0
- Livability +3.6/5.0
- Rent growth +2.5/5.0
- Condition / age +2.5/5.0
- Appreciation +2.0/10.0
- ARV discount +0.9/15.0
$69,900
🖨 Deal sheet (PDF) 📄 Offer letter ✓ Due diligence
Listing remarks MLS
Welcome to this adorable ranch-style home with 824 sq ft on the main level plus a partial basement. This home is the perfect blend of comfort and practicality. Step inside to find a bright living area that flows into the kitchen and dining space, creating a warm and inviting atmosphere. The main level features 2 comfortable bedrooms and 1 full bathroom, making it a great fit for first-time buyers, downsizers, or anyone looking for a low-maintenance home. Outside, you’ll love the huge yard—plenty of space for gardening, play, pets, or future outdoor projects. A single-stall garage provides convenient parking and extra storage. If you’re looking for a cute, move-in-ready ranch with a fantastic yard and just the right amount of space, this is the one to see!
Key facts
- Huge yard
- Bright living area
- Single stall garage
Tags
Property features AI
Exterior
- Parking: Attached garage; 1-car carport
- Utilities: Public water; Public sewer
- Home design: Single family residence; Residential property; R-1 zoning
- Construction: Shingle roof
- Exterior features: Concrete road; 110 x 84 lot dimensions; Vertical siding
Interior
- Kitchen: Microwave; Free-standing range; Refrigerator
- Bathrooms: 1 full bathroom
- Heating & cooling: Forced air heating (natural gas); Central air conditioning
- Interior features: Block basement; No fireplace
- Laundry & utility: Dryer; Gas water heater
Neighborhood map
What this means for you Summary
Snapshot
- This is a 2-bed/1.0-bath single-family listed at $70k.
Deal economics
- At list price, monthly cash flow is $225 ($3k/yr) — positive.
- The deal already cash-flows at list — no discount required.
- Meets the 1% rule at list price ($875 rent vs $70k).
- Recommended offer: $69k (1.5% below list) — sets the bar for market timing.
Location & tenants
- Location reads 71/100 on livability (#336 in IA) — a middle-class / working-renter tenant base. Strengths: cost of living A+, housing A+, health & safety A+; Watch: crime F, amenities F, commute F.
- Eldora-New Providence Community School District (rural): math 60% / reading 66% proficiency, ranked #217 of 289 in IA (top 75%) — acceptable for families but not a draw, mixed tenant base, ~2y average lease.
- Zoned schools: Eldora-New Providence Elementary School (math 62% / reading 57%, grade B-, #390 of 616 statewide, top 69%, 280 students, 45% FRL); South Hardin High School (math 57% / reading 72%, grade B-, #211 of 336 statewide, top 70%, 242 students, 43% FRL) — zoned schools at 44% FRL track the district average.
- Market conditions: 30 active listings in the ZIP; 1 comparable units currently listed for rent nearby; 6 units permitted in Hardin County in 2024 (0 in 5+ unit buildings).
Forward outlook
- Local home prices are declining (-3.0%/yr); year-one equity from $483 of loan paydown is wiped out by about $2k of value loss. Plan a longer hold.
- Hardin County population projected to shrink 6% by 2050 — rents likely to lag national; underwrite the cash flow, not the appreciation.
- At projected returns (-3.0% appreciation + 3.0% rent growth), your $20k cash investment doubles in ~9 years — after that, you're playing with house money.
Negotiation context
- It's been on market 16 days — a 2% lower offer ($69k) is reasonable based on typical stale-listing flexibility.
- 2 sale attempts with the ask held roughly flat each time — persistent listings suggest the price (not the market) is what's stuck; bring a comps-based counter.
Risks & watch-outs
- Watch-outs: built in 1900 — expect roof / HVAC / electrical / plumbing capex.
Questions for the listing agent
- Built in 1900 — when were the roof, HVAC, electrical panel, plumbing, and water heater last replaced?
- Is there a deadline driving the sale (1031 exchange, divorce, estate, relocation)? That informs how much negotiation room exists.
- Schools are B-rated — typically a magnet for longer-tenancy family renters. What's the average tenant stay here, and is there a school-zone premium baked into asking?
- Crime grade is F in this area — have there been break-ins, vandalism, or insurance claims at this property in the last 3 years? What carrier currently insures it and at what premium?
- What's the average days-on-market for RENTAL listings here right now (not sales)? A rising rental-DOM trend means longer vacancies and softer asking-rent achievability than the comps imply.
- What's the recent tenant-quality profile in this submarket — average credit score on applications, eviction rate, late-payment / NSF rate, and stable-employment percentage? A property-management company in the area should have these aggregated.
- How much new for-sale + rental construction is in the pipeline within 1–3 miles? Heavy new supply typically softens prices + rents 12–24 months out; constrained supply supports both.
Investment metrics
- 1% rule
- 1.25% ✓
- Cap rate
- 10.16%
- Cash-on-cash
- 13.80%
- DSCR
- 1.61
- GRM
- 6.7
CMA / ARV
- ARV (on-the-fly)
- $60,976
- Comps found
- 6
Show comp detail 6 sales within ~0.75 mi
| Address | Dist | Beds/Ba | Sqft | Sold | Price | $/sf | Match |
|---|---|---|---|---|---|---|---|
| 1701 15th St | 0.23mi | 2/1.0 | 913 (+11%) | 7mo | $42,000 | $46 | 65 |
| 1005 15th St | 0.64mi | 2/1.0 | 748 (-9%) | 2mo | $76,500 | $102 | 53 |
| 2102 15th Ave | 0.65mi | 2/1.0 | 748 (-9%) | 7mo | $55,000 | $74 | 48 |
| 1510 16th Ave | 0.34mi | 1/1.0 (-1) | 916 (+11%) | 19mo | $37,000 | $40 | 45 |
| 1817 12th Ave | 0.63mi | 2/1.5 | 750 (-9%) | 14mo | $35,000 | $47 | 42 |
| 818 16th St | 0.74mi | 3/2.0 (+1) | 864 (+5%) | 23mo | $90,000 | $104 | 29 |
Match score weights: distance 35% · size 25% · config 20% · recency 20%. Top-matched comps best support the ARV.
Projected returns pro-forma
-3.0% appreciation · 3.0% rent growth · sell at horizon
- IRR
- 4.0%
- Equity multiple
- 1.15×
- Total profit
- $3,010
- Equity at exit
- $10,422
- IRR
- 13.5%
- Equity multiple
- 2.08×
- Total profit
- $21,091
- Equity at exit
- $6,044
Cash invested: $19,572 (down + closing). Projections, not guarantees.
Landlord ↔ Tenant lean methodology
- Overall (STATE)
- 83 Strongly Landlord-Friendly
- State Iowa
- 83 Strongly Landlord-Friendly · R+6
- County
- — inherits STATE
- City
- — inherits STATE
ZIP-level market 50627
- Home prices YoY
- -3.7%
- Active inventory
- 30
- Price-to-rent
- 6.7×
Monthly cashflow live
- Estimated rent
- $875 medium interval (Pro) →
- Mortgage (P&I)
- −$367
- Tax from tax record
- −$70 /mo · $846/yr
- Insurance
- −$29
- HOA
- −$0
- Vacancy / Maint / Mgmt
- −$184
- Net cashflow
- $225
Break-even live
Sensitivity live
| Price | -10% $265 | -5% $245 | +0% $225 | +5% $205 | +10% $185 |
|---|---|---|---|---|---|
| Rent | -10% $156 | -5% $190 | +0% $225 | +5% $260 | +10% $294 |
| Rate | -1.0pp $260 | -0.5pp $243 | base $225 | +0.5pp $207 | +1.0pp $189 |
UW: 25.0% down · 7.5% · 30yr · 1.5% tax · 5.0% vac · 8.0% maint · 8.0% mgmt
Financing live
Cash to close
- Down payment
- $17,475
- Closing costs
- $2,097
- Reserves months
- —
- Total cash needed
- —
Loan-product check · same deal, 3 products live
Conventional
25% down · 7.5% · 30yr
- Down + closing
- —
- Monthly P&I
- —
- Monthly cashflow
- —
- DSCR
- —
- Eligible?
- —
Personal DTI + credit; lowest rate.
DSCR
20% down · 8.5% · 30yr
- Down + closing
- —
- Monthly P&I
- —
- Monthly cashflow
- —
- DSCR
- —
- Eligible?
- —
No personal income docs; deal must DSCR.
Hard money
10% down · 12.0% · 12mo
- Down + closing
- —
- Monthly P&I
- —
- Monthly cashflow
- —
- DSCR
- —
- Eligible?
- —
Short-term bridge; refi at stabilization.
Rent comps 1 comps
| Address | Beds | Baths | Sqft | Rent | $/sqft | DOM | Units | Dist |
|---|---|---|---|---|---|---|---|---|
| 2413 Edgington Ave Eldora, IA | 2.0 | 1.0 | 750 | $875 | $1.17 | 45d | 1 | 0.95mi |
Listing history 13 events
-
2026-06-21days on market $69,900 Active 16 DOM
-
2026-06-21days on market $69,900 Active 15 DOM
-
2026-06-18days on market $69,900 Active 13 DOM
-
2026-06-17days on market $69,900 Active 12 DOM
-
2026-06-16days on market $69,900 Active 11 DOM
-
2026-06-15days on market $69,900 Active 10 DOM
-
2026-06-13days on market $69,900 Active 8 DOM
-
2026-06-12days on market $69,900 Active 7 DOM
-
2026-06-09days on market $69,900 Active 4 DOM
-
2026-06-08days on market $69,900 Active 3 DOM
-
2026-06-07days on market $69,900 Active 2 DOM
-
2026-06-07remarks 681-char remark
-
2026-06-07$69,900 Active 1 DOM
ⓘ Source: listings_history table (triggers on properties + properties_extension) + one-shot
backfill from property_details.listing_events for pre-trigger history.
Tax reassessment forecast IA · Partial reset (capped growth)
- Current annual tax
- $846 · $70/mo
- Projected year-2 tax
- $972 · $81/mo
- Expected delta
- +$126/yr (+$10/mo · 14.9%)
ⓘ Screening estimate from a state-policy table — verify with the county assessor before closing.
Climate risk First Street
- Flood 1/10 Low FEMA zone X (unshaded) · 0% chance over 30 yrs
- Wildfire 4/10 Moderate
- Heat 3/10 Moderate 7 d/yr ≥103°F today · 15 d/yr by 30 yrs out
- Wind 2/10 Low
- Air quality 1/10 Low 0 unhealthy d/yr today · 0 by 30 yrs out
Nearby sold comps map
Loading sold comps map…
Walkable amenities ~0.75 mi
Loading nearby amenities…
Taxation est. · year 1
- Rental income
- $10,500
- − Mortgage interest
- −$3,915
- − Property taxes
- −$846
- − Insurance
- −$350
- − Repairs & maintenance
- −$840
- − Management
- −$840
- − Depreciation
- −$2,033
- Taxable income
- $1,676
- Est. tax owed @ 24.0%
- −$402
- After-tax cash flow
- $2,299/yr
For passive investors: Depreciation is non-cash, so a rental often shows a tax loss while cash-flowing — sheltering income. Rental losses are passive: they offset passive income freely, and up to $25,000/yr can offset ordinary (W-2) income if you actively participate and your MAGI is under $100k (phasing out to $0 by $150k); unused losses carry forward. On sale, claimed depreciation is recaptured at up to 25%, and gains may owe capital-gains tax (a 1031 exchange can defer both). Figures are a year-1 estimate at your 24.0% rate — not tax advice; consult a CPA.
Schools (NCES district)
- District
- Eldora-New Providence Community School District
- NCES district ID
- 1910690
- Math proficiency
- 60% ▬ 0.00%
- Reading proficiency
- 66% ▲ 1.00%
- Median HH income
- $48,655
- Composite
- 53.42/100
- National rank
- #1470
- State rank
- #217 of 289 in IA
Livability — Eldora
- Score
- 71/100
- State rank
- #336
- US rank
- #6849
Category grades
Schools grade is shown separately in the Schools card above.
Census & demographics
- Census place
- Eldora, IA
- City population
- 3,431
- Population (ZIP)
- 3,431
Population outlook (Hardin County) Hauer SSP2
- Today (2025)
- 17,474 people
- By 2030
- 17,369 · -0.6%
- By 2040
- 17,018 · -2.6%
- By 2050
- 16,454 · -5.8%
- By 2075
- 14,665 · -16.1%
- By 2100
- 12,404 · -29.0%
Race, ethnicity, and origin ACS 2023
- Neighborhood character
- Predominantly White (88%)
- Race & ethnicity
- White 88% Two or more races 5% Asian 3% Black 2% Hispanic / Latino 1%
- Common ancestry
- Portuguese 4% Iranian 3% Slovak 3%
- Foreign-born
- 3% · Vietnam
- Languages at home
- 95% English-only · Vietnamese 1% Arabic 1% Spanish 1%
Political lean MEDSL · Hardin
- 2024 margin
- Solid R (+38.4) · D 30.3% · R 68.7% · Other 1.1%
- 2008→2024 swing
- -39.3pp toward R · 2008: 0.9pp · 2024: -38.4pp
- All cycles
- 2024: R+38.4 2020: R+32.0 2016: R+29.2 2012: R+7.1 2008: D+0.9
Not yet ingested
- Civics
- —
Market trends
- HPI YoY
- ▼ -5.92%
- Current HPI
- 155.9198
- Rent YoY
- —
- Metro
- —
- State GDP YoY
- ▲ 2.48%
- F500 in state
- 4
Industry mix (Fortune 500 HQ in IA)
| Industry | F500 HQs | Revenue |
|---|---|---|
| Financial Services | 1 | $16B |
|
||
| Retail / Convenience | 1 | $15B |
|
||
Price history
+0.0% since first listed2 events — show timeline
- 2026-06-05 Listed $69,900 IAR
- 2026-06-05 Listed $69,900 NEIRBR as distributed by MLS GRID
Property tax history
+3.7%/yrLatest (2025): $846 · +143.1% YoY. Source: county tax records.
Cash-flow waterfall
monthlySold comps — $/sqft
last 12 mo · ≤1 miLoading sold comps…