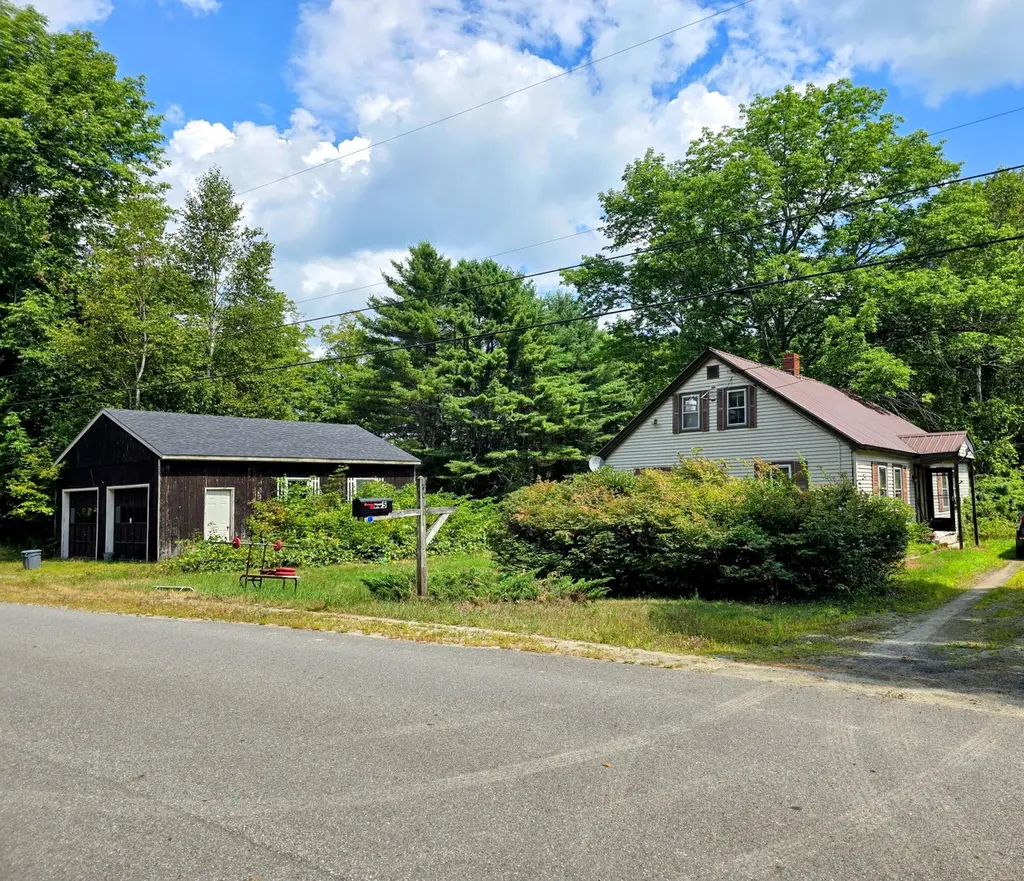
705 Plains Rd · Winthrop, ME
Flood risk No data
- FEMA flood zone
- —
- Chance of flooding over 30 yrs
- —
- Est. flood insurance / yr
- —
Fire risk No data
- Est. fire insurance / yr
- —
Heat risk No data
- Hot days now (above threshold)
- —
- Hot days in 30 yrs
- —
Wind risk No data
- Chance of severe wind over 30 yrs
- —
Air-quality risk No data
- Unhealthy air days now
- —
- Unhealthy air days in 30 yrs
- —
Risk factors via First Street. Map © Google.
Why this score? — see what drove the D+ grade
The composite is a weighted blend of 9 inputs, each scored 0–100. Each bar is that input's sub-score; the figure is the points it added to the 100-point composite (weight × sub-score).
- ARV discount +15.0/15.0
- Schools +7.6/10.0
- Cash flow +7.4/30.0
- Livability +3.5/5.0
- Appreciation +3.4/10.0
- Rent growth +2.5/5.0
- Condition / age +2.5/5.0
- 1% rule +1.7/10.0
- DSCR +1.5/10.0
$199,900
🖨 Deal sheet 📄 Offer letter ✓ Due diligence
Listing remarks
Flippers, take notice! If you're looking for privacy and a peaceful, nature-filled setting, this property delivers. This older home features a metal roof, vinyl siding, and plenty of character. With a bit of work and a creative vision, it has the potential to become something truly impressive. Set on 9 acres, the land includes established flowering bushes, perennials, and an oversized 2-car garage -- the possibilities are endless. Conveniently located just minutes from Readfield and Winthrop, you'll have quick access to all the amenities you need while still enjoying a quiet, secluded environment. * * * THIS IS CONTINGENT ON THE SELLER TO FIND HOUSING * * *
Key facts
- Metal roof
- 9 acres
- Vinyl siding
Tags
Property features AI
Finance
- Other: Lot size approximately 9 acres
- Financial info: Residential zoning
Exterior
- Parking: Detached 2-car garage with storage above; Gravel parking; 1–4 parking spaces
- Utilities: Private well water; Private sewer; Electric service (circuit breakers)
- Home design: Single-family residence; Multi-level; Built in 1840
- Construction: Vinyl siding and wood frame construction; Metal roof; Block, stone, granite, concrete perimeter and brick/mortar foundation
- Exterior features: Glass-enclosed porch; Porch; Rolling/sloping, open, level and wooded lot; Near town, rural setting; Paved road
Interior
- Kitchen: Refrigerator; Gas range
- Bedrooms: Bedroom 1 (First floor); Bedroom 2 (First floor); Bedroom 3 (Second floor); Bedroom 4 (Second floor)
- Flooring: Wood; Laminate; Carpet
- Bathrooms: 1 full bathroom
- Heating & cooling: Forced air; Wood stove; Circuit breaker electrical panel; Electric water heater (off heating system)
- Interior features: First-floor bedroom; Bathtub; Shower; Internet access available; Unfurnished; Six total rooms; One fireplace
- Laundry & utility: First-floor / main-level laundry
Neighborhood map
What this means for you Summary
Snapshot
- This is a 4-bed/1.0-bath single-family listed at $200k.
Deal economics
- At list price, monthly cash flow is $-262 ($-3k/yr) — negative.
- To cash-flow at today's rent, offer at most $154k (23.1% below list).
- To meet the 1% rule (rent ≥ 1% of price), the offer needs to be $133k (33.3% below list).
- Recommended offer: $133k (33.3% below list) — sets the bar for 1% rule.
- Cap rate 4.7% vs local median 2.0% in Winthrop — top-decile yield for the area; either an underpriced asset or a hidden risk that comps aren't pricing in. Stress-test before assuming the spread holds.
Location & tenants
- Location reads 69/100 on livability (#76 in ME) — a middle-class / working-renter tenant base. Strengths: crime A+, cost of living A, housing A; Watch: health & safety C-, employment D, amenities F.
- RSU 38 (rural): math 89% / reading 89% proficiency, ranked #27 of 112 in ME (top 24%) — strong family-tenant draw, lease renewals of 3-5y typical.
- Market conditions: 18 active listings in the ZIP; 460 units permitted in Kennebec County in 2024 (0 in 5+ unit buildings).
Forward outlook
- Local home prices are declining (-3.0%/yr); year-one equity from $1k of loan paydown is wiped out by about $6k of value loss. Plan a longer hold.
- Kennebec County population projected at -17% by 2050 — secular population decline; favor cash flow + early exit over multi-decade hold.
Negotiation context
- It's been on market 34 days — a 3% lower offer ($194k) is reasonable based on typical stale-listing flexibility.
- 3 sale attempts since 24y ago with the ask held roughly flat each time — persistent listings suggest the price (not the market) is what's stuck; bring a comps-based counter.
Risks & watch-outs
- Watch-outs: built in 1840 — expect roof / HVAC / electrical / plumbing capex.
Questions for the listing agent
- What do current leases actually rent for vs. the listed asking? Can we see a recent rent roll and the last 12 months of T-12 income?
- It's been on market 34 days. Have you received any prior offers? Is the seller open to a 33% concession, seller financing, or rate buy-down credit?
- Built in 1840 — when were the roof, HVAC, electrical panel, plumbing, and water heater last replaced?
- Is there a deadline driving the sale (1031 exchange, divorce, estate, relocation)? That informs how much negotiation room exists.
- The area grade is low — what's the realistic commute time and amenity access for the typical tenant pool here? Any planned neighborhood developments (good or bad) we should know about?
- What's the average days-on-market for RENTAL listings here right now (not sales)? A rising rental-DOM trend means longer vacancies and softer asking-rent achievability than the comps imply.
- What's the recent tenant-quality profile in this submarket — average credit score on applications, eviction rate, late-payment / NSF rate, and stable-employment percentage? A property-management company in the area should have these aggregated.
- How much new for-sale + rental construction is in the pipeline within 1–3 miles? Heavy new supply typically softens prices + rents 12–24 months out; constrained supply supports both.
Investment metrics
- 1% rule
- 0.67% ✗
- Cap rate
- 4.72%
- Cash-on-cash
- -5.61%
- DSCR
- 0.75
- GRM
- 12.5
CMA / ARV
- ARV (median comp)
- $370,341
- List price
- $199,900
- Delta
- -46.02%
- Verdict
- UNDERPRICED
- Comps
- 6 within 2.0 mi
Projected returns pro-forma
-3.0% appreciation · 3.0% rent growth · sell at horizon
- IRR
- -25.9%
- Equity multiple
- 0.12×
- Total profit
- $-49,084
- Equity at exit
- $29,806
- IRR
- -22.7%
- Equity multiple
- -0.15×
- Total profit
- $-64,293
- Equity at exit
- $17,284
Cash invested: $55,972 (down + closing). Projections, not guarantees.
Landlord ↔ Tenant lean methodology
- Overall (STATE)
- 41 Moderately Tenant-Leaning
- State Maine
- 41 Moderately Tenant-Leaning · D+2
- County
- — inherits STATE
- City
- — inherits STATE
ZIP-level market 04352
- Home prices YoY
- -0.8%
- Active inventory
- 18
- Price-to-rent
- 12.5×
Monthly cashflow live
- Estimated rent
- $1,333 medium interval (Pro) →
- Mortgage (P&I)
- −$1,048
- Tax from tax record
- −$183 /mo · $2,197/yr
- Insurance
- −$83
- HOA
- −$0
- Vacancy / Maint / Mgmt
- −$280
- Net cashflow
- $-262
Break-even live
UW: 25.0% down · 7.5% · 30yr · 1.5% tax · 5.0% vac · 8.0% maint · 8.0% mgmt
Financing live
Cash to close
- Down payment
- $49,975
- Closing costs
- $5,997
- Reserves months
- —
- Total cash needed
- —
Loan-product check · same deal, 3 products live
Conventional
25% down · 7.5% · 30yr
- Down + closing
- —
- Monthly P&I
- —
- Monthly cashflow
- —
- DSCR
- —
- Eligible?
- —
Personal DTI + credit; lowest rate.
DSCR
20% down · 8.5% · 30yr
- Down + closing
- —
- Monthly P&I
- —
- Monthly cashflow
- —
- DSCR
- —
- Eligible?
- —
No personal income docs; deal must DSCR.
Hard money
10% down · 12.0% · 12mo
- Down + closing
- —
- Monthly P&I
- —
- Monthly cashflow
- —
- DSCR
- —
- Eligible?
- —
Short-term bridge; refi at stabilization.
Listing history 9 events
-
2026-06-12statusdays on market $199,900 Pending 34 DOM
-
2026-06-09days on market $199,900 Active 33 DOM
-
2026-06-08days on market $199,900 Active 32 DOM
-
2026-06-07days on market $199,900 Active 31 DOM
-
2026-06-02days on market $199,900 Active 26 DOM
-
2026-06-01days on market $199,900 Active 25 DOM
-
2026-05-31days on market $199,900 Active 24 DOM
-
2026-05-30days on market $199,900 Active 23 DOM
-
2026-05-07$199,900 Active 669-char remark
ⓘ Source: listings_history table (triggers on properties + properties_extension) + one-shot
backfill from property_details.listing_events for pre-trigger history.
Tax reassessment forecast ME · Partial reset (capped growth)
- Current annual tax
- $2,197 · $183/mo
- Projected year-2 tax
- $2,458 · $205/mo
- Expected delta
- +$261/yr (+$22/mo · 11.9%)
ⓘ Screening estimate from a state-policy table — verify with the county assessor before closing.
Nearby sold comps map
Loading sold comps map…
Walkable amenities ~0.75 mi
Loading nearby amenities…
Taxation est. · year 1
- Rental income
- $15,994
- − Mortgage interest
- −$11,198
- − Property taxes
- −$2,197
- − Insurance
- −$1,000
- − Repairs & maintenance
- −$1,280
- − Management
- −$1,280
- − Depreciation
- −$5,815
- Taxable loss
- −$6,774
- Est. tax savings @ 24.0%
- +$1,626
- After-tax cash flow
- $-1,515/yr
For passive investors: Depreciation is non-cash, so a rental often shows a tax loss while cash-flowing — sheltering income. Rental losses are passive: they offset passive income freely, and up to $25,000/yr can offset ordinary (W-2) income if you actively participate and your MAGI is under $100k (phasing out to $0 by $150k); unused losses carry forward. On sale, claimed depreciation is recaptured at up to 25%, and gains may owe capital-gains tax (a 1031 exchange can defer both). Figures are a year-1 estimate at your 24.0% rate — not tax advice; consult a CPA.
Schools (NCES district)
- District
- RSU 38
- NCES district ID
- 2314788
- Math proficiency
- 89% ▲ 54.00%
- Reading proficiency
- 89% ▲ 29.00%
- Median HH income
- $63,163
- Composite
- 76.39/100
- National rank
- #107
- State rank
- #27 of 112 in ME
Livability — Winthrop
- Score
- 69/100
- State rank
- #76
- US rank
- #8395
Category grades
Schools grade is shown separately in the Schools card above.
Census & demographics
- City population
- 6,153
- Population (ZIP)
- 1,728
Population outlook (Kennebec County) Hauer SSP2
- Today (2025)
- 115,421 people
- By 2030
- 111,852 · -3.1%
- By 2040
- 103,757 · -10.1%
- By 2050
- 95,710 · -17.1%
- By 2075
- 78,172 · -32.3%
- By 2100
- 59,500 · -48.4%
Race, ethnicity, and origin ACS 2023
- Neighborhood character
- Predominantly White (92%)
- Race & ethnicity
- White 92% Two or more races 5% Hispanic / Latino 4%
- Common ancestry
- Lithuanian 15% Slovak 4% Serbian 2%
- Foreign-born
- 1%
- Languages at home
- 98% English-only · German/W. Germanic 1% French/Haitian/Cajun 1%
Political lean MEDSL · Kennebec
- 2024 margin
- Toss-up / Even · D 47.5% · R 50.2% · Other 2.4%
- 2008→2024 swing
- -17.5pp toward R · 2008: 14.8pp · 2024: -2.8pp
- All cycles
- 2024: R+2.8 2020: D+0.2 2016: R+3.7 2012: D+13.5 2008: D+14.8
Not yet ingested
- Civics
- —
Market trends
- HPI YoY
- ▼ -3.14%
- Current HPI
- 406.9047
- Rent YoY
- —
- Metro
- —
- State GDP YoY
- —
- F500 in state
- 0
Price history
+122.4% since first listed6 events — show timeline
- 2026-06-10 Pending — MREIS
- 2026-05-07 Listed $199,900 MREIS
- 2025-10-20 Delisted — MREIS
- 2025-08-23 Contingent — MREIS
- 2025-08-15 Listed $199,900 MREIS
- 2002-03-29 Listed $89,900 MREIS
Property tax history
+4.3%/yrLatest (2024): $2,197 · +10.6% YoY. Source: county tax records.
Cash-flow waterfall
monthlySold comps — $/sqft
last 12 mo · ≤1 miLoading sold comps…