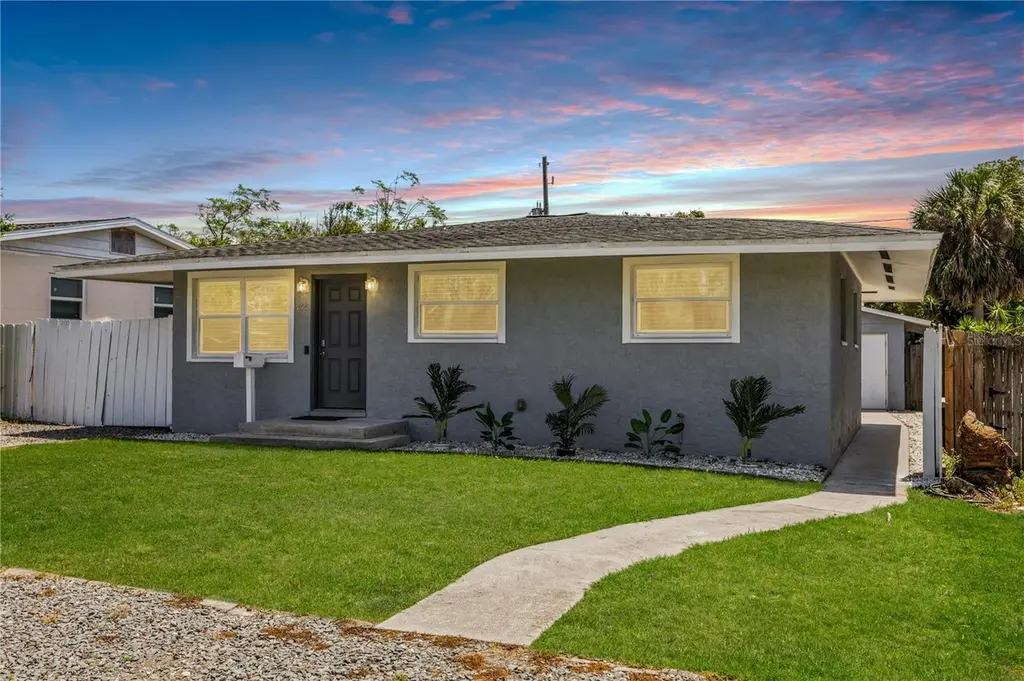
159 Holland Rd · Ormond-by-the-Sea, FL
Flood risk 5/10 · Moderate
- FEMA flood zone
- X (unshaded)
- Chance of flooding over 30 yrs
- 0.51%
- Est. flood insurance / yr
- $507 – $1,088
Fire risk 1/10 · Minimal
- Est. fire insurance / yr
- $947 – $1,759
Heat risk 10/10 · Severe
- Hot days now (above 105°F)
- 7 days/yr
- Hot days in 30 yrs
- 21 days/yr
Wind risk 10/10 · Severe
- Chance of severe wind over 30 yrs
- 99.0%
Air-quality risk 3/10 · Minor
- Unhealthy air days now
- 3 days/yr
- Unhealthy air days in 30 yrs
- 3 days/yr
Risk factors via First Street. Map © Google.
Why this score? — see what drove the F grade
The composite is a weighted blend of 9 inputs, each scored 0–100. Each bar is that input's sub-score; the figure is the points it added to the 100-point composite (weight × sub-score).
- ARV discount +7.5/15.0
- Cash flow +4.9/30.0
- Schools +3.9/10.0
- Rent growth +3.8/5.0
- Livability +2.5/5.0
- Condition / age +2.5/5.0
- 1% rule +0.2/10.0
- DSCR +0.0/10.0
- Appreciation +0.0/10.0
$429,900
🖨 Deal sheet 📄 Offer letter ✓ Due diligence
Listing remarks
Welcome to 159 Holland Rd, a ONE-OF-A-KIND property situated in the heart of Ormond-by-the-Sea, just one block from the beach, an opportunity like this doesn’t come along twice! This Unique property offers not only a Completely Updated 3 bedroom, 2 bath home (1,137 sq ft), but also an ADDITIONAL Permitted Private Fully Equipped Detached Guest Bungalow (630 sq ft), PERFECT for Multigenerational Living, hosting extended family, or simply enjoying extra space just steps from the Atlantic. Whether you’re looking for a primary residence, vacation home, or a smart addition to your investment portfolio, this property delivers. The main residence was completely remodeled in 2017/2018 in
Key facts
- Private retreat
- Open courtyard
- Completely updated
Tags
Property features AI
Finance
- Other: Direction faces north
- Financial info: Lease restrictions apply
- HOA & community: No association (HOA) reported; Pets allowed; Development: Holland
Exterior
- Parking: Driveway; Off-street parking; Oversized parking
- Utilities: Public water; Septic tank; Cable connected; Electricity connected; Water connected
- Home design: Single-family residence; One story; Property faces north; Additional single-family home and guest house on property
- Construction: Block and stucco construction; Shingle roof; Crawlspace and slab foundation; Built as one-level
- Exterior features: Patio; Rear porch; French doors; Outdoor grill; Wood fencing; Mature landscaping; Landscaped and paved lot; In-county location
Interior
- Kitchen: Dishwasher; Disposal; Microwave; Range; Refrigerator; Solid surface counters
- Bedrooms: 4 bedrooms
- Flooring: Tile
- Bathrooms: 3 full bathrooms
- Heating & cooling: Central heating (electric); Central air conditioning
- Interior features: Ceiling fans; Kitchen/family room combo; Living room/dining room combo; Solid surface counters; Blinds; Double-pane windows; ENERGY STAR qualified windows
- Laundry & utility: Inside laundry; Washer; Dryer; Electric water heater; Inside utility/family room
Neighborhood map
What this means for you Summary
Snapshot
- This is a 3-bed/1.0-bath single-family listed at $430k.
Deal economics
- At list price, monthly cash flow is $-1k ($-12k/yr) — negative.
- To cash-flow at today's rent, offer at most $249k (42.1% below list).
- To meet the 1% rule (rent ≥ 1% of price), the offer needs to be $225k (47.7% below list).
- Recommended offer: $225k (47.7% below list) — sets the bar for 1% rule.
Location & tenants
- Location reads: area grade F — affects rentability + tenant quality, not the cash-flow math above.
- Volusia (suburban): math 44% / reading 49% proficiency, ranked #47 of 73 in FL (top 64%) — families likely to look elsewhere, expect single-tenant / working-renter base with shorter leases.
- Zoned schools: Beachside Elementary School (math 57% / reading 52%, grade C, #892 of 2,144 statewide, top 44%, 556 students, 66% FRL); Seabreeze High School (math 31% / reading 56%, grade F, #248 of 667 statewide, top 38%, 1,654 students, 41% FRL) — zoned schools at 53% FRL track the district average.
- Market conditions: Rents rising fast (+5.2%/yr); 406 active listings in the ZIP; 25 comparable units currently listed for rent nearby; rentals at typical pace (median 24d on market — plan ~3-4 weeks tenant-placement turnaround); solid renter incomes; 3,402 units permitted in Volusia County in 2024 (681 in 5+ unit buildings).
- This rent runs 34% of the median local income ($78k/yr) — at the standard rent-burdened threshold; future hikes will face affordability resistance.
Forward outlook
- Local home prices are declining (-3.0%/yr); year-one equity from $3k of loan paydown is wiped out by about $13k of value loss. Plan a longer hold.
- Volusia County population projected at +19% by 2050 — long-run rental-demand tailwind backs the buy-and-hold thesis.
Negotiation context
- It's been on market 42 days — a 3% lower offer ($417k) is reasonable based on typical stale-listing flexibility.
- 7 sale attempts since 18y ago with the ask held roughly flat each time — persistent listings suggest the price (not the market) is what's stuck; bring a comps-based counter.
- Current owner paid $88k; list at $430k implies a 389% gain — meaningful room to come down on a strong offer.
Risks & watch-outs
- Climate carrying-cost: moderate flood risk; severe wind risk, 99% chance of damaging wind over 30y; extreme-heat days projected 7→21/yr by 2055 (HVAC capex compounding) — expect insurance premiums to compound above CPI over the hold.
Questions for the listing agent
- What do current leases actually rent for vs. the listed asking? Can we see a recent rent roll and the last 12 months of T-12 income?
- It's been on market 42 days. Have you received any prior offers? Is the seller open to a 48% concession, seller financing, or rate buy-down credit?
- Built in 1965 — when were the roof, HVAC, electrical panel, plumbing, and water heater last replaced?
- Is there a deadline driving the sale (1031 exchange, divorce, estate, relocation)? That informs how much negotiation room exists.
- The area grade is low — what's the realistic commute time and amenity access for the typical tenant pool here? Any planned neighborhood developments (good or bad) we should know about?
- What's the average days-on-market for RENTAL listings here right now (not sales)? A rising rental-DOM trend means longer vacancies and softer asking-rent achievability than the comps imply.
- What's the recent tenant-quality profile in this submarket — average credit score on applications, eviction rate, late-payment / NSF rate, and stable-employment percentage? A property-management company in the area should have these aggregated.
- How much new for-sale + rental construction is in the pipeline within 1–3 miles? Heavy new supply typically softens prices + rents 12–24 months out; constrained supply supports both.
Investment metrics
- 1% rule
- 0.52% ✗
- Cap rate
- 3.44%
- Cash-on-cash
- -10.20%
- DSCR
- 0.55
- GRM
- 15.9
CMA / ARV
No comps found within radius.
Projected returns pro-forma
-3.0% appreciation · 5.22% rent growth · sell at horizon
- IRR
- -32.5%
- Equity multiple
- -0.08×
- Total profit
- $-129,795
- Equity at exit
- $64,099
- IRR
- -29.3%
- Equity multiple
- -0.46×
- Total profit
- $-175,217
- Equity at exit
- $37,170
Cash invested: $120,372 (down + closing). Projections, not guarantees.
Landlord ↔ Tenant lean methodology
- Overall (STATE)
- 87 Strongly Landlord-Friendly
- State Florida
- 87 Strongly Landlord-Friendly · R+3
- County
- — inherits STATE
- City
- — inherits STATE
ZIP-level market 32176
- Rents YoY
- 5.2%
- Active inventory
- 406
- Price-to-rent
- 15.9×
Monthly cashflow live
- Estimated rent
- $2,248 high interval (Pro) →
- Mortgage (P&I)
- −$2,254
- Tax from tax record
- −$366 /mo · $4,396/yr
- Insurance
- −$179
- HOA
- −$0
- Vacancy / Maint / Mgmt
- −$472
- Net cashflow
- $-1,024
Break-even live
UW: 25.0% down · 7.5% · 30yr · 1.5% tax · 5.0% vac · 8.0% maint · 8.0% mgmt
Financing live
Cash to close
- Down payment
- $107,475
- Closing costs
- $12,897
- Reserves months
- —
- Total cash needed
- —
Loan-product check · same deal, 3 products live
Conventional
25% down · 7.5% · 30yr
- Down + closing
- —
- Monthly P&I
- —
- Monthly cashflow
- —
- DSCR
- —
- Eligible?
- —
Personal DTI + credit; lowest rate.
DSCR
20% down · 8.5% · 30yr
- Down + closing
- —
- Monthly P&I
- —
- Monthly cashflow
- —
- DSCR
- —
- Eligible?
- —
No personal income docs; deal must DSCR.
Hard money
10% down · 12.0% · 12mo
- Down + closing
- —
- Monthly P&I
- —
- Monthly cashflow
- —
- DSCR
- —
- Eligible?
- —
Short-term bridge; refi at stabilization.
Rent comps 25 comps
| Address | Beds | Baths | Sqft | Rent | $/sqft | DOM | Units | Dist |
|---|---|---|---|---|---|---|---|---|
| 56 Seabreeze Dr Ormond Beach, FL | 2.0 | 1.0 | 1050 | $1,850 | $1.76 | 23d | 1 | 0.09mi |
| 49 Rivocean Dr Ormond Beach, FL | 2.0 | 1.0 | 1120 | $1,900 | $1.70 | 23d | 1 | 0.16mi |
| 58 Carol Rd Ormond Beach, FL | 2.0 | 1.0 | 960 | $2,200 | $2.29 | 23d | 1 | 0.25mi |
| 56 Margaret Rd Unit A Ormond Beach, FL | 2.0 | 1.0 | 900 | $1,600 | $1.78 | 23d | 1 | 0.29mi |
| 62 River Shore Dr Ormond Beach, FL | 2.0 | 1.0 | 882 | $2,650 | $3.00 | 23d | 1 | 0.36mi |
| 1633 John Anderson Dr Ormond Beach, FL | 2.0 | 1.0 | 1356 | $2,250 | $1.66 | 23d | 1 | 0.37mi |
| 27 Ocean Shore Dr Ormond Beach, FL | 2.0 | 1.0 | 956 | $1,760 | $1.84 | 23d | 1 | 0.42mi |
| 1926 Ocean Shore Blvd Apt 111 Ormond Beach, FL | 2.0 | 2.0 | 1175 | $1,775 | $1.51 | 23d | 1 | 0.45mi |
| 43 Seaview Dr Ormond Beach, FL | 2.0 | 1.0 | 1001 | $1,995 | $1.99 | 19d | 1 | 0.47mi |
| 2006 Ocean Shore Blvd #16 Ormond Beach, FL | 2.0 | 2.0 | 1080 | $1,895 | $1.75 | 19d | 1 | 0.48mi |
| 1510 Ocean Shore Blvd #4020 Ormond Beach, FL | 2.0 | 1.0 | 891 | $1,650 | $1.85 | 23d | 1 | 0.58mi |
| 1510 Ocean Shore Blvd #3120 Ormond Beach, FL | 2.0 | 1.0 | 891 | $1,000 | $1.12 | 19d | 1 | 0.58mi |
| 1513 Ocean Shore Blvd Unit C2 Ormond Beach, FL | 2.0 | 2.0 | 1484 | $3,100 | $2.09 | 23d | 1 | 0.61mi |
| 1415 Ocean Shore Blvd Ormond Beach, FL | 1.0–2.0 | 1.0–2.0 | 1031 | $2,500 | $2.42 | 14d | 1 | 0.80mi |
| 23 Hibiscus Dr Ormond Beach, FL | 2.0 | 1.5 | 1350 | $1,795 | $1.33 | 23d | 1 | 0.86mi |
| 157 Longwood Dr Unit 1545681P Ormond Beach, FL | 2.0 | 2.0 | 1280 | $4,032 | $3.15 | 14d | 1 | 0.87mi |
| 23 Ocean Breeze Cir Ormond Beach, FL | 2.0 | 2.0 | 991 | $1,800 | $1.82 | 23d | 1 | 0.93mi |
| 125 Lynnhurst Dr Ormond Beach, FL | 2.0 | 2.0 | 990 | $2,800 | $2.83 | 23d | 1 | 1.00mi |
| 10 Lynnhurst Dr Ormond Beach, FL | 2.0 | 1.5 | 1000 | $1,750 | $1.75 | 23d | 1 | 1.12mi |
| 8 Tropical Dr Unit 1546317P Ormond Beach, FL | 2.0 | 1.0 | 1248 | $3,902 | $3.13 | 14d | 1 | 1.20mi |
| 70 Brooks Dr Ormond Beach, FL | 3.0 | 2.0 | 1204 | $2,195 | $1.82 | 21d | 1 | 1.21mi |
| 60 River Dr Ormond Beach, FL | 2.0 | 2.0 | 700 | $1,900 | $2.71 | 19d | 1 | 1.28mi |
| 1133 Ocean Shore Blvd #702 Ormond Beach, FL | 2.0 | 2.0 | 1065 | $3,250 | $3.05 | 23d | 1 | 1.32mi |
| 2470 Ocean Shore Blvd Unit 1545901P Ormond Beach, FL | 2.0 | 2.0 | 968 | $2,581 | $2.67 | 14d | 1 | 1.34mi |
| 3 River Dr Ormond Beach, FL | 2.0 | 1.0 | 888 | $1,900 | $2.14 | 23d | 1 | 1.38mi |
Listing history 26 events
-
2026-06-18days on market $429,900 Active 42 DOM
-
2026-06-17days on market $429,900 Active 41 DOM
-
2026-06-16days on market $429,900 Active 40 DOM
-
2026-06-15days on market $429,900 Active 39 DOM
-
2026-06-14pricedays on market $429,900 Active 37 DOM
-
2026-06-10days on market $439,900 Active 34 DOM
-
2026-06-09days on market $439,900 Active 33 DOM
-
2026-06-08days on market $439,900 Active 32 DOM
-
2026-06-07days on market $439,900 Active 31 DOM
-
2026-06-05days on market $439,900 Active 28 DOM
-
2026-06-03days on market $439,900 Active 27 DOM
-
2026-06-03days on market $439,900 Active 26 DOM
-
2026-06-01days on market $439,900 Active 25 DOM
-
2026-05-31days on market $439,900 Active 24 DOM
-
2026-05-31days on market $439,900 Active 23 DOM
-
2026-05-07$439,900 Active 2493-char remark
-
2024-01-11historical $2,200
-
2023-11-18$2,200
-
2014-02-23$1,250
-
2014-02-23$1,250
-
2009-02-26soldstatus $88,000
-
2009-01-02$95,000
-
2008-03-24$122,500
-
1997-04-22soldstatus $58,000
-
1997-04-22soldstatus $58,000
-
1997-04-22soldstatus $58,000
ⓘ Source: listings_history table (triggers on properties + properties_extension) + one-shot
backfill from property_details.listing_events for pre-trigger history.
Tax reassessment forecast FL · Resets to sale price
- Current annual tax
- $4,396 · $366/mo
- Projected year-2 tax
- $4,396 · $366/mo
- Expected delta
- $0/yr ($0/mo · 0.0%)
ⓘ Screening estimate from a state-policy table — verify with the county assessor before closing.
Climate risk First Street
- Flood 5/10 Major FEMA zone X (unshaded) · 51% chance over 30 yrs
- Wildfire 1/10 Low
- Heat 10/10 Extreme 7 d/yr ≥105°F today · 21 d/yr by 30 yrs out
- Wind 10/10 Extreme 99% chance of damaging wind over 30 yrs
- Air quality 3/10 Moderate 3 unhealthy d/yr today · 3 by 30 yrs out
Nearby sold comps map
Loading sold comps map…
Walkable amenities ~0.75 mi
Loading nearby amenities…
Taxation est. · year 1
- Rental income
- $26,982
- − Mortgage interest
- −$24,081
- − Property taxes
- −$4,396
- − Insurance
- −$2,150
- − Repairs & maintenance
- −$2,159
- − Management
- −$2,159
- − Depreciation
- −$12,506
- Taxable loss
- −$20,468
- Est. tax savings @ 24.0%
- +$4,912
- After-tax cash flow
- $-7,371/yr
For passive investors: Depreciation is non-cash, so a rental often shows a tax loss while cash-flowing — sheltering income. Rental losses are passive: they offset passive income freely, and up to $25,000/yr can offset ordinary (W-2) income if you actively participate and your MAGI is under $100k (phasing out to $0 by $150k); unused losses carry forward. On sale, claimed depreciation is recaptured at up to 25%, and gains may owe capital-gains tax (a 1031 exchange can defer both). Figures are a year-1 estimate at your 24.0% rate — not tax advice; consult a CPA.
Schools (NCES district)
- District
- Volusia
- NCES district ID
- 1201920
- Math proficiency
- 44% ▼ -9.00%
- Reading proficiency
- 49% ▼ -3.00%
- Median HH income
- $42,946
- Composite
- 39.2/100
- National rank
- #4019
- State rank
- #47 of 73 in FL
Livability — Ormond-by-the-Sea
No livability data for this city. (Only ~50 U.S. cities are tracked.)
Census & demographics
- Census place
- Ormond-by-the-Sea, FL
- County
- Volusia County · 556,871 people
- City population
- 14,344
- Metro
- Deltona-Daytona Beach-Ormond Beach, FL
- Population (ZIP)
- 14,841
- Household income
- $78,410
- Rent vs Own
- Severe rent burden
- 298.0
Population outlook (Volusia County) Hauer SSP2
- Today (2025)
- 572,749 people
- By 2030
- 598,695 · +4.5%
- By 2040
- 644,880 · +12.6%
- By 2050
- 681,451 · +19.0%
- By 2075
- 759,957 · +32.7%
- By 2100
- 778,902 · +36.0%
Race, ethnicity, and origin ACS 2023
- Neighborhood character
- Predominantly White (88%)
- Race & ethnicity
- White 88% Two or more races 5% Hispanic / Latino 5% Black 2% Asian 2%
- Common ancestry
- Slovak 5% Romanian 4% Lithuanian 3%
- Foreign-born
- 6% · Canada, China
- Languages at home
- 93% English-only · Spanish 2% Other Indo-European 1% Russian/Polish/Slavic 1%
Political lean MEDSL · Volusia
- 2024 margin
- Strong R (+21.8) · D 38.7% · R 60.5%
- 2008→2024 swing
- -27.4pp toward R · 2008: 5.7pp · 2024: -21.8pp
- All cycles
- 2024: R+21.8 2020: R+14.1 2016: R+13.1 2012: R+1.2 2008: D+5.7
Not yet ingested
- Civics
- —
Market trends
- HPI YoY
- ▼ -476.64%
- Current HPI
- 319.6419
- Rent YoY
- ▲ 5.22%
- Metro
- Deltona-Daytona Beach-Ormond Beach, FL
- State GDP YoY
- ▲ 3.28%
- F500 in state
- 36
Industry mix (Fortune 500 HQ in FL)
| Industry | F500 HQs | Revenue |
|---|---|---|
| Industrial Technology | 2 | $29B |
|
||
| Insurance | 2 | $17B |
|
||
| Retail | 1 | $60B |
|
||
| Technology Distribution | 1 | $58B |
|
||
| Homebuilding | 1 | $35B |
|
||
| Technology Manufacturing | 1 | $35B |
|
||
Price history
+641.2% since first listed13 events — show timeline
- 2026-06-11 Price Changed $429,900 Stellar MLS as Distributed by MLS Grid
- 2026-05-07 Listed $439,900 realMLS
- 2026-05-07 Listed $439,900 Stellar MLS as Distributed by MLS Grid
- 2024-01-11 Rental Removed $2,200 DMLS
- 2023-11-18 Listed for Rent $2,200 DMLS
- 2014-02-23 Listed $1,250 Daytona MLS
- 2014-02-23 Listed $1,250 Daytona MLS
- 2009-02-26 Sold (MLS) $88,000 Daytona MLS
- 2009-01-02 Listed $95,000 Daytona MLS
- 2008-03-24 Listed $122,500 Daytona MLS
- 1997-04-22 Sold (Public Records) $58,000 Public Records
- 1997-04-22 Sold (Public Records) $58,000 Public Records
- 1997-04-22 Sold (Public Records) $58,000 Public Records
Property tax history
+7.7%/yrLatest (2025): $4,396 · +1.9% YoY. Source: county tax records.
Cash-flow waterfall
monthlySold comps — $/sqft
last 12 mo · ≤1 miLoading sold comps…