16941 Luke Rd · Fort Garland, CO
Flood risk 1/10 · Minimal
- FEMA flood zone
- —
- Chance of flooding over 30 yrs
- 0.0%
- Est. flood insurance / yr
- —
Fire risk 3/10 · Minor
- Est. fire insurance / yr
- $939 – $1,743
Heat risk 1/10 · Minimal
- Hot days now (above 80°F)
- 9 days/yr
- Hot days in 30 yrs
- 27 days/yr
Wind risk 1/10 · Minimal
- Chance of severe wind over 30 yrs
- —
Air-quality risk 2/10 · Minimal
- Unhealthy air days now
- 1 days/yr
- Unhealthy air days in 30 yrs
- 2 days/yr
Risk factors via First Street. Map © Google.
Why this score? — see what drove the B grade
The composite is a weighted blend of 9 inputs, each scored 0–100. Each bar is that input's sub-score; the figure is the points it added to the 100-point composite (weight × sub-score).
- Cash flow +30.0/30.0
- 1% rule +10.0/10.0
- DSCR +10.0/10.0
- ARV discount +7.5/15.0
- Appreciation +4.4/10.0
- Livability +2.7/5.0
- Rent growth +2.5/5.0
- Condition / age +2.5/5.0
- Schools +2.2/10.0
$29,000
🖨 Deal sheet 📄 Offer letter ✓ Due diligence
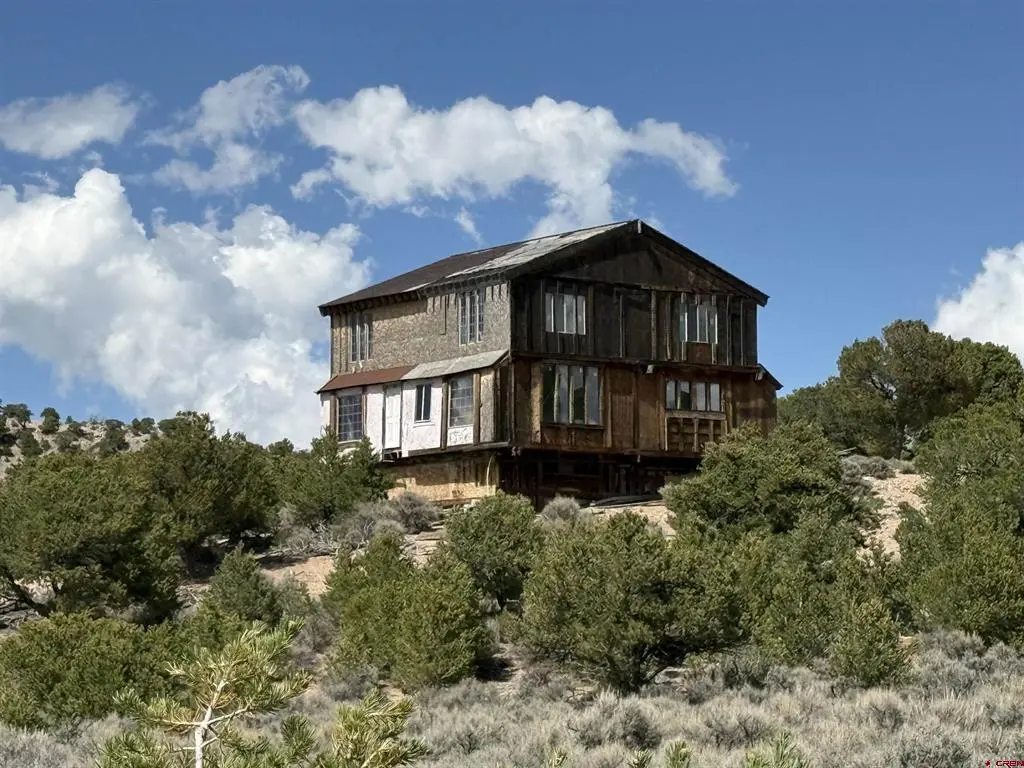
Listing remarks
Discover the potential of this charming home, waiting for your personal touch to transform it into your dream retreat. Nestled in the breathtaking Sangre de Cristo Mountain Range, this property offers easy access to two nearby water recreation areas perfect for fishing and boating, as well as opportunities for hunting, biking, and more. Just a short drive away, you can explore the stunning Great Sand Dunes National Park and Preserve and unwind at the Sand Dunes Hot Springs, making this location ideal for outdoor enthusiasts and nature lovers alike. Embrace the chance to create your perfect sanctuary in this picturesque setting.
Key facts
- Fishing and boating
- Hunting biking
- 5.06 acre lot
Tags
Property features AI
Finance
- Financial info: Pets allowed
Exterior
- Utilities: Residential zoning
- Home design: Single-story; Single-family residential; Entry on main level; Pillar/post/pier foundation
- Construction: Wood siding; Wood frame, stick-built construction; Metal roof; Built on pillar/post/pier foundation
- Exterior features: Deck; Corner lot; Cul-de-sac lot; Wooded lot; Dirt road frontage; County road and cul-de-sac access; Has a view
Interior
- Bathrooms: 1 full bathroom
- Interior features: Vinyl windows; Unfurnished
Neighborhood map
What this means for you Summary
Snapshot
- This is a 1-bed/1.0-bath single-family listed at $29k.
Deal economics
- At list price, monthly cash flow is $505 ($6k/yr) — positive.
- The deal already cash-flows at list — no discount required.
- Meets the 1% rule at list price ($972 rent vs $29k).
- Cap rate 27.2% vs local median 1.7% in Fort Garland — top-decile yield for the area; either an underpriced asset or a hidden risk that comps aren't pricing in. Stress-test before assuming the spread holds.
Location & tenants
- Location reads 54/100 on livability (#364 in CO) — a working-class tenant base; expect higher turnover. Strengths: cost of living A, housing A; Watch: health & safety C-, schools F, crime F.
- Sierra Grande School District No. R-30 (rural): math 20% / reading 25% proficiency, ranked #148 of 176 in CO (top 84%) — low school quality limits family demand, transient renter base, plan for 1-2y turnover; 67% free/reduced lunch — lower-income household profile, screen leases tightly.
- Market conditions: 591 active listings in the ZIP.
Forward outlook
- Local home prices are declining (-1.2%/yr); year-one equity from $200 of loan paydown is wiped out by about $340 of value loss. Plan a longer hold.
- Costilla County population projected to shrink 9% by 2050 — rents likely to lag national; underwrite the cash flow, not the appreciation.
- At projected returns (-1.2% appreciation + 3.0% rent growth), your $8k cash investment doubles in ~2 years — after that, you're playing with house money.
Negotiation context
- Only 9 days on market — expect competitive offers; lowballing is unlikely to land.
Risks & watch-outs
- Watch-outs: property tax is 4.1% of price.
Questions for the listing agent
- Property tax is high relative to price — has the assessment been appealed recently, and will the sale trigger a re-assessment?
- Is there a deadline driving the sale (1031 exchange, divorce, estate, relocation)? That informs how much negotiation room exists.
- Schools are F-rated, which usually means shorter tenancies and higher turnover. Who's the typical renter profile here, and what's been the actual vacancy rate?
- Crime grade is F in this area — have there been break-ins, vandalism, or insurance claims at this property in the last 3 years? What carrier currently insures it and at what premium?
- What's the average days-on-market for RENTAL listings here right now (not sales)? A rising rental-DOM trend means longer vacancies and softer asking-rent achievability than the comps imply.
- What's the recent tenant-quality profile in this submarket — average credit score on applications, eviction rate, late-payment / NSF rate, and stable-employment percentage? A property-management company in the area should have these aggregated.
- How much new for-sale + rental construction is in the pipeline within 1–3 miles? Heavy new supply typically softens prices + rents 12–24 months out; constrained supply supports both.
Investment metrics
- 1% rule
- 3.35% ✓
- Cap rate
- 27.19%
- Cash-on-cash
- 74.62%
- DSCR
- 4.32
- GRM
- 2.5
CMA / ARV
No comps found within radius.
Projected returns pro-forma
-1.17% appreciation · 3.0% rent growth · sell at horizon
- IRR
- 75.9%
- Equity multiple
- 4.67×
- Total profit
- $29,804
- Equity at exit
- $6,762
- IRR
- 78.4%
- Equity multiple
- 9.59×
- Total profit
- $69,711
- Equity at exit
- $6,900
Cash invested: $8,120 (down + closing). Projections, not guarantees.
Landlord ↔ Tenant lean methodology
- Overall (STATE)
- 38 Tenant-Leaning
- State Colorado
- 38 Tenant-Leaning · D+4
- County
- — inherits STATE
- City
- — inherits STATE
ZIP-level market 81133
- Home prices YoY
- -0.7%
- Active inventory
- 591
- Price-to-rent
- 2.5×
Monthly cashflow live
- Estimated rent
- $972 medium interval (Pro) →
- Mortgage (P&I)
- −$152
- Tax from tax record
- −$98 /mo · $1,181/yr
- Insurance
- −$12
- HOA
- −$0
- Vacancy / Maint / Mgmt
- −$204
- Net cashflow
- $505
Break-even live
UW: 25.0% down · 7.5% · 30yr · 1.5% tax · 5.0% vac · 8.0% maint · 8.0% mgmt
Financing live
Cash to close
- Down payment
- $7,250
- Closing costs
- $870
- Reserves months
- —
- Total cash needed
- —
Loan-product check · same deal, 3 products live
Conventional
25% down · 7.5% · 30yr
- Down + closing
- —
- Monthly P&I
- —
- Monthly cashflow
- —
- DSCR
- —
- Eligible?
- —
Personal DTI + credit; lowest rate.
DSCR
20% down · 8.5% · 30yr
- Down + closing
- —
- Monthly P&I
- —
- Monthly cashflow
- —
- DSCR
- —
- Eligible?
- —
No personal income docs; deal must DSCR.
Hard money
10% down · 12.0% · 12mo
- Down + closing
- —
- Monthly P&I
- —
- Monthly cashflow
- —
- DSCR
- —
- Eligible?
- —
Short-term bridge; refi at stabilization.
Listing history 8 events
-
2026-06-10days on market $29,000 Active 9 DOM
-
2026-06-09days on market $29,000 Active 8 DOM
-
2026-06-08days on market $29,000 Active 7 DOM
-
2026-06-07days on market $29,000 Active 6 DOM
-
2026-06-05days on market $29,000 Active 3 DOM
-
2026-06-03days on market $29,000 Active 2 DOM
-
2026-06-02remarks 635-char remark
-
2026-06-02$29,000 Active 1 DOM
ⓘ Source: listings_history table (triggers on properties + properties_extension) + one-shot
backfill from property_details.listing_events for pre-trigger history.
Tax reassessment forecast CO · Resets to sale price
- Current annual tax
- $1,181 · $98/mo
- Projected year-2 tax
- $1,181 · $98/mo
- Expected delta
- $0/yr ($0/mo · 0.0%)
ⓘ Screening estimate from a state-policy table — verify with the county assessor before closing.
Climate risk First Street
- Flood 1/10 Low 0% chance over 30 yrs
- Wildfire 3/10 Moderate
- Heat 1/10 Low 9 d/yr ≥80°F today · 27 d/yr by 30 yrs out
- Wind 1/10 Low
- Air quality 2/10 Low 1 unhealthy d/yr today · 2 by 30 yrs out
Nearby sold comps map
Loading sold comps map…
Walkable amenities ~0.75 mi
Loading nearby amenities…
Taxation est. · year 1
- Rental income
- $11,658
- − Mortgage interest
- −$1,624
- − Property taxes
- −$1,181
- − Insurance
- −$145
- − Repairs & maintenance
- −$933
- − Management
- −$933
- − Depreciation
- −$844
- Taxable income
- $5,999
- Est. tax owed @ 24.0%
- −$1,440
- After-tax cash flow
- $4,619/yr
For passive investors: Depreciation is non-cash, so a rental often shows a tax loss while cash-flowing — sheltering income. Rental losses are passive: they offset passive income freely, and up to $25,000/yr can offset ordinary (W-2) income if you actively participate and your MAGI is under $100k (phasing out to $0 by $150k); unused losses carry forward. On sale, claimed depreciation is recaptured at up to 25%, and gains may owe capital-gains tax (a 1031 exchange can defer both). Figures are a year-1 estimate at your 24.0% rate — not tax advice; consult a CPA.
Schools (NCES district)
- District
- Sierra Grande School District No. R-30
- NCES district ID
- 0804140
- Math proficiency
- 20% ▲ 10.00%
- Reading proficiency
- 25% ▲ 10.00%
- Median HH income
- $34,865
- Composite
- 21.67/100
- National rank
- #13595
- State rank
- #148 of 176 in CO
Livability — Fort Garland
- Score
- 54/100
- State rank
- #364
- US rank
- #24220
Category grades
Schools grade is shown separately in the Schools card above.
Census & demographics
- Population (ZIP)
- 1,056
Population outlook (Costilla County) Hauer SSP2
- Today (2025)
- 3,560 people
- By 2030
- 3,524 · -1.0%
- By 2040
- 3,393 · -4.7%
- By 2050
- 3,226 · -9.4%
- By 2075
- 3,027 · -15.0%
- By 2100
- 2,637 · -25.9%
Race, ethnicity, and origin ACS 2023
- Neighborhood character
- Diverse neighborhood (Simpson 0.56)
- Race & ethnicity
- White 54% Hispanic / Latino 38% Two or more races 26% Black 4%
- Hispanic origin (detail)
- Mexican 29%
- Common ancestry
- Russian 8% Serbian 7% Italian 6%
- Foreign-born
- 5% · Canada
- Languages at home
- 85% English-only · Spanish 14% German/W. Germanic 1%
Political lean MEDSL · Costilla
- 2024 margin
- D (+14.7) · D 55.5% · R 40.9% · Other 3.6%
- 2008→2024 swing
- -34.2pp toward R · 2008: 48.9pp · 2024: 14.7pp
- All cycles
- 2024: D+14.7 2020: D+27.2 2016: D+29.0 2012: D+48.6 2008: D+48.9
Not yet ingested
- Civics
- —
Market trends
- HPI YoY
- ▼ -1.17%
- Current HPI
- 162.9232
- Rent YoY
- —
- Metro
- —
- State GDP YoY
- ▲ 1.95%
- F500 in state
- 14
Industry mix (Fortune 500 HQ in CO)
| Industry | F500 HQs | Revenue |
|---|---|---|
| Technology Distribution | 1 | $31B |
|
||
| Food / Agriculture | 1 | $18B |
|
||
| Packaging | 1 | $14B |
|
||
| Healthcare | 1 | $13B |
|
||
| Energy | 1 | $10B |
|
||
| Technology | 1 | $4B |
|
||
Price history
1 event — show timeline
- 2026-06-01 Listed $29,000 cren
Property tax history
+20.9%/yrLatest (2025): $1,181 · +1.7% YoY. Source: county tax records.
Cash-flow waterfall
monthlySold comps — $/sqft
last 12 mo · ≤1 miLoading sold comps…