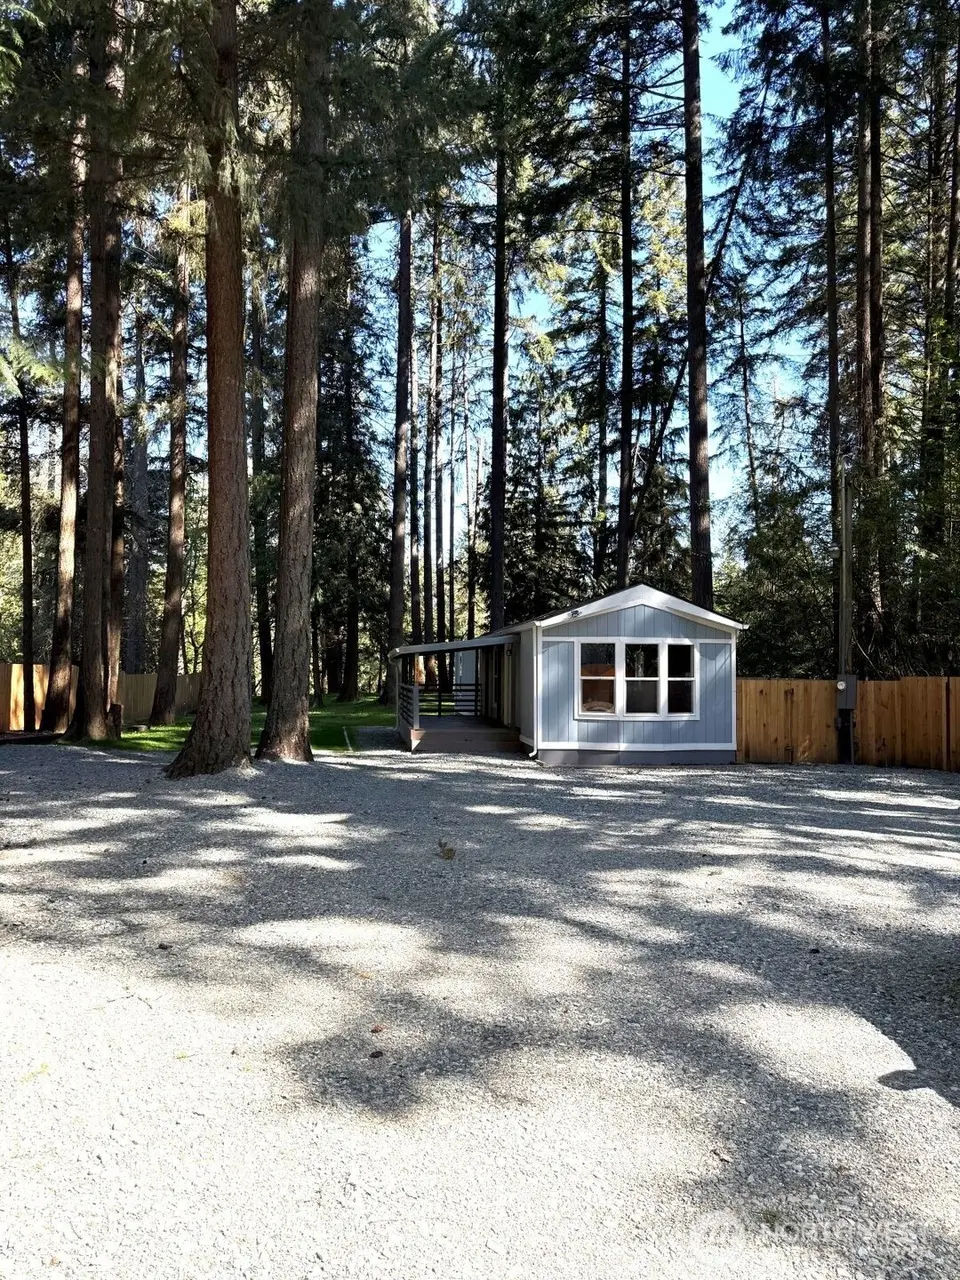
17122 Heather Ln St SE · North Yelm, WA
Flood risk 1/10 · Minimal
- FEMA flood zone
- X (unshaded)
- Chance of flooding over 30 yrs
- 0.0%
- Est. flood insurance / yr
- $507 – $1,088
Fire risk 4/10 · Minor
- Est. fire insurance / yr
- $604 – $1,122
Heat risk 3/10 · Minor
- Hot days now (above 87°F)
- 7 days/yr
- Hot days in 30 yrs
- 13 days/yr
Wind risk 1/10 · Minimal
- Chance of severe wind over 30 yrs
- —
Air-quality risk 6/10 · Moderate
- Unhealthy air days now
- 7 days/yr
- Unhealthy air days in 30 yrs
- 9 days/yr
Risk factors via First Street. Map © Google.
Why this score? — see what drove the F grade
The composite is a weighted blend of 9 inputs, each scored 0–100. Each bar is that input's sub-score; the figure is the points it added to the 100-point composite (weight × sub-score).
- Cash flow +11.5/30.0
- Schools +4.8/10.0
- Rent growth +3.9/5.0
- DSCR +3.4/10.0
- Livability +3.4/5.0
- 1% rule +2.6/10.0
- Condition / age +2.5/5.0
- ARV discount +1.4/15.0
- Appreciation +0.0/10.0
$259,000
🖨 Deal sheet 📄 Offer letter ✓ Due diligence
Listing remarks
Adorable, private and move in ready two bedroom, one bath home in desirable Nisqually Pines Community. Great starter or getaway retreat! This home offers the perfect blend of comfort, style and outdoor living - bright, refreshed and thoughtfully updated. Recent renovations include all new LVP flooring throughout, soft close kitchen cabinets, undermount sink with Moen fixtures, quartz countertop with eating bar, Whirlpool appliances, new roof and fresh interior and exterior paint. Huge new gravel driveway and spacious, private and peaceful lot with multiple gardening areas for anyone who loves to grow, landscape or simply enjoy the outdoors. Lot is partially fenced and backs up to a gree
Key facts
- Quartz countertop
- Undermount sink
- Whirlpool appliances
Tags
Property features AI
Finance
- Other: Level topography; Paved, secluded lot; Approximately 0.28 acre lot
- Financial info: Listing terms: Cash, Conventional, FHA
- HOA & community: HOA fee $98/month (includes water); Association: Nisqually Pines Community Club; Community features: athletic court, clubhouse, park, playground, trails; Community pool
Exterior
- Parking: Off-street parking; Space to park RV; 6 uncovered parking spaces
- Security: Fully fenced
- Utilities: Electric energy source; Community water; Septic tank; Power: PSE
- Home design: Manufactured on land (single wide manufactured home); Updated/remodeled; One level; Main entry; Southeast facing
- Construction: Wood construction; Composition roof; Tie-down foundation; Built by Fleetwood (model 56/14)
- Exterior features: Deck; Fully fenced yard; Patio; RV parking; Garden space; Wood exterior
Interior
- Kitchen: Dishwasher; Refrigerator; Stove/Range
- Bedrooms: 2 bedrooms (both on the main level)
- Flooring: Vinyl plank
- Bathrooms: 1 full bathroom with tub and shower (main level)
- Heating & cooling: Forced air heating; No central cooling
- Interior features: Ceiling fan(s)
- Laundry & utility: Has heating (forced air)
Neighborhood map
What this means for you Summary
Snapshot
- This is a 2-bed/1.0-bath manufactured listed at $259k.
Deal economics
- At list price, monthly cash flow is $-84 ($-1k/yr) — negative.
- To cash-flow at today's rent, offer at most $244k (5.7% below list).
- To meet the 1% rule (rent ≥ 1% of price), the offer needs to be $197k (24.0% below list).
- Recommended offer: $197k (24.0% below list) — sets the bar for 1% rule.
- Cap rate 5.9% vs local median 4.4% in North Yelm — top-decile yield for the area; either an underpriced asset or a hidden risk that comps aren't pricing in. Stress-test before assuming the spread holds.
Location & tenants
- Location reads 68/100 on livability (#277 in WA) — a middle-class / working-renter tenant base. Strengths: housing A+, cost of living A, crime B; Watch: health & safety C-, commute D+, schools F.
- Yelm School District (rural): math 48% / reading 59% proficiency, ranked #108 of 291 in WA (top 37%) — acceptable for families but not a draw, mixed tenant base, ~2y average lease.
- Market conditions: Rents rising fast (+5.8%/yr); 431 active listings in the ZIP; solid renter incomes; 1,222 units permitted in Thurston County in 2024 (508 in 5+ unit buildings).
Forward outlook
- Local home prices are declining (-3.0%/yr); year-one equity from $2k of loan paydown is wiped out by about $8k of value loss. Plan a longer hold.
- Thurston County population projected at +27% by 2050 — long-run rental-demand tailwind backs the buy-and-hold thesis.
Negotiation context
- It's been on market 51 days — a 3% lower offer ($251k) is reasonable based on typical stale-listing flexibility.
- 4 sale attempts since 29y ago; this cycle's ask has dropped $56k (18%) from the opening price — seller is motivated, your offer sets the floor, not the list.
- Current owner paid $130k; list at $259k implies a 99% gain — meaningful room to come down on a strong offer.
Questions for the listing agent
- What do current leases actually rent for vs. the listed asking? Can we see a recent rent roll and the last 12 months of T-12 income?
- It's been on market 51 days. Have you received any prior offers? Is the seller open to a 24% concession, seller financing, or rate buy-down credit?
- What does the HOA fee cover, when was the last increase, and are there any pending special assessments or reserve-fund shortfalls?
- Is there a deadline driving the sale (1031 exchange, divorce, estate, relocation)? That informs how much negotiation room exists.
- Schools are F-rated, which usually means shorter tenancies and higher turnover. Who's the typical renter profile here, and what's been the actual vacancy rate?
- The area grade is low — what's the realistic commute time and amenity access for the typical tenant pool here? Any planned neighborhood developments (good or bad) we should know about?
- What's the average days-on-market for RENTAL listings here right now (not sales)? A rising rental-DOM trend means longer vacancies and softer asking-rent achievability than the comps imply.
- What's the recent tenant-quality profile in this submarket — average credit score on applications, eviction rate, late-payment / NSF rate, and stable-employment percentage? A property-management company in the area should have these aggregated.
- How much new for-sale + rental construction is in the pipeline within 1–3 miles? Heavy new supply typically softens prices + rents 12–24 months out; constrained supply supports both.
Investment metrics
- 1% rule
- 0.76% ✗
- Cap rate
- 5.91%
- Cash-on-cash
- -1.39%
- DSCR
- 0.94
- GRM
- 11.0
CMA / ARV
- ARV (on-the-fly)
- $228,144
- Comps found
- 5
Show comp detail 5 sales within ~0.75 mi
| Address | Dist | Beds/Ba | Sqft | Sold | Price | $/sf | Match |
|---|---|---|---|---|---|---|---|
| 8725 Whitewood Loop SE | 0.48mi | 2/1.0 | 772 (-2%) | 9mo | $225,000 | $291 | 67 |
| 8611 Deodar Ct SE | 0.27mi | 1/1.0 (-1) | 720 (-8%) | 3mo | $157,000 | $218 | 66 |
| 17311 Heather Ln SE | 0.40mi | 2/1.0 | 840 (+7%) | 14mo | $342,000 | $407 | 58 |
| 8737 Whitewood Loop SE | 0.41mi | 2/2.0 | 840 (+7%) | 12mo | $359,000 | $427 | 55 |
| 16826 Bay Ct SE | 0.64mi | 2/1.0 | 716 (-9%) | 10mo | $140,000 | $196 | 47 |
Match score weights: distance 35% · size 25% · config 20% · recency 20%. Top-matched comps best support the ARV.
Projected returns pro-forma
-3.0% appreciation · 5.78% rent growth · sell at horizon
- IRR
- -15.8%
- Equity multiple
- 0.42×
- Total profit
- $-41,705
- Equity at exit
- $38,618
- IRR
- -3.5%
- Equity multiple
- 0.74×
- Total profit
- $-18,851
- Equity at exit
- $22,394
Cash invested: $72,520 (down + closing). Projections, not guarantees.
Landlord ↔ Tenant lean methodology
- Overall (STATE)
- 28 Tenant-Leaning
- State Washington
- 28 Tenant-Leaning · D+8
- County
- — inherits STATE
- City
- — inherits STATE
ZIP-level market 98597
- Rents YoY
- 5.8%
- Active inventory
- 431
- Price-to-rent
- 11.0×
Monthly cashflow live
- Estimated rent
- $1,969 medium interval (Pro) →
- Mortgage (P&I)
- −$1,358
- Tax from tax record
- −$75 /mo · $897/yr
- Insurance
- −$108
- HOA
- −$98
- Vacancy / Maint / Mgmt
- −$413
- Net cashflow
- $-84
Break-even live
UW: 25.0% down · 7.5% · 30yr · 1.5% tax · 5.0% vac · 8.0% maint · 8.0% mgmt
Financing live
Cash to close
- Down payment
- $64,750
- Closing costs
- $7,770
- Reserves months
- —
- Total cash needed
- —
Loan-product check · same deal, 3 products live
Conventional
25% down · 7.5% · 30yr
- Down + closing
- —
- Monthly P&I
- —
- Monthly cashflow
- —
- DSCR
- —
- Eligible?
- —
Personal DTI + credit; lowest rate.
DSCR
20% down · 8.5% · 30yr
- Down + closing
- —
- Monthly P&I
- —
- Monthly cashflow
- —
- DSCR
- —
- Eligible?
- —
No personal income docs; deal must DSCR.
Hard money
10% down · 12.0% · 12mo
- Down + closing
- —
- Monthly P&I
- —
- Monthly cashflow
- —
- DSCR
- —
- Eligible?
- —
Short-term bridge; refi at stabilization.
HOA detail
- Monthly dues
- $98 · $1,176/yr
- Likely covers
- pool
Listing history 29 events
-
2026-06-19price $259,000 Active 51 DOM
-
2026-06-18days on market $279,000 Active 51 DOM
-
2026-06-17days on market $279,000 Active 50 DOM
-
2026-06-16days on market $279,000 Active 49 DOM
-
2026-06-15days on market $279,000 Active 48 DOM
-
2026-06-14days on market $279,000 Active 46 DOM
-
2026-06-13days on market $279,000 Active 45 DOM
-
2026-06-10days on market $279,000 Active 43 DOM
-
2026-06-09days on market $279,000 Active 42 DOM
-
2026-06-08days on market $279,000 Active 41 DOM
-
2026-06-07days on market $279,000 Active 40 DOM
-
2026-06-02days on market $279,000 Active 35 DOM
-
2026-06-01days on market $279,000 Active 34 DOM
-
2026-05-31days on market $279,000 Active 33 DOM
-
2026-05-30days on market $279,000 Active 32 DOM
-
2026-05-15price $279,000
-
2026-05-06price $299,000
-
2026-04-28$315,000 Active
-
2025-06-06soldstatus $130,000
-
2025-04-28soldstatus $85,000
-
2025-04-28$85,000
-
2025-04-28soldstatus $85,000
-
2012-07-05status Pending Inspection
-
2012-07-02soldstatus $34,000 Sold
-
2012-06-25price $36,000
-
2012-05-19$43,000 Active
-
1998-04-28soldstatus $19,000
-
1998-04-28soldstatus $19,000
-
1997-06-18$23,000
ⓘ Source: listings_history table (triggers on properties + properties_extension) + one-shot
backfill from property_details.listing_events for pre-trigger history.
Tax reassessment forecast WA · Resets to sale price
- Current annual tax
- $897 · $75/mo
- Projected year-2 tax
- $2,538 · $212/mo
- Expected delta
- +$1,641/yr (+$137/mo · 183.0%)
ⓘ Screening estimate from a state-policy table — verify with the county assessor before closing.
Climate risk First Street
- Flood 1/10 Low FEMA zone X (unshaded) · 0% chance over 30 yrs
- Wildfire 4/10 Moderate
- Heat 3/10 Moderate 7 d/yr ≥87°F today · 13 d/yr by 30 yrs out
- Wind 1/10 Low
- Air quality 6/10 Major 7 unhealthy d/yr today · 9 by 30 yrs out
Nearby sold comps map
Loading sold comps map…
Walkable amenities ~0.75 mi
Loading nearby amenities…
Taxation est. · year 1
- Rental income
- $23,623
- − Mortgage interest
- −$14,508
- − Property taxes
- −$897
- − Insurance
- −$1,295
- − Repairs & maintenance
- −$1,890
- − Management
- −$1,890
- − HOA
- −$1,176
- − Depreciation
- −$7,535
- Taxable loss
- −$5,567
- Est. tax savings @ 24.0%
- +$1,336
- After-tax cash flow
- $332/yr
For passive investors: Depreciation is non-cash, so a rental often shows a tax loss while cash-flowing — sheltering income. Rental losses are passive: they offset passive income freely, and up to $25,000/yr can offset ordinary (W-2) income if you actively participate and your MAGI is under $100k (phasing out to $0 by $150k); unused losses carry forward. On sale, claimed depreciation is recaptured at up to 25%, and gains may owe capital-gains tax (a 1031 exchange can defer both). Figures are a year-1 estimate at your 24.0% rate — not tax advice; consult a CPA.
Schools (NCES district)
- District
- Yelm School District
- NCES district ID
- 5310140
- Math proficiency
- 48% ▲ 1.00%
- Reading proficiency
- 59% ▲ 1.00%
- Median HH income
- $58,328
- Composite
- 48.34/100
- National rank
- #4685
- State rank
- #108 of 291 in WA
Livability — North Yelm
- Score
- 68/100
- State rank
- #277
- US rank
- #9538
Category grades
Schools grade is shown separately in the Schools card above.
Census & demographics
- Census place
- North Yelm, WA
- County
- Thurston County · 269,345 people
- Metro
- Olympia-Lacey-Tumwater, WA
- Population (ZIP)
- 26,669
- Household income
- $92,219
- Rent vs Own
- Severe rent burden
- 259.0
Population outlook (Thurston County) Hauer SSP2
- Today (2025)
- 308,239 people
- By 2030
- 326,483 · +5.9%
- By 2040
- 359,890 · +16.8%
- By 2050
- 391,800 · +27.1%
- By 2075
- 468,024 · +51.8%
- By 2100
- 519,890 · +68.7%
Race, ethnicity, and origin ACS 2023
- Neighborhood character
- Predominantly White (76%)
- Race & ethnicity
- White 76% Two or more races 10% Hispanic / Latino 10% Black 3% Pacific Islander 2% Asian 2%
- Hispanic origin (detail)
- Mexican 7% Puerto Rican 1%
- Common ancestry
- Portuguese 5% Romanian 4% Lithuanian 3%
- Foreign-born
- 7% · Canada, South Korea
- Languages at home
- 90% English-only · Spanish 6% German/W. Germanic 1% Other Asian/Pacific 1%
Political lean MEDSL · Thurston
- 2024 margin
- Strong D (+20.4) · D 58.5% · R 38.1% · Other 3.5%
- 2008→2024 swing
- -1.3pp toward R · 2008: 21.7pp · 2024: 20.4pp
- All cycles
- 2024: D+20.4 2020: D+18.6 2016: D+15.4 2012: D+19.0 2008: D+21.7
Not yet ingested
- Civics
- —
Market trends
- HPI YoY
- ▼ -192.07%
- Current HPI
- 326.4361
- Rent YoY
- ▲ 5.78%
- Metro
- Olympia-Lacey-Tumwater, WA
- State GDP YoY
- ▲ 4.65%
- F500 in state
- 22
Industry mix (Fortune 500 HQ in WA)
| Industry | F500 HQs | Revenue |
|---|---|---|
| Retail | 2 | $269B |
|
||
| Technology / Retail | 1 | $638B |
|
||
| Technology | 1 | $245B |
|
||
| Telecommunications | 1 | $38B |
|
||
| Food / Beverage | 1 | $36B |
|
||
| Automotive / Trucks | 1 | $34B |
|
||
Price history
+1113.0% since first listed14 events — show timeline
- 2026-05-15 Price Changed $279,000 NWMLS as Distributed by MLS Grid
- 2026-05-06 Price Changed $299,000 NWMLS as Distributed by MLS Grid
- 2026-04-28 Listed $315,000 NWMLS as Distributed by MLS Grid
- 2025-06-06 Sold (Public Records) $130,000 Public Records
- 2025-04-28 Sold (Public Records) $85,000 Public Records
- 2025-04-28 Listed $85,000 NWMLS as Distributed by MLS Grid
- 2025-04-28 Sold (MLS) $85,000 NWMLS as Distributed by MLS Grid
- 2012-07-05 Pending — NWMLS as Distributed by MLS Grid
- 2012-07-02 Sold (MLS) $34,000 NWMLS as Distributed by MLS Grid
- 2012-06-25 Price Changed $36,000 NWMLS as Distributed by MLS Grid
- 2012-05-19 Listed $43,000 NWMLS as Distributed by MLS Grid
- 1998-04-28 Sold (Public Records) $19,000 Public Records
- 1998-04-28 Sold (MLS) $19,000 NWMLS as Distributed by MLS Grid
- 1997-06-18 Listed $23,000 NWMLS as Distributed by MLS Grid
Property tax history
+2.3%/yrLatest (2026): $897 · +7.2% YoY. Source: county tax records.
Cash-flow waterfall
monthlySold comps — $/sqft
last 12 mo · ≤1 miLoading sold comps…