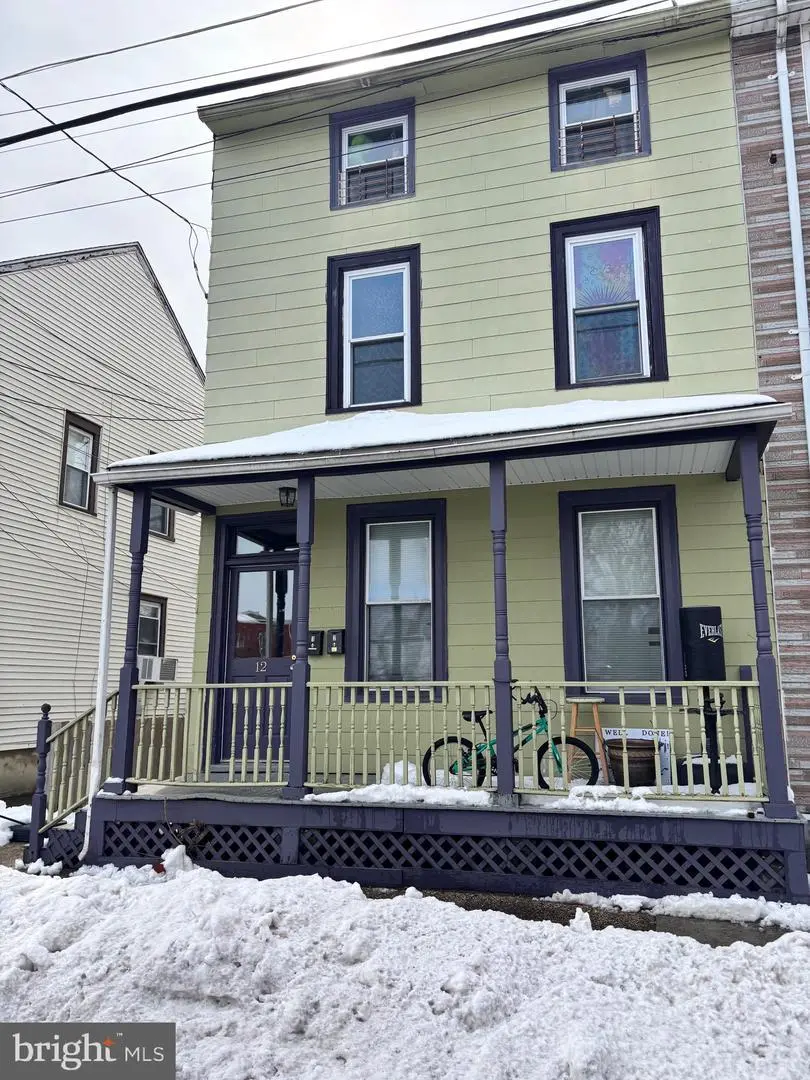
12 Church St · Vincentown, NJ
Flood risk 9/10 · Severe
- FEMA flood zone
- X (shaded)
- Chance of flooding over 30 yrs
- 0.99%
- Est. flood insurance / yr
- $507 – $1,088
Fire risk 2/10 · Minimal
- Est. fire insurance / yr
- $526 – $976
Heat risk 7/10 · Major
- Hot days now (above 104°F)
- 7 days/yr
- Hot days in 30 yrs
- 15 days/yr
Wind risk 6/10 · Moderate
- Chance of severe wind over 30 yrs
- 55.0%
Air-quality risk 4/10 · Minor
- Unhealthy air days now
- 5 days/yr
- Unhealthy air days in 30 yrs
- 7 days/yr
Risk factors via First Street. Map © Google.
Why this score? — see what drove the C+ grade
The composite is a weighted blend of 9 inputs, each scored 0–100. Each bar is that input's sub-score; the figure is the points it added to the 100-point composite (weight × sub-score).
- Cash flow +23.5/30.0
- ARV discount +15.0/15.0
- DSCR +7.6/10.0
- 1% rule +6.1/10.0
- Schools +3.4/10.0
- Rent growth +2.9/5.0
- Livability +2.5/5.0
- Condition / age +2.5/5.0
- Appreciation +0.0/10.0
$305,000
🖨 Deal sheet 📄 Offer letter ✓ Due diligence
Listing remarks MLS
Attention investors!!! Looking for a turn key multi-unit investment property in the Historic District of Mount Holly? Look no further! This rare find features 2 units, both well maintained and located in a highly rentable area. Book your appointment today before it's too late!
Key facts
- Separate utilities
- Tenant occupied
- Cash flow
Tags
Property features AI
Finance
- Other: Above-grade finished area reported as 2,152 (per assessor); Unfinished basement
- Financial info: Two-unit property (2 total units)
Exterior
- Parking: On-street parking
- Utilities: Public water; Public sewer; Natural gas available
- Home design: End of row / townhouse; Fee simple ownership
- Construction: Frame construction; Concrete perimeter foundation
- Exterior features: Lot dimensions approximately 25 x 100; No tidal water
Interior
- Kitchen: Stove; Refrigerator
- Bedrooms: 1 single-room unit (studio/efficiency); 1 three-bedroom unit
- Flooring: Carpet
- Heating & cooling: Electric baseboard heat; Natural gas heating fuel; Natural gas hot water
- Interior features: Carpet flooring in some areas; Open floor plan; Combined kitchen/dining area; Combined dining/living area
Neighborhood map
What this means for you Summary
Snapshot
- This is a 6-bed/?-bath single-family listed at $305k.
Deal economics
- At list price, monthly cash flow is $503 ($6k/yr) — positive.
- The deal already cash-flows at list — no discount required.
- Meets the 1% rule at list price ($3k rent vs $305k).
- Recommended offer: $296k (3.0% below list) — sets the bar for market timing.
- Cap rate 8.5% vs local median 4.5% in Vincentown — top-decile yield for the area; either an underpriced asset or a hidden risk that comps aren't pricing in. Stress-test before assuming the spread holds.
Location & tenants
- Location reads: area grade C — affects rentability + tenant quality, not the cash-flow math above.
- Rancocas Valley Regional High School District (suburban): math 29% / reading 49% proficiency, ranked #236 of 472 in NJ (top 50%) — families likely to look elsewhere, expect single-tenant / working-renter base with shorter leases.
- Market conditions: Rents rising (+1.4%/yr); 134 active listings in the ZIP; 1 comparable units currently listed for rent nearby; solid renter incomes; 2,161 units permitted in Burlington County in 2024 (988 in 5+ unit buildings).
- This rent runs 37% of the median local income ($109k/yr) — at the standard rent-burdened threshold; future hikes will face affordability resistance.
Forward outlook
- Local home prices are declining (-3.0%/yr); year-one equity from $2k of loan paydown is wiped out by about $9k of value loss. Plan a longer hold.
- Burlington County population projected to shrink 5% by 2050 — rents likely to lag national; underwrite the cash flow, not the appreciation.
Negotiation context
- It's been on market 48 days — a 3% lower offer ($296k) is reasonable based on typical stale-listing flexibility.
- 10 sale attempts since 27y ago with the ask held roughly flat each time — persistent listings suggest the price (not the market) is what's stuck; bring a comps-based counter.
- Current owner paid $125k; list at $305k implies a 144% gain — meaningful room to come down on a strong offer.
Risks & watch-outs
- Watch-outs: flood insurance adds $66/mo; built in 1885 — expect roof / HVAC / electrical / plumbing capex.
- Climate carrying-cost: severe flood risk; major wind risk, 55% chance of damaging wind over 30y; extreme-heat days projected 7→15/yr by 2055 (HVAC capex compounding) — expect insurance premiums to compound above CPI over the hold.
Questions for the listing agent
- It's been on market 48 days. Have you received any prior offers? Is the seller open to a 3% concession, seller financing, or rate buy-down credit?
- Built in 1885 — when were the roof, HVAC, electrical panel, plumbing, and water heater last replaced?
- What's the actual annual flood-insurance premium (NFIP or private), and is the property in a SFHA with mandatory coverage?
- Is there a deadline driving the sale (1031 exchange, divorce, estate, relocation)? That informs how much negotiation room exists.
- What's the average days-on-market for RENTAL listings here right now (not sales)? A rising rental-DOM trend means longer vacancies and softer asking-rent achievability than the comps imply.
- What's the recent tenant-quality profile in this submarket — average credit score on applications, eviction rate, late-payment / NSF rate, and stable-employment percentage? A property-management company in the area should have these aggregated.
- How much new for-sale + rental construction is in the pipeline within 1–3 miles? Heavy new supply typically softens prices + rents 12–24 months out; constrained supply supports both.
Investment metrics
- 1% rule
- 1.11% ✓
- Cap rate
- 8.53%
- Cash-on-cash
- 8.00%
- DSCR
- 1.36
- GRM
- 7.5
CMA / ARV
- ARV (on-the-fly)
- $471,288
- Comps found
- 2
Show comp detail 2 sales within ~0.75 mi
| Address | Dist | Beds/Ba | Sqft | Sold | Price | $/sf | Match |
|---|---|---|---|---|---|---|---|
| 45 Broad St | 0.46mi | 5/2.0 (-1) | 2,056 (-4%) | 4mo | $450,000 | $219 | 62 |
| 336 Washington St | 0.74mi | 5/1.5 (-1) | 2,062 (-4%) | 12mo | $240,000 | $116 | 43 |
Match score weights: distance 35% · size 25% · config 20% · recency 20%. Top-matched comps best support the ARV.
Projected returns pro-forma
-3.0% appreciation · 1.42% rent growth · sell at horizon
- IRR
- -7.3%
- Equity multiple
- 0.74×
- Total profit
- $-22,593
- Equity at exit
- $45,476
- IRR
- 0.2%
- Equity multiple
- 1.01×
- Total profit
- $900
- Equity at exit
- $26,371
Cash invested: $85,400 (down + closing). Projections, not guarantees.
Landlord ↔ Tenant lean methodology
- Overall (STATE)
- 21 Tenant-Leaning
- State New Jersey
- 21 Tenant-Leaning · D+6
- County
- — inherits STATE
- City
- — inherits STATE
ZIP-level market 08060
- Home prices YoY
- -34.5%
- Rents YoY
- 1.4%
- Active inventory
- 134
- Price-to-rent
- 7.5×
Monthly cashflow live
- Estimated rent
- $3,380 medium interval (Pro) →
- Mortgage (P&I)
- −$1,599
- Tax from tax record
- −$374 /mo · $4,492/yr
- Insurance
- −$127
- Flood insurance flood zone
- −$66 /mo · $798/yr
- HOA
- −$0
- Vacancy / Maint / Mgmt
- −$710
- Net cashflow
- $503
Break-even live
UW: 25.0% down · 7.5% · 30yr · 1.5% tax · 5.0% vac · 8.0% maint · 8.0% mgmt
Financing live
Cash to close
- Down payment
- $76,250
- Closing costs
- $9,150
- Reserves months
- —
- Total cash needed
- —
Loan-product check · same deal, 3 products live
Conventional
25% down · 7.5% · 30yr
- Down + closing
- —
- Monthly P&I
- —
- Monthly cashflow
- —
- DSCR
- —
- Eligible?
- —
Personal DTI + credit; lowest rate.
DSCR
20% down · 8.5% · 30yr
- Down + closing
- —
- Monthly P&I
- —
- Monthly cashflow
- —
- DSCR
- —
- Eligible?
- —
No personal income docs; deal must DSCR.
Hard money
10% down · 12.0% · 12mo
- Down + closing
- —
- Monthly P&I
- —
- Monthly cashflow
- —
- DSCR
- —
- Eligible?
- —
Short-term bridge; refi at stabilization.
Rent comps 1 comps
| Address | Beds | Baths | Sqft | Rent | $/sqft | DOM | Units | Dist |
|---|---|---|---|---|---|---|---|---|
| 901 Russo Dr Westampton, NJ | 5.0 | 3.0 | 1666 | $5,000 | $3.00 | 1d | 1 | 1.33mi |
Listing history 31 events
-
2026-05-23status Pending
-
2026-04-15status Active
-
2026-04-09historical
-
2026-03-30$305,000 Active
-
2018-06-26soldstatus $125,000
-
2018-06-15soldstatus $125,000 Closed 277-char remark
Show marketing remark (277 chars)
Attention investors!!! Looking for a turn key multi-unit investment property in the Historic District of Mount Holly? Look no further! This rare find features 2 units, both well maintained and located in a highly rentable area. Book your appointment today before it's too late!
-
2018-06-15soldstatus $125,000 Sold 277-char remark
Show marketing remark (277 chars)
Attention investors!!! Looking for a turn key multi-unit investment property in the Historic District of Mount Holly? Look no further! This rare find features 2 units, both well maintained and located in a highly rentable area. Book your appointment today before it's too late!
-
2018-05-29status Pending 277-char remark
Show marketing remark (277 chars)
Attention investors!!! Looking for a turn key multi-unit investment property in the Historic District of Mount Holly? Look no further! This rare find features 2 units, both well maintained and located in a highly rentable area. Book your appointment today before it's too late!
-
2018-05-29status Under Contract 277-char remark
Show marketing remark (277 chars)
Attention investors!!! Looking for a turn key multi-unit investment property in the Historic District of Mount Holly? Look no further! This rare find features 2 units, both well maintained and located in a highly rentable area. Book your appointment today before it's too late!
-
2018-05-23historical 277-char remark
Show marketing remark (277 chars)
Attention investors!!! Looking for a turn key multi-unit investment property in the Historic District of Mount Holly? Look no further! This rare find features 2 units, both well maintained and located in a highly rentable area. Book your appointment today before it's too late!
-
2018-05-15$134,900 Active 277-char remark
Show marketing remark (277 chars)
Attention investors!!! Looking for a turn key multi-unit investment property in the Historic District of Mount Holly? Look no further! This rare find features 2 units, both well maintained and located in a highly rentable area. Book your appointment today before it's too late!
-
2018-03-06historical
-
2017-11-01$125,000 Active
-
2017-04-21$127,000 Active
-
2017-03-15historical
-
2016-03-15$127,999
-
2006-05-15soldstatus $147,500
-
2006-04-28soldstatus $147,500
-
2006-03-06historical
-
2006-02-14$147,500
-
2003-06-11soldstatus $115,000
-
2003-05-23soldstatus $120,000
-
2003-04-30historical
-
2003-02-03$120,000
-
2001-06-13soldstatus $72,000
-
2000-02-02soldstatus $60,000
-
2000-01-08soldstatus $60,000
-
1999-12-21historical
-
1999-03-01$60,000
-
1985-09-01soldstatus $36,200
ⓘ Source: listings_history table (triggers on properties + properties_extension) + one-shot
backfill from property_details.listing_events for pre-trigger history.
Tax reassessment forecast NJ · Partial reset (capped growth)
- Current annual tax
- $4,492 · $374/mo
- Projected year-2 tax
- $6,043 · $504/mo
- Expected delta
- +$1,551/yr (+$129/mo · 34.5%)
ⓘ Screening estimate from a state-policy table — verify with the county assessor before closing.
Climate risk First Street
- Flood 9/10 Extreme FEMA zone X (shaded) · 99% chance over 30 yrs
- Wildfire 2/10 Low
- Heat 7/10 Severe 7 d/yr ≥104°F today · 15 d/yr by 30 yrs out
- Wind 6/10 Major 55% chance of damaging wind over 30 yrs
- Air quality 4/10 Moderate 5 unhealthy d/yr today · 7 by 30 yrs out
Nearby sold comps map
Loading sold comps map…
Walkable amenities ~0.75 mi
Loading nearby amenities…
Taxation est. · year 1
- Rental income
- $40,561
- − Mortgage interest
- −$17,085
- − Property taxes
- −$4,492
- − Insurance
- −$2,322
- − Repairs & maintenance
- −$3,245
- − Management
- −$3,245
- − Depreciation
- −$8,873
- Taxable income
- $1,299
- Est. tax owed @ 24.0%
- −$312
- After-tax cash flow
- $5,723/yr
For passive investors: Depreciation is non-cash, so a rental often shows a tax loss while cash-flowing — sheltering income. Rental losses are passive: they offset passive income freely, and up to $25,000/yr can offset ordinary (W-2) income if you actively participate and your MAGI is under $100k (phasing out to $0 by $150k); unused losses carry forward. On sale, claimed depreciation is recaptured at up to 25%, and gains may owe capital-gains tax (a 1031 exchange can defer both). Figures are a year-1 estimate at your 24.0% rate — not tax advice; consult a CPA.
Schools (NCES district)
- District
- Rancocas Valley Regional High School District
- NCES district ID
- 3413620
- Math proficiency
- 29% ▼ -18.00%
- Reading proficiency
- 49% ▼ -4.00%
- Median HH income
- $58,992
- Composite
- 34.45/100
- National rank
- #5195
- State rank
- #236 of 472 in NJ
Livability — Vincentown
No livability data for this city. (Only ~50 U.S. cities are tracked.)
Census & demographics
- County
- Burlington County · 323,710 people
- Metro
- Philadelphia-Camden-Wilmington, PA-NJ-DE-MD
- Population (ZIP)
- 25,835
- Household income
- $109,292
- Rent vs Own
- Severe rent burden
- 562.0
Population outlook (Burlington County) Hauer SSP2
- Today (2025)
- 453,425 people
- By 2030
- 452,359 · -0.2%
- By 2040
- 445,033 · -1.9%
- By 2050
- 431,760 · -4.8%
- By 2075
- 406,277 · -10.4%
- By 2100
- 364,732 · -19.6%
Race, ethnicity, and origin ACS 2023
- Neighborhood character
- Diverse neighborhood (Simpson 0.68)
- Race & ethnicity
- White 49% Black 25% Two or more races 15% Hispanic / Latino 13% Asian 4%
- Hispanic origin (detail)
- Mexican 2% Puerto Rican 7%
- Common ancestry
- Romanian 4% Lithuanian 2% Italian 1%
- Foreign-born
- 11% · Canada, Dominican Republic, China
- Languages at home
- 87% English-only · Spanish 7% Other Indo-European 2% French/Haitian/Cajun 1%
Political lean MEDSL · Burlington
- 2024 margin
- D (+16.6) · D 57.6% · R 41.0% · Other 1.3%
- 2008→2024 swing
- -2.0pp toward R · 2008: 18.6pp · 2024: 16.6pp
- All cycles
- 2024: D+16.6 2020: D+19.5 2016: D+14.8 2012: D+18.7 2008: D+18.6
Not yet ingested
- Civics
- —
Market trends
- HPI YoY
- ▼ -156.50%
- Current HPI
- 296.564
- Rent YoY
- ▲ 1.42%
- Metro
- Philadelphia-Camden-Wilmington, PA-NJ-DE-MD
- State GDP YoY
- ▲ 2.05%
- F500 in state
- 34
Industry mix (Fortune 500 HQ in NJ)
| Industry | F500 HQs | Revenue |
|---|---|---|
| Consumer Goods | 3 | $31B |
|
||
| Pharmaceuticals | 2 | $153B |
|
||
| Technology | 2 | $21B |
|
||
| Insurance | 2 | $20B |
|
||
| Healthcare | 2 | $19B |
|
||
| Financial Services | 1 | $70B |
|
||
Price history
+742.5% since first listed31 events — show timeline
- 2026-05-23 Pending — BRIGHT MLS
- 2026-04-15 Relisted — BRIGHT MLS
- 2026-04-09 Listing Removed — BRIGHT MLS
- 2026-03-30 Listed $305,000 BRIGHT MLS
- 2018-06-26 Sold (Public Records) $125,000 Public Records
- 2018-06-15 Sold (MLS) $125,000 TREND
- 2018-06-15 Sold (MLS) $125,000 BRIGHT MLS
- 2018-05-29 Pending — BRIGHT MLS
- 2018-05-29 Pending — TREND
- 2018-05-23 Listing Removed — BRIGHT MLS
- 2018-05-15 Listed $134,900 TREND
- 2018-05-15 Listed $134,900 BRIGHT MLS
- 2018-03-06 Listing Removed — BRIGHT MLS
- 2017-11-01 Listed $125,000 BRIGHT MLS
- 2017-04-21 Listed $127,000 BRIGHT MLS
- 2017-03-15 Listing Removed — BRIGHT MLS
- 2016-03-15 Listed $127,999 BRIGHT MLS
- 2006-05-15 Sold (Public Records) $147,500 Public Records
- 2006-04-28 Sold (MLS) $147,500 BRIGHT MLS
- 2006-03-06 Listing Removed — BRIGHT MLS
- 2006-02-14 Listed $147,500 BRIGHT MLS
- 2003-06-11 Sold (Public Records) $115,000 Public Records
- 2003-05-23 Sold (MLS) $120,000 BRIGHT MLS
- 2003-04-30 Listing Removed — BRIGHT MLS
- 2003-02-03 Listed $120,000 BRIGHT MLS
- 2001-06-13 Sold (Public Records) $72,000 Public Records
- 2000-02-02 Sold (Public Records) $60,000 Public Records
- 2000-01-08 Sold (MLS) $60,000 BRIGHT MLS
- 1999-12-21 Listing Removed — BRIGHT MLS
- 1999-03-01 Listed $60,000 BRIGHT MLS
- 1985-09-01 Sold (Public Records) $36,200 Public Records
Property tax history
+2.5%/yrLatest (2025): $4,492 · +6.6% YoY. Source: county tax records.
Cash-flow waterfall
monthlySold comps — $/sqft
last 12 mo · ≤1 miLoading sold comps…