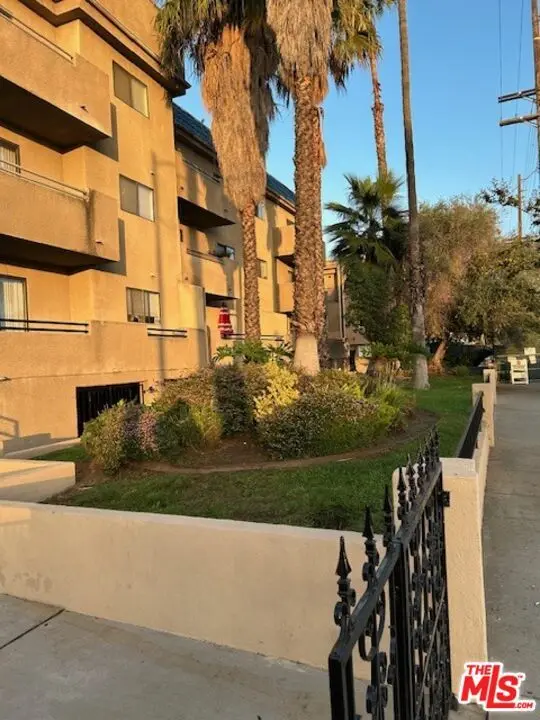
10901 Laurel Canyon Blvd #212 · Los Angeles, CA
Flood risk 8/10 · Major
- FEMA flood zone
- X (unshaded)
- Chance of flooding over 30 yrs
- 0.78%
- Est. flood insurance / yr
- $507 – $1,088
Fire risk 1/10 · Minimal
- Est. fire insurance / yr
- $659 – $1,223
Heat risk 6/10 · Moderate
- Hot days now (above 98°F)
- 7 days/yr
- Hot days in 30 yrs
- 20 days/yr
Wind risk 1/10 · Minimal
- Chance of severe wind over 30 yrs
- —
Air-quality risk 7/10 · Major
- Unhealthy air days now
- 13 days/yr
- Unhealthy air days in 30 yrs
- 16 days/yr
Risk factors via First Street. Map © Google.
Why this score? — see what drove the D- grade
The composite is a weighted blend of 9 inputs, each scored 0–100. Each bar is that input's sub-score; the figure is the points it added to the 100-point composite (weight × sub-score).
- ARV discount +15.0/15.0
- Cash flow +7.5/30.0
- 1% rule +3.9/10.0
- Schools +3.6/10.0
- Livability +3.4/5.0
- Rent growth +2.5/5.0
- Condition / age +2.5/5.0
- DSCR +1.6/10.0
- Appreciation +0.0/10.0
$404,000
🖨 Deal sheet 📄 Offer letter ✓ Due diligence
Listing remarks MLS
This clean, spacious, updated three-bedroom, two-bathroom condo is situated in a desirable, walkable neighborhood and offers comfortable living or an opportunity for rental income. The second floor condo has a bright and open living area with natural light, stylish flooring, and flows into a dining area and kitchen. The kitchen features sleek countertops, all kitchen appliances and generous cabinetry. The primary bedroom boasts two closets, a bathroom for added privacy and convenience and a balcony. Two additional bedrooms offer space for family living, a home office, or guest accommodations. Each room is well-proportioned with large windows that invite sunshine throughout the day. Additional highlights include:Ample laundry facilities in the gated, secure buildingAssigned parking and guest spaces, Central heat and air conditioning, Private balcony to enjoy fresh air, secure entry and well-maintained common areas, located close to local shops, restaurants, parks, with easy access to the freeway, this condo gives you access to everything San Fernando has to offer.
Key facts
- Generous cabinetry
- Two closets
- Private balcony
Tags
Neighborhood map
What this means for you Summary
Snapshot
- This is a 3-bed/3.0-bath condo listed at $404k.
Deal economics
- At list price, monthly cash flow is $-571 ($-7k/yr) — negative.
- To cash-flow at today's rent, offer at most $303k (25.0% below list).
- To meet the 1% rule (rent ≥ 1% of price), the offer needs to be $359k (11.2% below list).
- Recommended offer: $303k (25.0% below list) — sets the bar for cash-flow.
- Cap rate 4.8% vs local median 2.1% in Los Angeles — top-decile yield for the area; either an underpriced asset or a hidden risk that comps aren't pricing in. Stress-test before assuming the spread holds.
Location & tenants
- Location reads 68/100 on livability (#273 in CA) — a middle-class / working-renter tenant base. Strengths: amenities A+, commute A+, employment B; Watch: health & safety C-, schools D+, crime F.
- Los Angeles Unified (urban): math 29% / reading 54% proficiency, ranked #223 of 517 in CA (top 43%) — families likely to look elsewhere, expect single-tenant / working-renter base with shorter leases; 67% free/reduced lunch — lower-income household profile, screen leases tightly.
- Market conditions: 31 active listings in the ZIP; 19 comparable units currently listed for rent nearby; rentals lingering (median 44d on market — plan ~5-8 weeks vacancy on turnover, expect pricing pressure); 63% of comp listings sitting > 30 days — soft ceiling on asking rent; solid renter incomes; 19,697 units permitted in Los Angeles County in 2024 (9,426 in 5+ unit buildings).
- At $3,586/mo this rent would consume 50% of the median local household income ($85k/yr) (locally 999% of renters already pay >50% of income on rent) — very limited rent-growth headroom before tenants either downsize or default.
Forward outlook
- Local home prices are declining (-3.0%/yr); year-one equity from $3k of loan paydown is wiped out by about $12k of value loss. Plan a longer hold.
- Los Angeles County population projected at +9% by 2050 — modest demand growth; plan on rents tracking national, not racing it.
Negotiation context
- It's been on market 148 days — a 12% lower offer ($356k) is reasonable based on typical stale-listing flexibility.
- 11 sale attempts since 28y ago; this cycle's ask has dropped $45k (10%) from the opening price — seller is motivated, your offer sets the floor, not the list.
- Current owner paid $318k; 27% above their basis — modest negotiation headroom, anchor on the comps not their cost.
Risks & watch-outs
- Watch-outs: flood insurance adds $66/mo.
- Climate carrying-cost: severe flood risk; extreme-heat days projected 7→20/yr by 2055 (HVAC capex compounding) — expect insurance premiums to compound above CPI over the hold.
Questions for the listing agent
- What do current leases actually rent for vs. the listed asking? Can we see a recent rent roll and the last 12 months of T-12 income?
- It's been on market 148 days. Have you received any prior offers? Is the seller open to a 25% concession, seller financing, or rate buy-down credit?
- What's the actual annual flood-insurance premium (NFIP or private), and is the property in a SFHA with mandatory coverage?
- What does the HOA fee cover, when was the last increase, and are there any pending special assessments or reserve-fund shortfalls?
- Any open or pending special assessments — roof, HVAC, plumbing, elevator, façade? What's the per-unit balance and payoff schedule, and is the seller paying it off at close or rolling it to the buyer?
- Why hasn't it sold? Are there any deal-killer items the seller is aware of (foundation, flood, title, zoning, code violations)?
- Is there a deadline driving the sale (1031 exchange, divorce, estate, relocation)? That informs how much negotiation room exists.
- Schools are D-rated, which usually means shorter tenancies and higher turnover. Who's the typical renter profile here, and what's been the actual vacancy rate?
- Crime grade is F in this area — have there been break-ins, vandalism, or insurance claims at this property in the last 3 years? What carrier currently insures it and at what premium?
- The area grade is low — what's the realistic commute time and amenity access for the typical tenant pool here? Any planned neighborhood developments (good or bad) we should know about?
- What's the average days-on-market for RENTAL listings here right now (not sales)? A rising rental-DOM trend means longer vacancies and softer asking-rent achievability than the comps imply.
- What's the recent tenant-quality profile in this submarket — average credit score on applications, eviction rate, late-payment / NSF rate, and stable-employment percentage? A property-management company in the area should have these aggregated.
- How much new apartment / multifamily construction is in the pipeline within 1–3 miles? Heavy new supply (>2% of stock underway) typically softens rents 12–24 months out; light construction supports rent growth.
Investment metrics
- 1% rule
- 0.89% ✗
- Cap rate
- 4.79%
- Cash-on-cash
- -5.35%
- DSCR
- 0.76
- GRM
- 9.4
CMA / ARV
- ARV (median comp)
- $522,058
- List price
- $404,000
- Delta
- -22.61%
- Verdict
- UNDERPRICED
- Comps
- 10 within 1.0 mi
Projected returns pro-forma
-3.0% appreciation · 3.0% rent growth · sell at horizon
- IRR
- -26.5%
- Equity multiple
- 0.10×
- Total profit
- $-101,404
- Equity at exit
- $60,238
- IRR
- -23.3%
- Equity multiple
- -0.18×
- Total profit
- $-133,383
- Equity at exit
- $34,931
Cash invested: $113,120 (down + closing). Projections, not guarantees.
Landlord ↔ Tenant lean methodology
- Overall (CITY)
- 0 Strongly Tenant-Friendly
- State California
- 18 Strongly Tenant-Friendly · D+13
- County
- — inherits STATE
- City Los Angeles
- 0 Strongly Tenant-Friendly · D+22
ZIP-level market 91340
- Active inventory
- 31
- Price-to-rent
- 9.4×
Monthly cashflow live
- Estimated rent
- $3,586 high interval (Pro) →
- Mortgage (P&I)
- −$2,119
- Tax from tax record
- −$356 /mo · $4,270/yr
- Insurance
- −$168
- Flood insurance flood zone
- −$66 /mo · $798/yr
- HOA
- −$695
- Vacancy / Maint / Mgmt
- −$753
- Net cashflow
- $-571
Break-even live
UW: 25.0% down · 7.5% · 30yr · 1.5% tax · 5.0% vac · 8.0% maint · 8.0% mgmt
Financing live
Cash to close
- Down payment
- $101,000
- Closing costs
- $12,120
- Reserves months
- —
- Total cash needed
- —
Loan-product check · same deal, 3 products live
Conventional
25% down · 7.5% · 30yr
- Down + closing
- —
- Monthly P&I
- —
- Monthly cashflow
- —
- DSCR
- —
- Eligible?
- —
Personal DTI + credit; lowest rate.
DSCR
20% down · 8.5% · 30yr
- Down + closing
- —
- Monthly P&I
- —
- Monthly cashflow
- —
- DSCR
- —
- Eligible?
- —
No personal income docs; deal must DSCR.
Hard money
10% down · 12.0% · 12mo
- Down + closing
- —
- Monthly P&I
- —
- Monthly cashflow
- —
- DSCR
- —
- Eligible?
- —
Short-term bridge; refi at stabilization.
Rent comps 19 comps
| Address | Beds | Baths | Sqft | Rent | $/sqft | DOM | Units | Dist |
|---|---|---|---|---|---|---|---|---|
| 623 Chatsworth Dr San Fernando, CA | 2.0 | 2.0 | 1170 | $4,200 | $3.59 | 44d | 1 | 0.66mi |
| 13768 1/2 Judd St Pacoima, CA | 2.0 | 2.0 | 920 | $2,750 | $2.99 | 25d | 1 | 0.73mi |
| 13704 Pinney St Pacoima, CA | 3.0 | 2.0 | 1100 | $3,500 | $3.18 | 44d | 1 | 0.85mi |
| 13714 Hoyt St Pacoima, CA | 3.0 | 2.0 | 1250 | $3,685 | $2.95 | 44d | 1 | 0.98mi |
| 1314 Omelveny Ave San Fernando, CA | 2.0 | 1.0 | 1100 | $2,600 | $2.36 | 44d | 1 | 1.01mi |
| 10839 Burnet Ave Mission Hills, CA | 3.0 | 1.0 | 912 | $3,500 | $3.84 | 44d | 1 | 1.09mi |
| 13721 Pierce St Arleta, CA | 2.0 | 2.0 | 1022 | $2,900 | $2.84 | 2d | 1 | 1.16mi |
| 15106 San Jose St Mission Hills, CA | 3.0 | 2.0 | 1354 | $3,650 | $2.70 | 44d | 1 | 1.16mi |
| 15236 Kingsbury St Mission Hills, CA | 3.0 | 2.0 | 1200 | $3,500 | $2.92 | 5d | 1 | 1.25mi |
| 14448 Pinney St Arleta, CA | 3.0 | 2.0 | 1144 | $3,300 | $2.88 | 44d | 1 | 1.30mi |
| 14761 Septo St Mission Hills, CA | 3.0 | 2.0 | 1264 | $4,400 | $3.48 | 8d | 1 | 1.32mi |
| 14934 Mayall St Mission Hills, CA | 3.0 | 2.0 | 1500 | $4,250 | $2.83 | 44d | 1 | 1.32mi |
| 10214 O'Melveny Ave Unit 10212 Pacoima, CA | 3.0 | 2.0 | 1037 | $3,500 | $3.38 | 21d | 1 | 1.36mi |
| 10214 O'Melveny Ave Unit 10214 Pacoima, CA | 3.0 | 2.0 | 1129 | $3,500 | $3.10 | 44d | 1 | 1.36mi |
| 546 Griswold Ave San Fernando, CA | 3.0 | 2.0 | 1585 | $5,250 | $3.31 | 25d | 1 | 1.40mi |
| 15418 Bermuda St Mission Hills, CA | 2.0 | 2.0 | 960 | $2,895 | $3.02 | 44d | 1 | 1.46mi |
| 13100 Filmore St Pacoima, CA | 3.0 | 2.0 | 1452 | $3,250 | $2.24 | 44d | 1 | 1.48mi |
| 14610 W Isla Vista Dr Panorama City, CA | 4.0 | 2.5 | 1574 | $3,800 | $2.41 | 2d | 1 | 1.49mi |
| 10027 Noble Ave Mission Hills, CA | 3.0 | 2.5 | 1150 | $3,800 | $3.30 | 44d | 1 | 1.49mi |
HOA detail condo
- Monthly dues
- $695 · $8,340/yr
- Likely covers
- gassecurityparking
- Assessments
- None detected in remarks — confirm with the listing agent.
Listing history 38 events
-
2026-06-13days on market $404,000 Active 148 DOM
-
2026-06-09days on market $404,000 Active 144 DOM
-
2026-06-08days on market $404,000 Active 143 DOM
-
2026-06-07days on market $404,000 Active 142 DOM
-
2026-06-04days on market $404,000 Active 139 DOM
-
2026-06-03days on market $404,000 Active 138 DOM
-
2026-06-02days on market $404,000 Active 137 DOM
-
2026-06-01days on market $404,000 Active 136 DOM
-
2026-05-31days on market $404,000 Active 135 DOM
-
2026-03-06price $404,000 1080-char remark
Show marketing remark (1080 chars)
This clean, spacious, updated three-bedroom, two-bathroom condo is situated in a desirable, walkable neighborhood and offers comfortable living or an opportunity for rental income. The second floor condo has a bright and open living area with natural light, stylish flooring, and flows into a dining area and kitchen. The kitchen features sleek countertops, all kitchen appliances and generous cabinetry. The primary bedroom boasts two closets, a bathroom for added privacy and convenience and a balcony. Two additional bedrooms offer space for family living, a home office, or guest accommodations. Each room is well-proportioned with large windows that invite sunshine throughout the day. Additional highlights include:Ample laundry facilities in the gated, secure buildingAssigned parking and guest spaces, Central heat and air conditioning, Private balcony to enjoy fresh air, secure entry and well-maintained common areas, located close to local shops, restaurants, parks, with easy access to the freeway, this condo gives you access to everything San Fernando has to offer.
-
2026-01-13$449,000 Active 1080-char remark
Show marketing remark (1080 chars)
This clean, spacious, updated three-bedroom, two-bathroom condo is situated in a desirable, walkable neighborhood and offers comfortable living or an opportunity for rental income. The second floor condo has a bright and open living area with natural light, stylish flooring, and flows into a dining area and kitchen. The kitchen features sleek countertops, all kitchen appliances and generous cabinetry. The primary bedroom boasts two closets, a bathroom for added privacy and convenience and a balcony. Two additional bedrooms offer space for family living, a home office, or guest accommodations. Each room is well-proportioned with large windows that invite sunshine throughout the day. Additional highlights include:Ample laundry facilities in the gated, secure buildingAssigned parking and guest spaces, Central heat and air conditioning, Private balcony to enjoy fresh air, secure entry and well-maintained common areas, located close to local shops, restaurants, parks, with easy access to the freeway, this condo gives you access to everything San Fernando has to offer.
-
2020-12-02soldstatus $317,500
-
2013-07-03$135,000 Active
-
2013-06-28soldstatus $135,000 Closed
-
2013-06-28soldstatus $135,000
-
2013-06-26$10,901 Active
-
2009-12-21soldstatus $75,900 Closed
-
2009-12-14status Pending
-
2009-12-01$74,900 Active
-
2008-01-24historical
-
2008-01-10price $270,000
-
2007-10-14$289,000
-
2007-10-13historical
-
2007-07-27$289,000
-
2007-07-24historical
-
2007-03-20price $299,000
-
2007-02-17historical
-
2007-02-17historical
-
2007-02-17historical
-
2006-05-28$320,000
-
2006-05-28$319,500
-
2006-03-29$310,000
-
2005-11-29$314,900
-
2000-03-13soldstatus $78,000
-
1998-07-31soldstatus $35,000
-
1998-07-02historical
-
1998-05-27$41,500
-
1996-10-17soldstatus $76,000
ⓘ Source: listings_history table (triggers on properties + properties_extension) + one-shot
backfill from property_details.listing_events for pre-trigger history.
Tax reassessment forecast CA · Resets to sale price
- Current annual tax
- $4,270 · $356/mo
- Projected year-2 tax
- $4,270 · $356/mo
- Expected delta
- $0/yr ($0/mo · 0.0%)
ⓘ Screening estimate from a state-policy table — verify with the county assessor before closing.
Climate risk First Street
- Flood 8/10 Severe FEMA zone X (unshaded) · 78% chance over 30 yrs
- Wildfire 1/10 Low
- Heat 6/10 Major 7 d/yr ≥98°F today · 20 d/yr by 30 yrs out
- Wind 1/10 Low
- Air quality 7/10 Severe 13 unhealthy d/yr today · 16 by 30 yrs out
Nearby sold comps map
Loading sold comps map…
Walkable amenities ~0.75 mi
Loading nearby amenities…
Taxation est. · year 1
- Rental income
- $43,036
- − Mortgage interest
- −$22,630
- − Property taxes
- −$4,270
- − Insurance
- −$2,818
- − Repairs & maintenance
- −$3,443
- − Management
- −$3,443
- − HOA
- −$8,340
- − Depreciation
- −$11,753
- Taxable loss
- −$13,660
- Est. tax savings @ 24.0%
- +$3,278
- After-tax cash flow
- $-3,574/yr
For passive investors: Depreciation is non-cash, so a rental often shows a tax loss while cash-flowing — sheltering income. Rental losses are passive: they offset passive income freely, and up to $25,000/yr can offset ordinary (W-2) income if you actively participate and your MAGI is under $100k (phasing out to $0 by $150k); unused losses carry forward. On sale, claimed depreciation is recaptured at up to 25%, and gains may owe capital-gains tax (a 1031 exchange can defer both). Figures are a year-1 estimate at your 24.0% rate — not tax advice; consult a CPA.
Schools (NCES district)
- District
- Los Angeles Unified
- NCES district ID
- 0622710
- Math proficiency
- 29% ▼ -4.00%
- Reading proficiency
- 54% ▲ 10.00%
- Median HH income
- $50,403
- Composite
- 35.67/100
- National rank
- #4875
- State rank
- #223 of 517 in CA
Livability — Los Angeles
- Score
- 68/100
- State rank
- #273
- US rank
- #9237
Category grades
Schools grade is shown separately in the Schools card above.
Census & demographics
- Census place
- Los Angeles, CA
- County
- Los Angeles County · 9,444,647 people
- City population
- 3,838,149
- Metro
- Los Angeles-Long Beach-Anaheim, CA
- Population (ZIP)
- 33,424
- Household income
- $85,261
- Rent vs Own
- Severe rent burden
- 999.0
Population outlook (Los Angeles County) Hauer SSP2
- Today (2025)
- 10,940,515 people
- By 2030
- 11,256,481 · +2.9%
- By 2040
- 11,729,929 · +7.2%
- By 2050
- 11,948,407 · +9.2%
- By 2075
- 11,818,114 · +8.0%
- By 2100
- 10,842,928 · -0.9%
Race, ethnicity, and origin ACS 2023
- Neighborhood character
- Predominantly Hispanic (91%)
- Race & ethnicity
- Hispanic / Latino 91% Two or more races 26% White 4% Asian 2% Black 2% Native American 2%
- Hispanic origin (detail)
- Mexican 78%
- Foreign-born
- 35% · Canada, Guatemala
- Languages at home
- 27% English-only · Spanish 71% Tagalog/Filipino 1%
Political lean MEDSL · Los Angeles
- 2024 margin
- Solid D (+32.9) · D 64.8% · R 31.9% · Other 3.3%
- 2008→2024 swing
- -7.4pp toward R · 2008: 40.4pp · 2024: 32.9pp
- All cycles
- 2024: D+32.9 2020: D+44.2 2016: D+48.0 2012: D+40.0 2008: D+40.4
Not yet ingested
- Civics
- —
Market trends
- HPI YoY
- ▼ -583.46%
- Current HPI
- 496.3277
- Rent YoY
- —
- Metro
- Los Angeles-Long Beach-Anaheim, CA
- State GDP YoY
- ▲ 3.21%
- F500 in state
- 116
Industry mix (Fortune 500 HQ in CA)
| Industry | F500 HQs | Revenue |
|---|---|---|
| Technology | 27 | $1,492B |
|
||
| Financial Services | 3 | $174B |
|
||
| Retail | 3 | $44B |
|
||
| Insurance | 3 | $26B |
|
||
| Media / Entertainment | 2 | $115B |
|
||
| Pharmaceuticals / Biotech | 2 | $62B |
|
||
Price history
+431.6% since first listed29 events — show timeline
- 2026-03-06 Price Changed $404,000 TheMLS
- 2026-01-13 Listed $449,000 TheMLS
- 2020-12-02 Sold (Public Records) $317,500 Public Records
- 2013-07-03 Listed $135,000 CRMLS
- 2013-06-28 Sold (Public Records) $135,000 Public Records
- 2013-06-28 Sold (MLS) $135,000 CRMLS
- 2013-06-26 Listed $10,901 CRMLS
- 2009-12-21 Sold (MLS) $75,900 CRMLS
- 2009-12-14 Pending — CRMLS
- 2009-12-01 Listed $74,900 CRMLS
- 2008-01-24 Listing Removed — CRMLS
- 2008-01-10 Price Changed $270,000 CRMLS
- 2007-10-14 Listed $289,000 CRMLS
- 2007-10-13 Listing Removed — CRMLS
- 2007-07-27 Listed $289,000 CRMLS
- 2007-07-24 Listing Removed — CRMLS
- 2007-03-20 Price Changed $299,000 CRMLS
- 2007-02-17 Listing Removed — CRMLS
- 2007-02-17 Listing Removed — CRMLS
- 2007-02-17 Listing Removed — CRMLS
- 2006-05-28 Listed $319,500 CRMLS
- 2006-05-28 Listed $320,000 CRMLS
- 2006-03-29 Listed $310,000 CRMLS
- 2005-11-29 Listed $314,900 CRMLS
- 2000-03-13 Sold (Public Records) $78,000 Public Records
- 1998-07-31 Sold (MLS) $35,000 TheMLS
- 1998-07-02 Delisted — TheMLS
- 1998-05-27 Listed $41,500 TheMLS
- 1996-10-17 Sold (Public Records) $76,000 Public Records
Property tax history
+7.7%/yrLatest (2025): $4,270 · +1.3% YoY. Source: county tax records.
Cash-flow waterfall
monthlySold comps — $/sqft
last 12 mo · ≤1 miLoading sold comps…