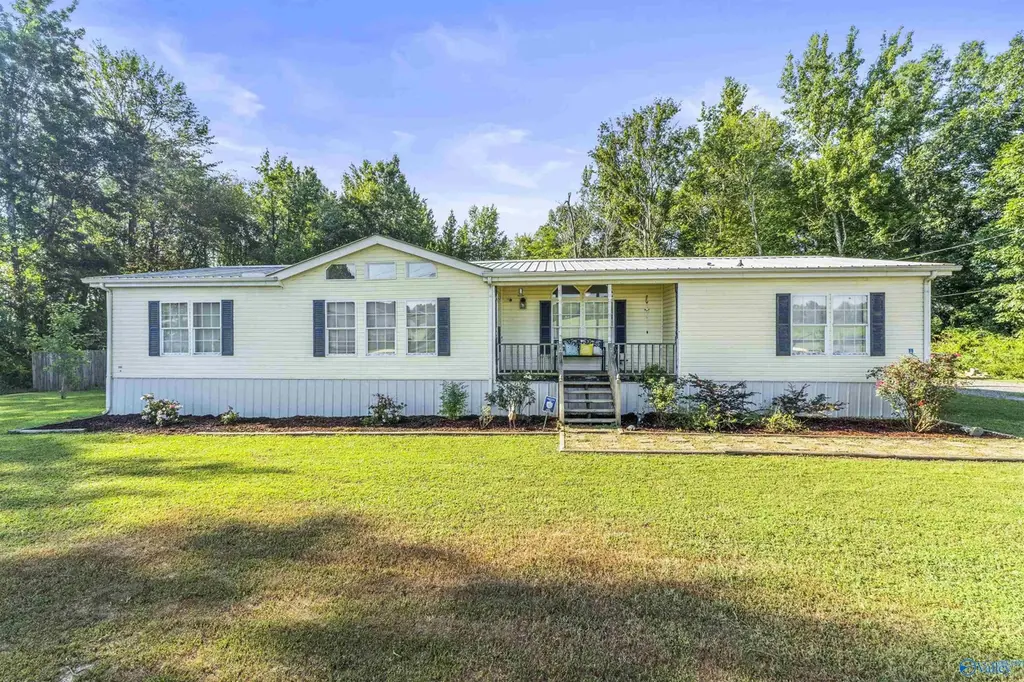
764 Rolan Gooch Rd · Harvest, AL
Flood risk 1/10 · Minimal
- FEMA flood zone
- X (unshaded)
- Chance of flooding over 30 yrs
- 0.0%
- Est. flood insurance / yr
- $507 – $1,088
Fire risk 4/10 · Minor
- Est. fire insurance / yr
- $916 – $1,700
Heat risk 5/10 · Moderate
- Hot days now (above 104°F)
- 7 days/yr
- Hot days in 30 yrs
- 19 days/yr
Wind risk 4/10 · Minor
- Chance of severe wind over 30 yrs
- 18.0%
Air-quality risk 1/10 · Minimal
- Unhealthy air days now
- 0 days/yr
- Unhealthy air days in 30 yrs
- 0 days/yr
Risk factors via First Street. Map © Google.
Why this score? — see what drove the D- grade
The composite is a weighted blend of 9 inputs, each scored 0–100. Each bar is that input's sub-score; the figure is the points it added to the 100-point composite (weight × sub-score).
- Appreciation +10.0/10.0
- ARV discount +7.5/15.0
- Cash flow +6.6/30.0
- Schools +3.7/10.0
- Livability +3.6/5.0
- Rent growth +2.5/5.0
- Condition / age +2.5/5.0
- 1% rule +1.7/10.0
- DSCR +0.8/10.0
$160,000
🖨 Deal sheet (PDF) 📄 Offer letter ✓ Due diligence
Listing remarks
3 Bedroom/ 2 bath home in tranquil setting. This home sits on a beautiful . 90 acre lot surrounded by trees for privacy. Storage shed and gazebo in the back yard. Easy drive to Huntsville, Hazel Green, or Ardmore!
Key facts
- Beautiful acre lot
- Gazebo
- Tranquil setting
Tags
Property features AI
Finance
- Other: Property type: Residential; Lot size: 0.9 acres
- HOA & community: No homeowners association
Exterior
- Parking: Gravel driveway
- Utilities: Public water; Septic tank
- Home design: Manufactured home; Single-story; Built in 1997
- Construction: Vinyl siding
- Exterior features: Gazebo; Covered porch
Interior
- Bedrooms: Total rooms: 9
- Bathrooms: 2 full bathrooms
- Heating & cooling: Central cooling; Central heating with propane
- Interior features: Crawl space foundation; One fireplace
Neighborhood map
What this means for you Summary
Snapshot
- This is a 3-bed/2.0-bath manufactured listed at $160k.
Deal economics
- At list price, monthly cash flow is $-265 ($-3k/yr) — negative.
- To cash-flow at today's rent, offer at most $122k (24.0% below list).
- To meet the 1% rule (rent ≥ 1% of price), the offer needs to be $106k (33.5% below list).
- Recommended offer: $106k (33.5% below list) — sets the bar for 1% rule.
- Cap rate 4.3% vs local median 3.5% in Harvest — meaningfully above typical; check what's discounted (condition, days-on-market, listing class) to confirm the premium yield is real.
Location & tenants
- Location reads 72/100 on livability (#27 in AL) — a middle-class / working-renter tenant base. Strengths: crime A+, employment A+, cost of living A+; Watch: amenities F, commute F, health & safety F.
- Madison County (rural): math 27% / reading 56% proficiency, ranked #19 of 129 in AL (top 15%) — families likely to look elsewhere, expect single-tenant / working-renter base with shorter leases.
- Zoned schools: Madison Cross Roads Elementary School (math 14% / reading 48%, grade F, #360 of 627 statewide, top 58%, 1,035 students, 59% FRL); Sparkman Middle School (math 18% / reading 53%, grade F, #81 of 257 statewide, top 33%, 859 students, 60% FRL); Sparkman High School (math 28% / reading 37%, grade F, #58 of 305 statewide, top 19%, 1,738 students, 37% FRL) — zoned schools average 52% FRL vs 29% district-wide (23 pts higher); higher-poverty schools than district average — tighter screening recommended.
- Market conditions: 326 active listings in the ZIP; 4 comparable units currently listed for rent nearby; rentals lingering (median 46d on market — plan ~5-8 weeks vacancy on turnover, expect pricing pressure); 50% of comp listings sitting > 30 days — soft ceiling on asking rent; 4,709 units permitted in Madison County in 2024 (1,186 in 5+ unit buildings).
Forward outlook
- In year one you build about $17k of equity ($1k loan paydown + $16k appreciation (10.0% local appreciation)).
- Madison County population projected at +18% by 2050 — long-run rental-demand tailwind backs the buy-and-hold thesis.
- By year 3, paydown + projected appreciation supports a ~$43k cash-out refi (75% LTV) — recoverable capital for the next deal without selling this one.
Negotiation context
- It's been on market 53 days — a 3% lower offer ($155k) is reasonable based on typical stale-listing flexibility.
- 4 sale attempts since 2y ago; this cycle's ask has dropped $10k (6%) from the opening price — seller is motivated, your offer sets the floor, not the list.
- Current owner paid $12k; list at $160k implies a 1291% gain — meaningful room to come down on a strong offer.
Risks & watch-outs
- Climate carrying-cost: extreme-heat days projected 7→19/yr by 2055 (HVAC capex compounding) — expect insurance premiums to compound above CPI over the hold.
Questions for the listing agent
- What do current leases actually rent for vs. the listed asking? Can we see a recent rent roll and the last 12 months of T-12 income?
- It's been on market 53 days. Have you received any prior offers? Is the seller open to a 33% concession, seller financing, or rate buy-down credit?
- Is there a deadline driving the sale (1031 exchange, divorce, estate, relocation)? That informs how much negotiation room exists.
- The area grade is low — what's the realistic commute time and amenity access for the typical tenant pool here? Any planned neighborhood developments (good or bad) we should know about?
- What's the average days-on-market for RENTAL listings here right now (not sales)? A rising rental-DOM trend means longer vacancies and softer asking-rent achievability than the comps imply.
- What's the recent tenant-quality profile in this submarket — average credit score on applications, eviction rate, late-payment / NSF rate, and stable-employment percentage? A property-management company in the area should have these aggregated.
- How much new for-sale + rental construction is in the pipeline within 1–3 miles? Heavy new supply typically softens prices + rents 12–24 months out; constrained supply supports both.
Investment metrics
- 1% rule
- 0.67% ✗
- Cap rate
- 4.30%
- Cash-on-cash
- -7.10%
- DSCR
- 0.68
- GRM
- 12.5
CMA / ARV
No comps found within radius.
Projected returns pro-forma
10.0% appreciation · 3.0% rent growth · sell at horizon
- IRR
- 19.3%
- Equity multiple
- 2.57×
- Total profit
- $70,274
- Equity at exit
- $144,141
- IRR
- 17.8%
- Equity multiple
- 5.92×
- Total profit
- $220,253
- Equity at exit
- $310,845
Cash invested: $44,800 (down + closing). Projections, not guarantees.
Landlord ↔ Tenant lean methodology
- Overall (STATE)
- 90 Strongly Landlord-Friendly
- State Alabama
- 90 Strongly Landlord-Friendly · R+15
- County
- — inherits STATE
- City
- — inherits STATE
ZIP-level market 35773
- Home prices YoY
- 28.8%
- Active inventory
- 326
- Price-to-rent
- 12.5×
Monthly cashflow live
- Estimated rent
- $1,064 medium interval (Pro) →
- Mortgage (P&I)
- −$839
- Tax est. 1.5%
- −$200 /mo · $2,400/yr
- Insurance
- −$67
- HOA
- −$0
- Lot rent leased land?
- −$0
- Vacancy / Maint / Mgmt
- −$223
- Net cashflow
- $-265
Break-even live
Sensitivity live
| Price | -10% $-154 | -5% $-210 | +0% $-265 | +5% $-320 | +10% $-376 |
|---|---|---|---|---|---|
| Rent | -10% $-349 | -5% $-307 | +0% $-265 | +5% $-223 | +10% $-181 |
| Rate | -1.0pp $-184 | -0.5pp $-224 | base $-265 | +0.5pp $-307 | +1.0pp $-349 |
UW: 25.0% down · 7.5% · 30yr · 1.5% tax · 5.0% vac · 8.0% maint · 8.0% mgmt
Financing live
Cash to close
- Down payment
- $40,000
- Closing costs
- $4,800
- Reserves months
- —
- Total cash needed
- —
Loan-product check · same deal, 3 products live
Conventional
25% down · 7.5% · 30yr
- Down + closing
- —
- Monthly P&I
- —
- Monthly cashflow
- —
- DSCR
- —
- Eligible?
- —
Personal DTI + credit; lowest rate.
DSCR
20% down · 8.5% · 30yr
- Down + closing
- —
- Monthly P&I
- —
- Monthly cashflow
- —
- DSCR
- —
- Eligible?
- —
No personal income docs; deal must DSCR.
Hard money
10% down · 12.0% · 12mo
- Down + closing
- —
- Monthly P&I
- —
- Monthly cashflow
- —
- DSCR
- —
- Eligible?
- —
Short-term bridge; refi at stabilization.
Rent comps 4 comps
| Address | Beds | Baths | Sqft | Rent | $/sqft | DOM | Units | Dist |
|---|---|---|---|---|---|---|---|---|
| 110 Fox Haven Ln Toney, AL | 3.0 | 2.0 | 1392 | $1,450 | $1.04 | 46d | 1 | 0.10mi |
| 2460 Ready Section Rd Toney, AL | 4.0 | 2.0 | 1519 | $1,499 | $0.99 | 23d | 1 | 0.64mi |
| 1358 Carter Grove Rd Unit 1358 A Hazel Green, AL | 3.0 | 2.0 | 1233 | $700 | $0.57 | 25d | 1 | 0.68mi |
| 124 Angie Dr Toney, AL | 3.0 | 2.0 | 1960 | $1,394 | $0.71 | 46d | 1 | 1.46mi |
Listing history 27 events
-
2026-06-22statusdays on market $160,000 Pending 53 DOM
-
2026-06-18days on market $160,000 Active 52 DOM
-
2026-06-17days on market $160,000 Active 51 DOM
-
2026-06-16days on market $160,000 Active 50 DOM
-
2026-06-15days on market $160,000 Active 49 DOM
-
2026-06-14days on market $160,000 Active 47 DOM
-
2026-06-10days on market $160,000 Active 44 DOM
-
2026-06-09days on market $160,000 Active 43 DOM
-
2026-06-08days on market $160,000 Active 42 DOM
-
2026-06-07days on market $160,000 Active 41 DOM
-
2026-06-02days on market $160,000 Active 36 DOM
-
2026-06-01days on market $160,000 Active 35 DOM
-
2026-05-31days on market $160,000 Active 34 DOM
-
2026-05-30days on market $160,000 Active 33 DOM
-
2026-05-07price $165,000 251-char remark
-
2026-04-27$170,000 Active 251-char remark
-
2025-01-23status Active
-
2025-01-10historical
-
2025-01-08status Active
-
2024-12-10historical
-
2024-11-30status Pending
-
2024-11-11price $165,000
-
2024-10-19price $170,000
-
2024-09-27price $175,000
-
2024-09-07price $190,000
-
2024-08-25$200,000 Active
-
2016-11-29soldstatus $11,500
ⓘ Source: listings_history table (triggers on properties + properties_extension) + one-shot
backfill from property_details.listing_events for pre-trigger history.
Climate risk First Street
- Flood 1/10 Low FEMA zone X (unshaded) · 0% chance over 30 yrs
- Wildfire 4/10 Moderate
- Heat 5/10 Major 7 d/yr ≥104°F today · 19 d/yr by 30 yrs out
- Wind 4/10 Moderate 18% chance of damaging wind over 30 yrs
- Air quality 1/10 Low 0 unhealthy d/yr today · 0 by 30 yrs out
Nearby sold comps map
Loading sold comps map…
Walkable amenities ~0.75 mi
Loading nearby amenities…
Taxation est. · year 1
- Rental income
- $12,769
- − Mortgage interest
- −$8,962
- − Property taxes
- −$2,400
- − Insurance
- −$800
- − Repairs & maintenance
- −$1,022
- − Management
- −$1,022
- − Depreciation
- −$4,655
- Taxable loss
- −$6,091
- Est. tax savings @ 24.0%
- +$1,462
- After-tax cash flow
- $-1,719/yr
For passive investors: Depreciation is non-cash, so a rental often shows a tax loss while cash-flowing — sheltering income. Rental losses are passive: they offset passive income freely, and up to $25,000/yr can offset ordinary (W-2) income if you actively participate and your MAGI is under $100k (phasing out to $0 by $150k); unused losses carry forward. On sale, claimed depreciation is recaptured at up to 25%, and gains may owe capital-gains tax (a 1031 exchange can defer both). Figures are a year-1 estimate at your 24.0% rate — not tax advice; consult a CPA.
Schools (NCES district)
- District
- Madison County
- NCES district ID
- 0102220
- Math proficiency
- 27% ▼ -32.00%
- Reading proficiency
- 56% ▼ -1.00%
- Median HH income
- $66,058
- Composite
- 37.15/100
- National rank
- #4483
- State rank
- #19 of 129 in AL
Livability — Harvest
- Score
- 72/100
- State rank
- #27
- US rank
- #5986
Category grades
Schools grade is shown separately in the Schools card above.
Census & demographics
- City population
- 30,710
- Population (ZIP)
- 13,977
Population outlook (Madison County) Hauer SSP2
- Today (2025)
- 392,086 people
- By 2030
- 409,788 · +4.5%
- By 2040
- 440,557 · +12.4%
- By 2050
- 460,990 · +17.6%
- By 2075
- 502,872 · +28.3%
- By 2100
- 513,623 · +31.0%
Race, ethnicity, and origin ACS 2023
- Neighborhood character
- Predominantly White (72%)
- Race & ethnicity
- White 72% Black 17% Hispanic / Latino 7% Two or more races 3% Asian 2%
- Hispanic origin (detail)
- Mexican 5%
- Common ancestry
- Italian 3% Slovak 1% Serbian 1%
- Foreign-born
- 2% · Canada
- Languages at home
- 95% English-only · Spanish 4%
Political lean MEDSL · Madison
- 2024 margin
- Lean R (+9.0) · D 44.7% · R 53.7% · Other 1.6%
- 2008→2024 swing
- +6.0pp toward D · 2008: -14.9pp · 2024: -9.0pp
- All cycles
- 2024: R+9.0 2020: R+8.0 2016: R+16.8 2012: R+18.7 2008: R+14.9
Not yet ingested
- Civics
- —
Market trends
- HPI YoY
- ▲ 149.14%
- Current HPI
- 666.8602
- Rent YoY
- —
- Metro
- —
- State GDP YoY
- ▲ 2.94%
- F500 in state
- 4
Industry mix (Fortune 500 HQ in AL)
| Industry | F500 HQs | Revenue |
|---|---|---|
| Financial Services | 1 | $8B |
|
||
| Healthcare | 1 | $5B |
|
||
Price history
+1291.3% since first listed14 events — show timeline
- 2026-05-27 Price Changed $160,000 VMLS
- 2026-05-07 Price Changed $165,000 VMLS
- 2026-04-27 Listed $170,000 VMLS
- 2025-01-23 Relisted — VMLS
- 2025-01-10 Delisted — VMLS
- 2025-01-08 Relisted — VMLS
- 2024-12-10 Delisted — VMLS
- 2024-11-30 Pending — VMLS
- 2024-11-11 Price Changed $165,000 VMLS
- 2024-10-19 Price Changed $170,000 VMLS
- 2024-09-27 Price Changed $175,000 VMLS
- 2024-09-07 Price Changed $190,000 VMLS
- 2024-08-25 Listed $200,000 VMLS
- 2016-11-29 Sold (Public Records) $11,500 Public Records
Property tax history
+1.6%/yrLatest (2024): $89 · +0.0% YoY. Source: county tax records.
Cash-flow waterfall
monthlySold comps — $/sqft
last 12 mo · ≤1 miLoading sold comps…