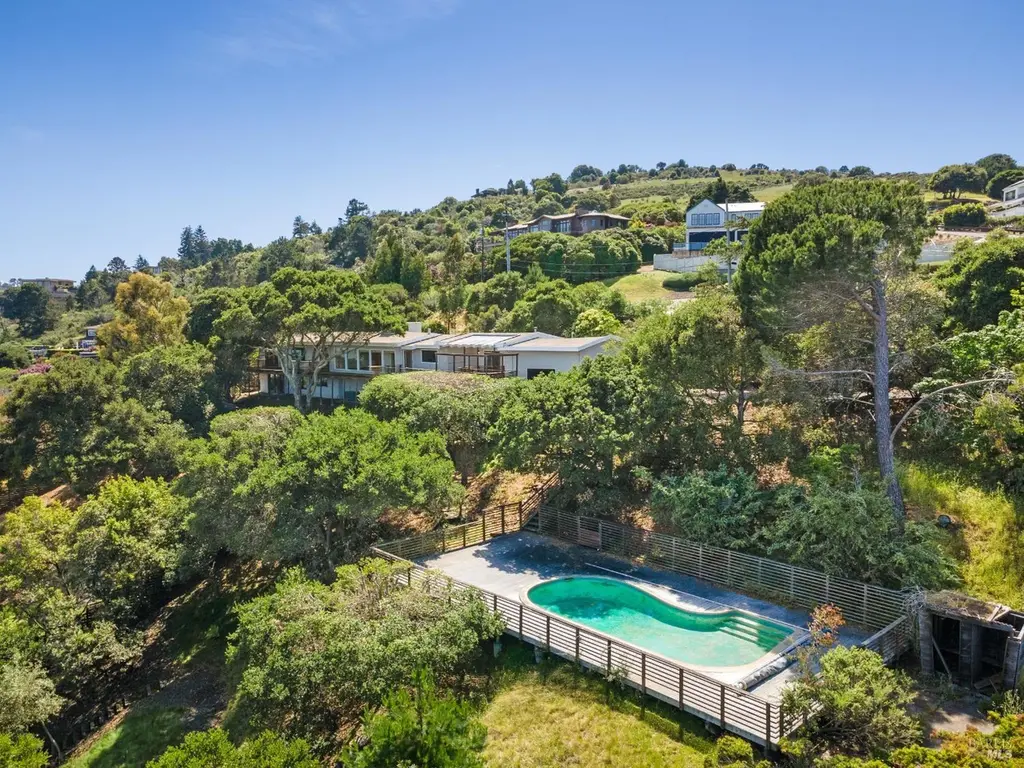
145 Antonette Dr · Tiburon, CA
Flood risk 1/10 · Minimal
- FEMA flood zone
- X (unshaded)
- Chance of flooding over 30 yrs
- 0.0%
- Est. flood insurance / yr
- $507 – $1,088
Fire risk 3/10 · Minor
- Est. fire insurance / yr
- $659 – $1,223
Heat risk 3/10 · Minor
- Hot days now (above 83°F)
- 7 days/yr
- Hot days in 30 yrs
- 16 days/yr
Wind risk 1/10 · Minimal
- Chance of severe wind over 30 yrs
- —
Air-quality risk 8/10 · Major
- Unhealthy air days now
- 13 days/yr
- Unhealthy air days in 30 yrs
- 13 days/yr
Risk factors via First Street. Map © Google.
Why this score? — see what drove the D grade
The composite is a weighted blend of 9 inputs, each scored 0–100. Each bar is that input's sub-score; the figure is the points it added to the 100-point composite (weight × sub-score).
- ARV discount +15.0/15.0
- Appreciation +8.2/10.0
- Schools +6.5/10.0
- Rent growth +3.9/5.0
- Livability +3.5/5.0
- Condition / age +2.5/5.0
- Cash flow +1.7/30.0
- 1% rule +0.0/10.0
- DSCR +0.0/10.0
$2,675,000
🖨 Deal sheet 📄 Offer letter ✓ Due diligence
Listing remarks
Fixer Upper with estate potential! This is a very special place. Quiet & tucked away for privacy. Sunny swimming pool. The almost 1.2 acre lot offers beautiful water views & plenty of space to create your dream yard, gardens, play areas, maybe a sport court or an ADU (check w/ Tiburon Planning). Large 2-car garage. LOTS of parking, which is rare on this side of Tiburon. Remodeled in 1995, its floor plan functions mostly as a one-level home in that the living areas, primary suite, office nook, guest bdm & guest bath are on the main floor. Downstairs is the 3rd bdm, 3rd bath & the unfinished room (potential office, gym, play room?) REPAIRS ARE ONGOING after remediation
Key facts
- One-level home
- Sport court
- Water views
Tags
Property features AI
Finance
- Other: No ADU/second unit; Lot size approximately 1.193 acres; No on-site power production (solar) listed; Located in Tiburon area
- HOA & community: No homeowners association; Not a senior community
Exterior
- Parking: Total of 8 parking spaces; 2-car garage (side-by-side, garage faces front); Guest parking available; Paved driveway
- Security: Smoke detector; Carbon monoxide detector; Fire suppression system; Double-strapped water heater
- Utilities: Public sewer; Internet available; Natural gas connected
- Home design: Single-family residence; Two stories; Property listed as fixer condition
- Construction: Construction details not specified
- Exterior features: Private, dead-end lot; Back-yard fencing; Private in-ground pool with built-in features and pool cover; Decks off family room and living room with views
Interior
- Kitchen: Kitchen (appliances not specified)
- Bedrooms: 3 bedrooms total; Primary suite with balcony, sitting area and multiple walk-in closets
- Flooring: Wood and other flooring
- Bathrooms: 4 bathrooms total (3 full, 1 partial); Primary bathroom with double sinks, tub, shower stall and window
- Heating & cooling: Central heating (natural gas); Central air conditioning
- Interior features: Wood and other flooring; Unfinished basement; Formal dining area; Bonus room, office, storage, family room and living room (both with deck access and views); 1 wood-burning fireplace in the living room; Smoke detector, carbon monoxide detector and fire suppression system; Double-strapped water heater
- Laundry & utility: Washer and dryer included; laundry located inside
Neighborhood map
What this means for you Summary
Snapshot
- This is a 3-bed/4.0-bath single-family listed at $2.67M.
Deal economics
- At list price, monthly cash flow is $-10k ($-123k/yr) — negative.
- To cash-flow at today's rent, offer at most $870k (67.5% below list).
- To meet the 1% rule (rent ≥ 1% of price), the offer needs to be $692k (74.1% below list).
- Recommended offer: $692k (74.1% below list) — sets the bar for 1% rule.
- Cap rate 1.7% vs local median 0.3% in Tiburon — top-decile yield for the area; either an underpriced asset or a hidden risk that comps aren't pricing in. Stress-test before assuming the spread holds.
Location & tenants
- Location reads 69/100 on livability (#247 in CA) — a middle-class / working-renter tenant base. Strengths: schools A+, crime A+, commute A+; Watch: housing C-, amenities F, cost of living F.
- Tamalpais Union High (suburban): math 62% / reading 78% proficiency, ranked #42 of 517 in CA (top 8%) — strong family-tenant draw, lease renewals of 3-5y typical.
- Market conditions: Rents rising fast (+5.5%/yr); 79 active listings in the ZIP; 1 comparable units currently listed for rent nearby; high-income renter base; 149 units permitted in Marin County in 2024 (5 in 5+ unit buildings).
- This rent runs 34% of the median local income ($246k/yr) — at the standard rent-burdened threshold; future hikes will face affordability resistance.
Forward outlook
- In year one you build about $188k of equity ($18k loan paydown + $170k appreciation (6.3% local appreciation)).
- Marin County population projected at +9% by 2050 — modest demand growth; plan on rents tracking national, not racing it.
- By year 2, paydown + projected appreciation supports a ~$301k cash-out refi (75% LTV) — recoverable capital for the next deal without selling this one.
Negotiation context
- It's been on market 17 days — a 2% lower offer ($2.63M) is reasonable based on typical stale-listing flexibility.
Risks & watch-outs
- Watch-outs: built in 1955 — expect roof / HVAC / electrical / plumbing capex.
Questions for the listing agent
- What do current leases actually rent for vs. the listed asking? Can we see a recent rent roll and the last 12 months of T-12 income?
- Built in 1955 — when were the roof, HVAC, electrical panel, plumbing, and water heater last replaced?
- Is there a deadline driving the sale (1031 exchange, divorce, estate, relocation)? That informs how much negotiation room exists.
- Schools are A-rated — typically a magnet for longer-tenancy family renters. What's the average tenant stay here, and is there a school-zone premium baked into asking?
- The area grade is low — what's the realistic commute time and amenity access for the typical tenant pool here? Any planned neighborhood developments (good or bad) we should know about?
- What's the average days-on-market for RENTAL listings here right now (not sales)? A rising rental-DOM trend means longer vacancies and softer asking-rent achievability than the comps imply.
- What's the recent tenant-quality profile in this submarket — average credit score on applications, eviction rate, late-payment / NSF rate, and stable-employment percentage? A property-management company in the area should have these aggregated.
- How much new for-sale + rental construction is in the pipeline within 1–3 miles? Heavy new supply typically softens prices + rents 12–24 months out; constrained supply supports both.
Investment metrics
- 1% rule
- 0.26% ✗
- Cap rate
- 1.71%
- Cash-on-cash
- -16.37%
- DSCR
- 0.27
- GRM
- 32.2
CMA / ARV
- ARV (median comp)
- $3,326,988
- List price
- $2,675,000
- Delta
- -12.98%
- Verdict
- UNDERPRICED
- Comps
- 20 within 1.0 mi
Show comp detail 8 sales within ~0.75 mi
| Address | Dist | Beds/Ba | Sqft | Sold | Price | $/sf | Match |
|---|---|---|---|---|---|---|---|
| 220 Jamaica St | 0.22mi | 4/2.5 (+1) | 3,087 (+1%) | 8mo | $3,450,000 | $1,118 | 70 |
| 228 Trinidad Dr | 0.15mi | 4/3.0 (+1) | 2,702 (-12%) | 12mo | $3,250,000 | $1,203 | 54 |
| 205 Martinique Ave | 0.28mi | 4/2.5 (+1) | 2,808 (-8%) | 12mo | $3,675,000 | $1,309 | 52 |
| 3 Mateo Dr | 0.49mi | 4/3.0 (+1) | 2,831 (-7%) | 14mo | $4,280,000 | $1,512 | 44 |
| 139 Trinidad Dr | 0.36mi | 4/2.5 (+1) | 2,600 (-15%) | 5mo | $2,950,000 | $1,135 | 43 |
| 88 Trinidad Dr | 0.52mi | 3/2.5 | 3,202 (+5%) | 23mo | $2,800,000 | $874 | 42 |
| 94 Trinidad Dr | 0.51mi | 4/3.5 (+1) | 3,436 (+13%) | 12mo | $3,750,000 | $1,091 | 38 |
| 10 Mateo Dr | 0.51mi | 3/2.5 | 2,597 (-15%) | 10mo | $2,300,000 | $886 | 37 |
Match score weights: distance 35% · size 25% · config 20% · recency 20%. Top-matched comps best support the ARV.
Projected returns pro-forma
6.34% appreciation · 5.54% rent growth · sell at horizon
- IRR
- 3.7%
- Equity multiple
- 1.26×
- Total profit
- $192,281
- Equity at exit
- $1,739,118
- IRR
- 6.7%
- Equity multiple
- 2.47×
- Total profit
- $1,099,387
- Equity at exit
- $3,204,670
Cash invested: $749,000 (down + closing). Projections, not guarantees.
Landlord ↔ Tenant lean methodology
- Overall (STATE)
- 18 Strongly Tenant-Friendly
- State California
- 18 Strongly Tenant-Friendly · D+13
- County
- — inherits STATE
- City
- — inherits STATE
ZIP-level market 94920
- Home prices YoY
- 2.4%
- Rents YoY
- 5.5%
- Active inventory
- 79
- Price-to-rent
- 32.2×
Monthly cashflow live
- Estimated rent
- $6,919 medium interval (Pro) →
- Mortgage (P&I)
- −$14,028
- Tax from tax record
- −$539 /mo · $6,465/yr
- Insurance
- −$1,115
- HOA
- −$0
- Vacancy / Maint / Mgmt
- −$1,453
- Net cashflow
- $-10,215
Break-even live
UW: 25.0% down · 7.5% · 30yr · 1.5% tax · 5.0% vac · 8.0% maint · 8.0% mgmt
Financing live
Cash to close
- Down payment
- $668,750
- Closing costs
- $80,250
- Reserves months
- —
- Total cash needed
- —
Loan-product check · same deal, 3 products live
Conventional
25% down · 7.5% · 30yr
- Down + closing
- —
- Monthly P&I
- —
- Monthly cashflow
- —
- DSCR
- —
- Eligible?
- —
Personal DTI + credit; lowest rate.
DSCR
20% down · 8.5% · 30yr
- Down + closing
- —
- Monthly P&I
- —
- Monthly cashflow
- —
- DSCR
- —
- Eligible?
- —
No personal income docs; deal must DSCR.
Hard money
10% down · 12.0% · 12mo
- Down + closing
- —
- Monthly P&I
- —
- Monthly cashflow
- —
- DSCR
- —
- Eligible?
- —
Short-term bridge; refi at stabilization.
Rent comps 1 comps
| Address | Beds | Baths | Sqft | Rent | $/sqft | DOM | Units | Dist |
|---|---|---|---|---|---|---|---|---|
| 5002 Paradise Dr Belvedere Tiburon, CA | 4.0 | 2.5 | 3335 | $17,000 | $5.10 | 43d | 1 | 0.31mi |
Listing history 12 events
-
2026-06-16status $2,675,000 Pending 17 DOM
-
2026-06-15days on market $2,675,000 Active 17 DOM
-
2026-06-13days on market $2,675,000 Active 15 DOM
-
2026-06-13days on market $2,675,000 Active 14 DOM
-
2026-06-09days on market $2,675,000 Active 11 DOM
-
2026-06-08days on market $2,675,000 Active 10 DOM
-
2026-06-07days on market $2,675,000 Active 9 DOM
-
2026-06-04days on market $2,675,000 Active 6 DOM
-
2026-06-03days on market $2,675,000 Active 5 DOM
-
2026-06-02days on market $2,675,000 Active 4 DOM
-
2026-06-01days on market $2,675,000 Active 3 DOM
-
2026-05-31days on market $2,675,000 Active 2 DOM
ⓘ Source: listings_history table (triggers on properties + properties_extension) + one-shot
backfill from property_details.listing_events for pre-trigger history.
Tax reassessment forecast CA · Resets to sale price
- Current annual tax
- $6,465 · $539/mo
- Projected year-2 tax
- $20,330 · $1,694/mo
- Expected delta
- +$13,865/yr (+$1,155/mo · 214.5%)
ⓘ Screening estimate from a state-policy table — verify with the county assessor before closing.
Climate risk First Street
- Flood 1/10 Low FEMA zone X (unshaded) · 0% chance over 30 yrs
- Wildfire 3/10 Moderate
- Heat 3/10 Moderate 7 d/yr ≥83°F today · 16 d/yr by 30 yrs out
- Wind 1/10 Low
- Air quality 8/10 Severe 13 unhealthy d/yr today · 13 by 30 yrs out
Nearby sold comps map
Loading sold comps map…
Walkable amenities ~0.75 mi
Loading nearby amenities…
Taxation est. · year 1
- Rental income
- $83,029
- − Mortgage interest
- −$149,842
- − Property taxes
- −$6,465
- − Insurance
- −$13,375
- − Repairs & maintenance
- −$6,642
- − Management
- −$6,642
- − Depreciation
- −$77,818
- Taxable loss
- −$177,756
- Est. tax savings @ 24.0%
- +$42,661
- After-tax cash flow
- $-79,922/yr
For passive investors: Depreciation is non-cash, so a rental often shows a tax loss while cash-flowing — sheltering income. Rental losses are passive: they offset passive income freely, and up to $25,000/yr can offset ordinary (W-2) income if you actively participate and your MAGI is under $100k (phasing out to $0 by $150k); unused losses carry forward. On sale, claimed depreciation is recaptured at up to 25%, and gains may owe capital-gains tax (a 1031 exchange can defer both). Figures are a year-1 estimate at your 24.0% rate — not tax advice; consult a CPA.
Schools (NCES district)
- District
- Tamalpais Union High
- NCES district ID
- 0638790
- Math proficiency
- 62% ▲ 4.00%
- Reading proficiency
- 78% ▲ 6.00%
- Median HH income
- $106,037
- Composite
- 64.66/100
- National rank
- #527
- State rank
- #42 of 517 in CA
Livability — Tiburon
- Score
- 69/100
- State rank
- #247
- US rank
- #8251
Category grades
Schools grade is shown separately in the Schools card above.
Census & demographics
- Census place
- Tiburon, CA
- County
- Marin County · 243,328 people
- City population
- 12,609
- Metro
- San Francisco-Oakland-Berkeley, CA
- Population (ZIP)
- 12,609
- Household income
- $246,045
- Rent vs Own
- Severe rent burden
- 461.0
Population outlook (Marin County) Hauer SSP2
- Today (2025)
- 276,379 people
- By 2030
- 282,942 · +2.4%
- By 2040
- 292,937 · +6.0%
- By 2050
- 300,449 · +8.7%
- By 2075
- 316,946 · +14.7%
- By 2100
- 303,948 · +10.0%
Race, ethnicity, and origin ACS 2023
- Neighborhood character
- Predominantly White (81%)
- Race & ethnicity
- White 81% Asian 8% Two or more races 7% Hispanic / Latino 5%
- Hispanic origin (detail)
- Mexican 2%
- Common ancestry
- Italian 4% Slovak 4% Scotch-Irish 4%
- Foreign-born
- 22% · Canada, South Korea, China
- Languages at home
- 80% English-only · Other Indo-European 6% Spanish 3% Russian/Polish/Slavic 3%
Political lean MEDSL · Marin
- 2024 margin
- Solid D (+63.9) · D 80.6% · R 16.7% · Other 2.7%
- 2008→2024 swing
- +6.2pp toward D · 2008: 57.7pp · 2024: 63.9pp
- All cycles
- 2024: D+63.9 2020: D+66.5 2016: D+62.9 2012: D+50.5 2008: D+57.7
Not yet ingested
- Civics
- —
Market trends
- HPI YoY
- ▲ 6.34%
- Current HPI
- 265.9709
- Rent YoY
- ▲ 5.54%
- Metro
- San Francisco-Oakland-Berkeley, CA
- State GDP YoY
- ▲ 3.21%
- F500 in state
- 116
Industry mix (Fortune 500 HQ in CA)
| Industry | F500 HQs | Revenue |
|---|---|---|
| Technology | 27 | $1,492B |
|
||
| Financial Services | 3 | $174B |
|
||
| Retail | 3 | $44B |
|
||
| Insurance | 3 | $26B |
|
||
| Media / Entertainment | 2 | $115B |
|
||
| Pharmaceuticals / Biotech | 2 | $62B |
|
||
Price history
2 events — show timeline
- 2026-06-15 Pending — BAREIS
- 2026-05-29 Listed $2,675,000 BAREIS
Property tax history
+2.6%/yrLatest (2025): $6,465 · +6.4% YoY. Source: county tax records.
Cash-flow waterfall
monthlySold comps — $/sqft
last 12 mo · ≤1 miLoading sold comps…