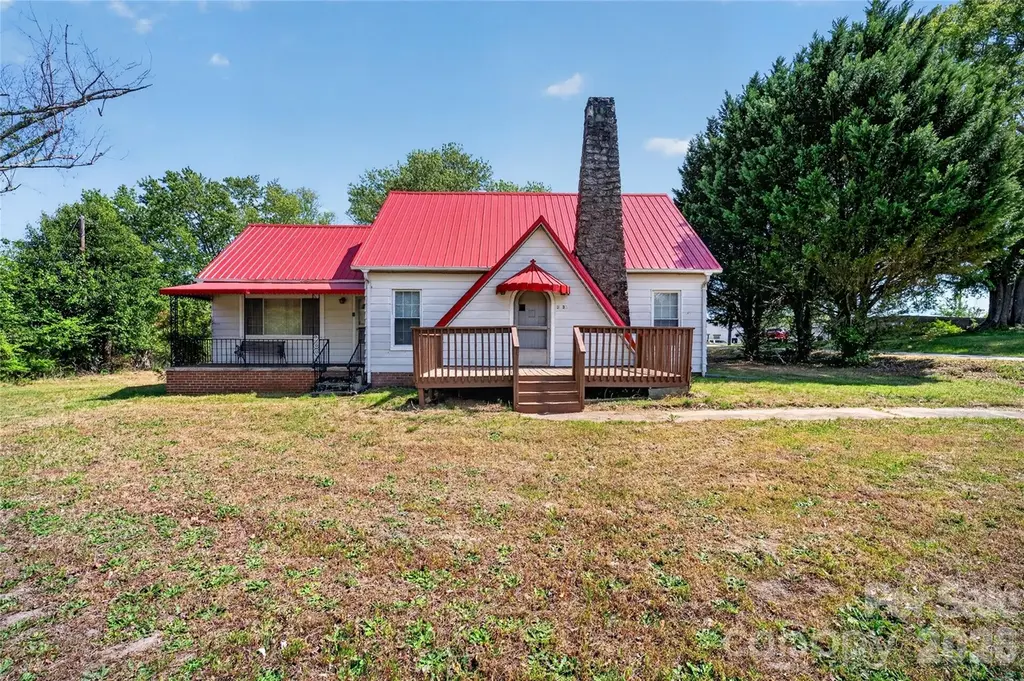
3833 1st Ave SW · Long View, NC
Flood risk 1/10 · Minimal
- FEMA flood zone
- X (unshaded)
- Chance of flooding over 30 yrs
- 0.0%
- Est. flood insurance / yr
- $507 – $1,088
Fire risk 3/10 · Minor
- Est. fire insurance / yr
- $906 – $1,684
Heat risk 5/10 · Moderate
- Hot days now (above 102°F)
- 7 days/yr
- Hot days in 30 yrs
- 18 days/yr
Wind risk 2/10 · Minimal
- Chance of severe wind over 30 yrs
- 2.0%
Air-quality risk 3/10 · Minor
- Unhealthy air days now
- 2 days/yr
- Unhealthy air days in 30 yrs
- 2 days/yr
Risk factors via First Street. Map © Google.
Why this score? — see what drove the C grade
The composite is a weighted blend of 9 inputs, each scored 0–100. Each bar is that input's sub-score; the figure is the points it added to the 100-point composite (weight × sub-score).
- Cash flow +20.7/30.0
- ARV discount +15.0/15.0
- DSCR +6.6/10.0
- 1% rule +4.4/10.0
- Schools +3.8/10.0
- Rent growth +3.5/5.0
- Livability +3.2/5.0
- Condition / age +2.5/5.0
- Appreciation +0.0/10.0
$190,000
🖨 Deal sheet (PDF) 📄 Offer letter ✓ Due diligence
Listing remarks
Charming 1932 home situated on a desirable corner lot! The main home features 3 bedrooms and 1.5 baths, offering classic character with plenty of space. A standout feature is the detached garage with an upstairs living area, complete with 1 bedroom and 1 bath—perfect for guests, rental income, or a private workspace. The property also boasts a new roof installed in 2025, adding peace of mind for future owners. A unique opportunity with versatility and potential—don’t miss it!
Key facts
- Upstairs living area
- New roof
- Detached garage
Tags
Property features AI
Finance
- HOA & community: No HOA
Exterior
- Parking: Driveway; Detached garage (1 garage space); Main level garage present
- Utilities: City water; Public sewer
- Home design: Single-family residential; Site-built construction; One and one-half levels; Second living quarters present
- Construction: Built with aluminum, partial brick, vinyl, and wood materials; Metal roof; Basement foundation
- Exterior features: Corner lot; Publicly maintained road access; Road surfaces include asphalt, dirt, concrete, paved, and other
Interior
- Kitchen: Electric range; Refrigerator
- Bedrooms: Four total bedrooms (2 upper, 1 main, 1 in second living quarters)
- Bathrooms: Two full bathrooms; One half bathroom
- Heating & cooling: Central heating; Other heating (see remarks); Central air conditioning; Window unit(s); Other cooling (see remarks)
- Interior features: Unfinished basement; One room count listed
- Laundry & utility: Laundry on main level
Neighborhood map
What this means for you Summary
Snapshot
- This is a 4-bed/1.0-bath single-family listed at $190k.
Deal economics
- At list price, monthly cash flow is $256 ($3k/yr) — positive.
- The deal already cash-flows at list — no discount required.
- To meet the 1% rule (rent ≥ 1% of price), the offer needs to be $179k (5.9% below list).
- Recommended offer: $179k (5.9% below list) — sets the bar for 1% rule.
Location & tenants
- Location reads 63/100 on livability (#416 in NC) — a middle-class / working-renter tenant base. Strengths: cost of living A+, housing A+, health & safety B; Watch: amenities F, commute F, employment F.
- Burke County Schools (rural): math 43% / reading 47% proficiency, ranked #89 of 178 in NC (top 50%) — families likely to look elsewhere, expect single-tenant / working-renter base with shorter leases.
- Zoned schools: Hildebran Elementary (math 37% / reading 42%, grade F, #694 of 1,410 statewide, top 53%, 320 students, 77% FRL); East Burke Middle (math 43% / reading 54%, grade C-, #127 of 475 statewide, top 28%, 645 students, 71% FRL); East Burke High (math 67% / reading 52%, grade C+, #216 of 535 statewide, top 43%, 879 students, 64% FRL) — zoned schools average 71% FRL vs 52% district-wide (18 pts higher); higher-poverty schools than district average — tighter screening recommended.
- Market conditions: Rents rising fast (+4.2%/yr); 211 active listings in the ZIP; 1 comparable units currently listed for rent nearby; 422 units permitted in Burke County in 2024 (94 in 5+ unit buildings).
- This rent runs 35% of the median local income ($62k/yr) — at the standard rent-burdened threshold; future hikes will face affordability resistance.
Forward outlook
- Local home prices are declining (-3.0%/yr); year-one equity from $1k of loan paydown is wiped out by about $6k of value loss. Plan a longer hold.
- Burke County population projected at -18% by 2050 — secular population decline; favor cash flow + early exit over multi-decade hold.
Negotiation context
- It's been on market 56 days — a 3% lower offer ($184k) is reasonable based on typical stale-listing flexibility.
- 2 sale attempts with the ask held roughly flat each time — persistent listings suggest the price (not the market) is what's stuck; bring a comps-based counter.
- Current owner paid $81k; list at $190k implies a 135% gain — meaningful room to come down on a strong offer.
Risks & watch-outs
- Watch-outs: built in 1932 — expect roof / HVAC / electrical / plumbing capex.
- Climate carrying-cost: extreme-heat days projected 7→18/yr by 2055 (HVAC capex compounding) — expect insurance premiums to compound above CPI over the hold.
Questions for the listing agent
- It's been on market 56 days. Have you received any prior offers? Is the seller open to a 6% concession, seller financing, or rate buy-down credit?
- Built in 1932 — when were the roof, HVAC, electrical panel, plumbing, and water heater last replaced?
- Is there a deadline driving the sale (1031 exchange, divorce, estate, relocation)? That informs how much negotiation room exists.
- Schools are F-rated, which usually means shorter tenancies and higher turnover. Who's the typical renter profile here, and what's been the actual vacancy rate?
- What's the average days-on-market for RENTAL listings here right now (not sales)? A rising rental-DOM trend means longer vacancies and softer asking-rent achievability than the comps imply.
- What's the recent tenant-quality profile in this submarket — average credit score on applications, eviction rate, late-payment / NSF rate, and stable-employment percentage? A property-management company in the area should have these aggregated.
- How much new for-sale + rental construction is in the pipeline within 1–3 miles? Heavy new supply typically softens prices + rents 12–24 months out; constrained supply supports both.
Investment metrics
- 1% rule
- 0.94% ✗
- Cap rate
- 7.91%
- Cash-on-cash
- 5.77%
- DSCR
- 1.26
- GRM
- 8.9
CMA / ARV
- ARV (on-the-fly)
- $239,384
- Comps found
- 12
Show comp detail 12 sales within ~0.75 mi
| Address | Dist | Beds/Ba | Sqft | Sold | Price | $/sf | Match |
|---|---|---|---|---|---|---|---|
| 206 11th St NE | 0.27mi | 3/2.0 (-1) | 1,330 (+2%) | 3mo | $195,000 | $147 | 72 |
| 515 37th St SW | 0.34mi | 3/1.0 (-1) | 1,313 (+1%) | 12mo | $221,000 | $168 | 68 |
| 330 33rd St SW | 0.26mi | 3/1.0 (-1) | 1,370 (+5%) | 11mo | $129,000 | $94 | 65 |
| 400 37th St SW | 0.26mi | 3/2.0 (-1) | 1,392 (+7%) | 11mo | $120,000 | $86 | 58 |
| 1013 37th St SW | 0.60mi | 3/2.0 (-1) | 1,300 (-0%) | 9mo | $274,500 | $211 | 55 |
| 925 37th St SW | 0.56mi | 3/1.5 (-1) | 1,250 (-4%) | 10mo | $200,000 | $160 | 52 |
| 1225 39th Street Cir SW | 0.68mi | 3/2.0 (-1) | 1,260 (-3%) | 2mo | $259,000 | $206 | 52 |
| 103 Pine Meadows Cir | 0.63mi | 3/2.0 (-1) | 1,290 (-1%) | 11mo | $265,000 | $205 | 51 |
| 202 Pine Meadows St | 0.67mi | 3/2.0 (-1) | 1,264 (-3%) | 10mo | $260,000 | $206 | 46 |
| 3119 6th Ave SW | 0.54mi | 3/1.5 (-1) | 1,179 (-9%) | 11mo | $225,000 | $191 | 44 |
| 408 29th Street Pl SW | 0.58mi | 3/2.5 (-1) | 1,471 (+13%) | 8mo | $270,000 | $184 | 33 |
| 937 37th St SW | 0.56mi | 3/2.5 (-1) | 1,475 (+13%) | 10mo | $269,000 | $182 | 32 |
Match score weights: distance 35% · size 25% · config 20% · recency 20%. Top-matched comps best support the ARV.
Projected returns pro-forma
-3.0% appreciation · 4.16% rent growth · sell at horizon
- IRR
- -6.2%
- Equity multiple
- 0.77×
- Total profit
- $-12,448
- Equity at exit
- $28,330
- IRR
- 4.6%
- Equity multiple
- 1.35×
- Total profit
- $18,737
- Equity at exit
- $16,428
Cash invested: $53,200 (down + closing). Projections, not guarantees.
Landlord ↔ Tenant lean methodology
- Overall (STATE)
- 85 Strongly Landlord-Friendly
- State North Carolina
- 85 Strongly Landlord-Friendly · R+3
- County
- — inherits STATE
- City
- — inherits STATE
ZIP-level market 28602
- Home prices YoY
- -13.6%
- Rents YoY
- 4.2%
- Active inventory
- 211
- Price-to-rent
- 8.9×
Monthly cashflow live
- Estimated rent
- $1,788 medium interval (Pro) →
- Mortgage (P&I)
- −$996
- Tax from tax record
- −$81 /mo · $975/yr
- Insurance
- −$79
- HOA
- −$0
- Vacancy / Maint / Mgmt
- −$376
- Net cashflow
- $256
Break-even live
Sensitivity live
| Price | -10% $363 | -5% $310 | +0% $256 | +5% $202 | +10% $148 |
|---|---|---|---|---|---|
| Rent | -10% $115 | -5% $185 | +0% $256 | +5% $327 | +10% $397 |
| Rate | -1.0pp $352 | -0.5pp $304 | base $256 | +0.5pp $207 | +1.0pp $157 |
UW: 25.0% down · 7.5% · 30yr · 1.5% tax · 5.0% vac · 8.0% maint · 8.0% mgmt
Financing live
Cash to close
- Down payment
- $47,500
- Closing costs
- $5,700
- Reserves months
- —
- Total cash needed
- —
Loan-product check · same deal, 3 products live
Conventional
25% down · 7.5% · 30yr
- Down + closing
- —
- Monthly P&I
- —
- Monthly cashflow
- —
- DSCR
- —
- Eligible?
- —
Personal DTI + credit; lowest rate.
DSCR
20% down · 8.5% · 30yr
- Down + closing
- —
- Monthly P&I
- —
- Monthly cashflow
- —
- DSCR
- —
- Eligible?
- —
No personal income docs; deal must DSCR.
Hard money
10% down · 12.0% · 12mo
- Down + closing
- —
- Monthly P&I
- —
- Monthly cashflow
- —
- DSCR
- —
- Eligible?
- —
Short-term bridge; refi at stabilization.
Rent comps 1 comps
| Address | Beds | Baths | Sqft | Rent | $/sqft | DOM | Units | Dist |
|---|---|---|---|---|---|---|---|---|
| 823 31st St SW Hickory, NC | 3.0 | 2.5 | 1335 | $1,775 | $1.33 | 22d | 1 | 0.65mi |
Listing history 20 events
-
2026-06-19days on market $190,000 Active 56 DOM
-
2026-06-18days on market $190,000 Active 55 DOM
-
2026-06-17days on market $190,000 Active 54 DOM
-
2026-06-16days on market $190,000 Active 53 DOM
-
2026-06-15days on market $190,000 Active 52 DOM
-
2026-06-14days on market $190,000 Active 50 DOM
-
2026-06-13days on market $190,000 Active 49 DOM
-
2026-06-10days on market $190,000 Active 47 DOM
-
2026-06-09days on market $190,000 Active 46 DOM
-
2026-06-08days on market $190,000 Active 45 DOM
-
2026-06-07days on market $190,000 Active 44 DOM
-
2026-06-05days on market $190,000 Active 41 DOM
-
2026-06-02days on market $190,000 Active 39 DOM
-
2026-06-01days on market $190,000 Active 38 DOM
-
2026-05-31days on market $190,000 Active 37 DOM
-
2026-05-30days on market $190,000 Active 36 DOM
-
2026-05-23status Active
-
2026-05-11historical Active Under Contract
-
2026-04-24$190,000 Active
-
2007-08-09soldstatus $81,000
ⓘ Source: listings_history table (triggers on properties + properties_extension) + one-shot
backfill from property_details.listing_events for pre-trigger history.
Tax reassessment forecast NC · Resets to sale price
- Current annual tax
- $975 · $81/mo
- Projected year-2 tax
- $1,558 · $130/mo
- Expected delta
- +$583/yr (+$49/mo · 59.8%)
ⓘ Screening estimate from a state-policy table — verify with the county assessor before closing.
Climate risk First Street
- Flood 1/10 Low FEMA zone X (unshaded) · 0% chance over 30 yrs
- Wildfire 3/10 Moderate
- Heat 5/10 Major 7 d/yr ≥102°F today · 18 d/yr by 30 yrs out
- Wind 2/10 Low 2% chance of damaging wind over 30 yrs
- Air quality 3/10 Moderate 2 unhealthy d/yr today · 2 by 30 yrs out
Nearby sold comps map
Loading sold comps map…
Walkable amenities ~0.75 mi
Loading nearby amenities…
Taxation est. · year 1
- Rental income
- $21,459
- − Mortgage interest
- −$10,643
- − Property taxes
- −$975
- − Insurance
- −$950
- − Repairs & maintenance
- −$1,717
- − Management
- −$1,717
- − Depreciation
- −$5,527
- Taxable loss
- −$70
- Est. tax savings @ 24.0%
- +$17
- After-tax cash flow
- $3,088/yr
For passive investors: Depreciation is non-cash, so a rental often shows a tax loss while cash-flowing — sheltering income. Rental losses are passive: they offset passive income freely, and up to $25,000/yr can offset ordinary (W-2) income if you actively participate and your MAGI is under $100k (phasing out to $0 by $150k); unused losses carry forward. On sale, claimed depreciation is recaptured at up to 25%, and gains may owe capital-gains tax (a 1031 exchange can defer both). Figures are a year-1 estimate at your 24.0% rate — not tax advice; consult a CPA.
Schools (NCES district)
- District
- Burke County Schools
- NCES district ID
- 3700480
- Math proficiency
- 43% ▼ -2.00%
- Reading proficiency
- 47% ▬ 0.00%
- Median HH income
- $38,342
- Composite
- 37.51/100
- National rank
- #4400
- State rank
- #89 of 178 in NC
Livability — Long View
- Score
- 63/100
- State rank
- #416
- US rank
- #15606
Category grades
Schools grade is shown separately in the Schools card above.
Census & demographics
- Census place
- Long View, NC
- County
- Catawba County · 105,763 people
- City population
- 84,442
- Metro
- Hickory-Lenoir-Morganton, NC
- Population (ZIP)
- 31,113
- Household income
- $62,048
- Rent vs Own
- Severe rent burden
- 642.0
Population outlook (Burke County) Hauer SSP2
- Today (2025)
- 86,552 people
- By 2030
- 84,123 · -2.8%
- By 2040
- 78,165 · -9.7%
- By 2050
- 71,099 · -17.9%
- By 2075
- 56,264 · -35.0%
- By 2100
- 44,742 · -48.3%
Race, ethnicity, and origin ACS 2023
- Neighborhood character
- Predominantly White (70%)
- Race & ethnicity
- White 70% Black 12% Hispanic / Latino 10% Two or more races 7% Asian 6%
- Hispanic origin (detail)
- Mexican 7%
- Common ancestry
- Slovak 3% Italian 3% Iranian 2%
- Foreign-born
- 6% · Canada, Dominican Republic
- Languages at home
- 88% English-only · Spanish 7% Other Asian/Pacific 4%
Political lean MEDSL · Burke
- 2024 margin
- Solid R (+41.2) · D 29.0% · R 70.3%
- 2008→2024 swing
- -22.0pp toward R · 2008: -19.2pp · 2024: -41.2pp
- All cycles
- 2024: R+41.2 2020: R+40.1 2016: R+39.4 2012: R+23.6 2008: R+19.2
Not yet ingested
- Civics
- —
Market trends
- HPI YoY
- ▼ -41.01%
- Current HPI
- 259.947
- Rent YoY
- ▲ 4.16%
- Metro
- Hickory-Lenoir-Morganton, NC
- State GDP YoY
- ▲ 3.28%
- F500 in state
- 26
Industry mix (Fortune 500 HQ in NC)
| Industry | F500 HQs | Revenue |
|---|---|---|
| Financial Services | 2 | $213B |
|
||
| Retail | 2 | $95B |
|
||
| Industrial Conglomerate | 1 | $38B |
|
||
| Metals / Steel | 1 | $35B |
|
||
| Utilities | 1 | $30B |
|
||
| Industrial Machinery | 1 | $19B |
|
||
Price history
+134.6% since first listed4 events — show timeline
- 2026-05-23 Relisted — CANOPYMLS as Distributed by MLS Grid
- 2026-05-11 Contingent — CANOPYMLS as Distributed by MLS Grid
- 2026-04-24 Listed $190,000 CANOPYMLS as Distributed by MLS Grid
- 2007-08-09 Sold (Public Records) $81,000 Public Records
Property tax history
+1.1%/yrLatest (2025): $975 · -1.4% YoY. Source: county tax records.
Cash-flow waterfall
monthlySold comps — $/sqft
last 12 mo · ≤1 miLoading sold comps…