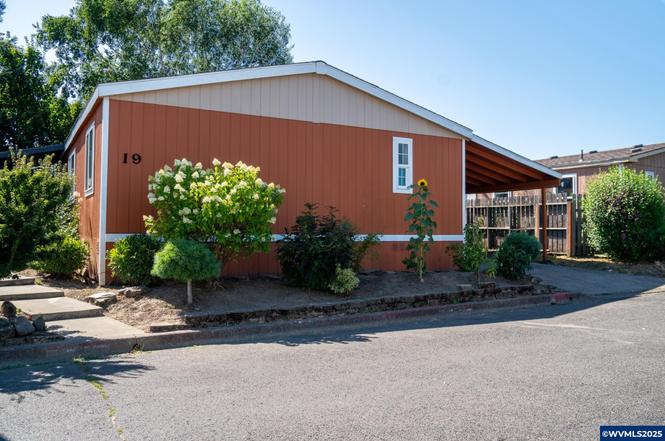
300 S Everest Rd #19 · Newberg, OR
Flood risk 1/10 · Minimal
- FEMA flood zone
- X (unshaded)
- Chance of flooding over 30 yrs
- 0.0%
- Est. flood insurance / yr
- $507 – $1,088
Fire risk 2/10 · Minimal
- Est. fire insurance / yr
- $498 – $926
Heat risk 3/10 · Minor
- Hot days now (above 92°F)
- 7 days/yr
- Hot days in 30 yrs
- 14 days/yr
Wind risk 1/10 · Minimal
- Chance of severe wind over 30 yrs
- —
Air-quality risk 8/10 · Major
- Unhealthy air days now
- 10 days/yr
- Unhealthy air days in 30 yrs
- 11 days/yr
Risk factors via First Street. Map © Google.
Why this score? — see what drove the B- grade
The composite is a weighted blend of 9 inputs, each scored 0–100. Each bar is that input's sub-score; the figure is the points it added to the 100-point composite (weight × sub-score).
- Cash flow +30.0/30.0
- 1% rule +10.0/10.0
- DSCR +10.0/10.0
- ARV discount +6.9/15.0
- Livability +3.8/5.0
- Schools +3.4/10.0
- Condition / age +2.8/5.0
- Rent growth +2.6/5.0
- Appreciation +0.0/10.0
$130,000
🖨 Deal sheet 📄 Offer letter ✓ Due diligence
Listing remarks
Seller Motivated! Beautifully updated 3 bed, 2 bath home in Newberg’s most affordable park! Features new siding, windows, LVP flooring, & fresh sheetrock throughout. The bright, open layout offers comfort & functionality. Enjoy a spacious backyard perfect for relaxing, gardening, or entertaining. Includes a carport and large enclosed storage area. Conveniently located near schools and shopping. A rare find with the lowest park rent in Newberg! Seller offering a $500 credit which could be used towards paint!
Key facts
- New siding
- Spacious backyard
- Fresh sheetrock
Tags
Property features AI
Finance
- Other: Seller offering $500 credit (per listing remarks)
- HOA & community: Park: Sunrise Estates; Lowest park rent in Newberg (per listing remarks)
Exterior
- Parking: Carport; 1 garage space
- Utilities: City water; City sewer; Electric water heater; Electric power available
- Home design: Double wide mobile home; Built in 1995; T111 siding style; Wood siding; Composition roof; Located in Sunrise Estates (not an adult park)
- Construction: Wood construction
- Exterior features: Fenced yard; Landscaped yard; Enclosed storage area
Interior
- Kitchen: Dishwasher; Electric range
- Bedrooms: 3 bedrooms
- Flooring: Tile; Luxury vinyl plank
- Bathrooms: 2 bathrooms
- Heating & cooling: Electric forced-air heating
- Interior features: Tile and luxury vinyl plank flooring; High-speed communication available; Dining area (combination)
- Laundry & utility: Electric water heater
Neighborhood map
What this means for you Summary
Snapshot
- This is a 3-bed/2.0-bath manufactured listed at $130k. Condition is rated average.
Deal economics
- At list price, monthly cash flow is $727 ($9k/yr) — positive.
- The deal already cash-flows at list — no discount required.
- Meets the 1% rule at list price ($2k rent vs $130k).
- Recommended offer: $114k (12.0% below list) — sets the bar for market timing.
- Cap rate 13.0% vs local median 2.4% in Newberg — top-decile yield for the area; either an underpriced asset or a hidden risk that comps aren't pricing in. Stress-test before assuming the spread holds.
Location & tenants
- Location reads 76/100 on livability (#77 in OR, #3,395 nationally) — a middle-class / working-renter tenant base. Strengths: amenities A+, employment A+, housing A+; Watch: cost of living D, commute F.
- Newberg SD 29J (town): math 30% / reading 45% proficiency, ranked #17 of 58 in OR (top 29%) — families likely to look elsewhere, expect single-tenant / working-renter base with shorter leases.
- Zoned schools: Mabel Rush Elementary School (math 44% / reading 44%, grade F, #143 of 412 statewide, top 38%, 389 students, 38% FRL); Newberg Senior High School (math 24% / reading 74%, grade D, #50 of 143 statewide, top 37%, 1,389 students, 31% FRL) — zoned schools at 34% FRL track the district average.
- Market conditions: Rents flat; 230 active listings in the ZIP; 32 comparable units currently listed for rent nearby; rentals at typical pace (median 17d on market — plan ~3-4 weeks tenant-placement turnaround); solid renter incomes; 282 units permitted in Yamhill County in 2024 (0 in 5+ unit buildings).
Forward outlook
- Local home prices are declining (-3.0%/yr); year-one equity from $899 of loan paydown is wiped out by about $4k of value loss. Plan a longer hold.
- Yamhill County population projected at +8% by 2050 — modest demand growth; plan on rents tracking national, not racing it.
- At projected returns (-3.0% appreciation + 0.6% rent growth), your $36k cash investment doubles in ~6 years — after that, you're playing with house money.
Negotiation context
- It's been on market 336 days — a 12% lower offer ($114k) is reasonable based on typical stale-listing flexibility.
Questions for the listing agent
- It's been on market 336 days. Have you received any prior offers? Is the seller open to a 12% concession, seller financing, or rate buy-down credit?
- Why hasn't it sold? Are there any deal-killer items the seller is aware of (foundation, flood, title, zoning, code violations)?
- Is there a deadline driving the sale (1031 exchange, divorce, estate, relocation)? That informs how much negotiation room exists.
- Schools are B-rated — typically a magnet for longer-tenancy family renters. What's the average tenant stay here, and is there a school-zone premium baked into asking?
- What's the average days-on-market for RENTAL listings here right now (not sales)? A rising rental-DOM trend means longer vacancies and softer asking-rent achievability than the comps imply.
- What's the recent tenant-quality profile in this submarket — average credit score on applications, eviction rate, late-payment / NSF rate, and stable-employment percentage? A property-management company in the area should have these aggregated.
- How much new for-sale + rental construction is in the pipeline within 1–3 miles? Heavy new supply typically softens prices + rents 12–24 months out; constrained supply supports both.
Investment metrics
- 1% rule
- 1.58% ✓
- Cap rate
- 13.00%
- Cash-on-cash
- 23.97%
- DSCR
- 2.07
- GRM
- 5.3
CMA / ARV
- ARV (on-the-fly)
- $128,304
- Comps found
- 9
Show comp detail 9 sales within ~0.75 mi
| Address | Dist | Beds/Ba | Sqft | Sold | Price | $/sf | Match |
|---|---|---|---|---|---|---|---|
| 300 S Everest St #44 | 0.05mi | 3/2.0 | 1,080 (-9%) | 4mo | $116,250 | $108 | 79 |
| 2901 E 2nd St #60 | 0.57mi | 3/2.0 | 1,152 (-3%) | 4mo | $95,000 | $82 | 64 |
| 2902 E 2nd St #95 | 0.58mi | 2/2.0 (-1) | 1,200 (+1%) | 8mo | $172,000 | $143 | 60 |
| 2901 E 2nd St #47 | 0.57mi | 2/2.0 (-1) | 1,152 (-3%) | 9mo | $119,900 | $104 | 56 |
| 1000 S Mckern Ct #20 | 0.74mi | 3/2.0 | 1,188 (0%) | 11mo | $135,000 | $114 | 56 |
| 1000 S Mckern Ct #10 | 0.74mi | 3/2.0 | 1,296 (+9%) | 0mo | $115,000 | $89 | 50 |
| 2902 E 2nd St #67 | 0.54mi | 3/2.0 | 1,344 (+13%) | 4mo | $85,000 | $63 | 50 |
| 2901 E 2nd St #123 | 0.57mi | 2/2.0 (-1) | 1,152 (-3%) | 18mo | $158,000 | $137 | 48 |
| 1000 S Mckern Ct #2 | 0.74mi | 3/2.0 | 1,080 (-9%) | 22mo | $137,000 | $127 | 32 |
Match score weights: distance 35% · size 25% · config 20% · recency 20%. Top-matched comps best support the ARV.
Projected returns pro-forma
-3.0% appreciation · 0.55% rent growth · sell at horizon
- IRR
- 14.4%
- Equity multiple
- 1.56×
- Total profit
- $20,320
- Equity at exit
- $19,383
- IRR
- 21.2%
- Equity multiple
- 2.60×
- Total profit
- $58,104
- Equity at exit
- $11,240
Cash invested: $36,400 (down + closing). Projections, not guarantees.
Landlord ↔ Tenant lean methodology
- Overall (STATE)
- 28 Tenant-Leaning
- State Oregon
- 28 Tenant-Leaning · D+6
- County
- — inherits STATE
- City
- — inherits STATE
ZIP-level market 97132
- Rents YoY
- 0.6%
- Active inventory
- 230
- Price-to-rent
- 5.3×
Monthly cashflow live
- Estimated rent
- $2,058 high interval (Pro) →
- Mortgage (P&I)
- −$682
- Tax est. 1.5%
- −$162 /mo · $1,950/yr
- Insurance
- −$54
- HOA
- −$0
- Vacancy / Maint / Mgmt
- −$432
- Net cashflow
- $727
Break-even live
UW: 25.0% down · 7.5% · 30yr · 1.5% tax · 5.0% vac · 8.0% maint · 8.0% mgmt
Financing live
Cash to close
- Down payment
- $32,500
- Closing costs
- $3,900
- Reserves months
- —
- Total cash needed
- —
Loan-product check · same deal, 3 products live
Conventional
25% down · 7.5% · 30yr
- Down + closing
- —
- Monthly P&I
- —
- Monthly cashflow
- —
- DSCR
- —
- Eligible?
- —
Personal DTI + credit; lowest rate.
DSCR
20% down · 8.5% · 30yr
- Down + closing
- —
- Monthly P&I
- —
- Monthly cashflow
- —
- DSCR
- —
- Eligible?
- —
No personal income docs; deal must DSCR.
Hard money
10% down · 12.0% · 12mo
- Down + closing
- —
- Monthly P&I
- —
- Monthly cashflow
- —
- DSCR
- —
- Eligible?
- —
Short-term bridge; refi at stabilization.
Rent comps 32 comps
| Address | Beds | Baths | Sqft | Rent | $/sqft | DOM | Units | Dist |
|---|---|---|---|---|---|---|---|---|
| 480 S Lair Ln Newberg, OR | 3.0 | 2.5 | 1345 | $2,395 | $1.78 | 3d | 1 | 0.10mi |
| 401 S Everest St Newberg, OR | 2.0 | 1.0 | 950 | $1,625 | $1.71 | 2d | 1 | 0.11mi |
| 2203 E Sam Parrett Dr Newberg, OR | 3.0 | 2.5 | 1386 | $2,399 | $1.73 | 24d | 1 | 0.11mi |
| 1536 E 3rd St Unit 20 Newberg, OR | 3.0 | 1.0 | 1000 | $1,725 | $1.73 | 44d | 1 | 0.15mi |
| 506 S Corinne Dr Newberg, OR | 3.0 | 2.5 | 1390 | $2,350 | $1.69 | 18d | 1 | 0.19mi |
| 1418 E 2nd St Unit 10 Newberg, OR | 2.0 | 1.0 | 850 | $1,550 | $1.82 | 44d | 1 | 0.24mi |
| 2501 E 2nd St #12 Newberg, OR | 2.0 | 2.0 | 910 | $1,500 | $1.65 | 24d | 1 | 0.26mi |
| 601 Wynooski St Unit 201 Newberg, OR | 2.0 | 2.0 | 1122 | $1,850 | $1.65 | 44d | 1 | 0.27mi |
| 601 Wynooski St Unit 100 Newberg, OR | 2.0 | 2.0 | 1064 | $1,745 | $1.64 | 15d | 1 | 0.28mi |
| 500 S River St #20 Newberg, OR | 2.0 | 1.0 | 800 | $1,425 | $1.78 | 3d | 1 | 0.41mi |
| 1005 Wynooski St Unit 7 Newberg, OR | 2.0 | 1.0 | 825 | $1,675 | $2.03 | 44d | 1 | 0.46mi |
| 611 Sitka Ave Unit 03 Newberg, OR | 2.0 | 1.5 | 900 | $1,550 | $1.72 | 44d | 1 | 0.47mi |
| 704 N Elliott Rd Newberg, OR | 2.0 | 1.5 | 850 | $1,700 | $2.00 | 16d | 1 | 0.50mi |
| 1009 N Hulet Ave Newberg, OR | 3.0 | 2.0 | 1412 | $2,250 | $1.59 | 8d | 1 | 0.66mi |
| 507 N Meridian St Apt 1 Newberg, OR | 2.0 | 1.0 | 700 | $1,375 | $1.96 | 3d | 1 | 0.67mi |
| 901 N Pecan Ct Newberg, OR | 2.0 | 1.0 | 827 | $1,550 | $1.87 | 2d | 2 | 0.68mi |
| 2400 E Haworth Ave Newberg, OR | 1.0–3.0 | 1.0–1.5 | 1025 | $1,850 | $1.80 | 2d | 2 | 0.69mi |
| 1109 S River St Newberg, OR | 2.0 | 2.0 | 969 | $1,812 | $1.87 | 2d | 3 | 0.71mi |
| 905 S College St Unit B Newberg, OR | 3.0 | 1.5 | 1248 | $1,995 | $1.60 | 24d | 1 | 0.75mi |
| 606 E 9th St Newberg, OR | 2.0 | 1.0–1.5 | 920 | $1,550 | $1.68 | 20d | 2 | 0.76mi |
| 606 E Ninth St Apt 34 Newberg, OR | 2.0 | 1.0 | 920 | $1,550 | $1.68 | 4d | 1 | 0.76mi |
| 611 S Blaine St Newberg, OR | 1.0–2.0 | 1.0–2.0 | 860 | $1,645 | $1.91 | 44d | 2 | 0.88mi |
| 1404 E Park Ln Newberg, OR | 1.0–2.0 | 1.0 | 783 | $1,670 | $2.13 | 2d | 4 | 0.89mi |
| 2507 Hawthorne Dr Newberg, OR | 2.0 | 1.0 | 950 | $1,700 | $1.79 | 2d | 1 | 0.90mi |
| 1200 N Meridian St Newberg, OR | 2.0 | 1.5 | 950 | $1,595 | $1.68 | 44d | 1 | 0.91mi |
| 912 Charles St Apt B Newberg, OR | 2.0 | 1.0 | 1087 | $1,750 | $1.61 | 44d | 1 | 0.94mi |
| 911 W Charles St Newberg, OR | 2.0 | 1.0 | 888 | $1,795 | $2.02 | 8d | 1 | 0.96mi |
| 1401 N Springbrook Rd Apt 128 Newberg, OR | 2.0 | 1.0 | 960 | $1,500 | $1.56 | 2d | 1 | 1.06mi |
| 1401 N Springbrook Rd Newberg, OR | 2.0 | 1.0 | 960 | $1,550 | $1.61 | 16d | 4 | 1.06mi |
| 204 N Harrison St Unit A Newberg, OR | 2.0 | 1.5 | 1030 | $1,850 | $1.80 | 44d | 1 | 1.08mi |
| 1401 N Springbrook Rd Unit 220 Newberg, OR | 2.0 | 1.0 | 960 | $1,600 | $1.67 | 24d | 1 | 1.08mi |
| 4001 E Jory St Newberg, OR | 1.0–3.0 | 1.0–2.0 | 941 | $2,440 | $2.59 | 2d | 1 | 1.44mi |
Listing history 17 events
-
2026-06-18days on market $130,000 Active 336 DOM
-
2026-06-17days on market $130,000 Active 335 DOM
-
2026-06-16days on market $130,000 Active 334 DOM
-
2026-06-15days on market $130,000 Active 333 DOM
-
2026-06-13days on market $130,000 Active 331 DOM
-
2026-06-09days on market $130,000 Active 327 DOM
-
2026-06-08days on market $130,000 Active 326 DOM
-
2026-06-07days on market $130,000 Active 325 DOM
-
2026-06-05days on market $130,000 Active 322 DOM
-
2026-06-03days on market $130,000 Active 321 DOM
-
2026-06-02days on market $130,000 Active 320 DOM
-
2026-06-01days on market $130,000 Active 319 DOM
-
2026-05-31days on market $130,000 Active 318 DOM
-
2025-12-06price $130,000
-
2025-10-30price $135,000
-
2025-09-24price $138,000
-
2025-07-17$140,000 Active
ⓘ Source: listings_history table (triggers on properties + properties_extension) + one-shot
backfill from property_details.listing_events for pre-trigger history.
Climate risk First Street
- Flood 1/10 Low FEMA zone X (unshaded) · 0% chance over 30 yrs
- Wildfire 2/10 Low
- Heat 3/10 Moderate 7 d/yr ≥92°F today · 14 d/yr by 30 yrs out
- Wind 1/10 Low
- Air quality 8/10 Severe 10 unhealthy d/yr today · 11 by 30 yrs out
Nearby sold comps map
Loading sold comps map…
Walkable amenities ~0.75 mi
Loading nearby amenities…
Taxation est. · year 1
- Rental income
- $24,690
- − Mortgage interest
- −$7,282
- − Property taxes
- −$1,950
- − Insurance
- −$650
- − Repairs & maintenance
- −$1,975
- − Management
- −$1,975
- − Depreciation
- −$3,782
- Taxable income
- $7,076
- Est. tax owed @ 24.0%
- −$1,698
- After-tax cash flow
- $7,026/yr
For passive investors: Depreciation is non-cash, so a rental often shows a tax loss while cash-flowing — sheltering income. Rental losses are passive: they offset passive income freely, and up to $25,000/yr can offset ordinary (W-2) income if you actively participate and your MAGI is under $100k (phasing out to $0 by $150k); unused losses carry forward. On sale, claimed depreciation is recaptured at up to 25%, and gains may owe capital-gains tax (a 1031 exchange can defer both). Figures are a year-1 estimate at your 24.0% rate — not tax advice; consult a CPA.
Condition & rehab AI · 13 photos
The home is in average condition with some cosmetic repairs needed, particularly to the exterior and interior paint. Painting and landscaping would significantly increase its resale and rental value.
Repairs flagged
- Major exterior paint — The paint appears faded and uneven, indicating significant wear.
- Major interior paint — The interior walls have some discoloration and the paint appears uneven.
Value-add opportunities
- Both painting — Painting the exterior and interior will improve the home's curb appeal and interior aesthetics, making it more attractive to potential buyers and renters.
- Both landscaping — Landscaping the front yard and adding some greenery will enhance the home's curb appeal and make it more inviting for potential buyers and renters.
Renovation cost estimate screening
| Repair item | Severity | Est. cost |
|---|---|---|
| exterior paint · The paint appears faded and uneven, indicating significant wear. | Major | $15,000–50,000 |
| interior paint · The interior walls have some discoloration and the paint appears uneven. | Major | $15,000–50,000 |
| Total estimated repair cost · 2 items | $30,000–100,000 |
Value-add ROI direction
- Both painting — Painting the exterior and interior will improve the home's curb appeal and interior aesthetics, making it more attractive to potential buyers and renters. ↑
- Both landscaping — Landscaping the front yard and adding some greenery will enhance the home's curb appeal and make it more inviting for potential buyers and renters. ↑
ⓘ Cost ranges are severity-bucket heuristics (US national rule-of-thumb). Get contractor quotes + a written scope before underwriting a rehab budget.
Schools (NCES district)
- District
- Newberg SD 29J
- NCES district ID
- 4108720
- Math proficiency
- 30% ▼ -13.00%
- Reading proficiency
- 45% ▼ -12.00%
- Median HH income
- $62,898
- Composite
- 33.6/100
- National rank
- #5414
- State rank
- #17 of 58 in OR
Livability — Newberg
- Score
- 76/100
- State rank
- #77
- US rank
- #3395
Category grades
Schools grade is shown separately in the Schools card above.
Census & demographics
- Census place
- Newberg, OR
- County
- Yamhill County · 71,150 people
- City population
- 32,486
- Metro
- Portland-Vancouver-Hillsboro, OR-WA
- Population (ZIP)
- 32,486
- Household income
- $96,493
- Rent vs Own
- Severe rent burden
- 1311.0
Population outlook (Yamhill County) Hauer SSP2
- Today (2025)
- 109,295 people
- By 2030
- 112,060 · +2.5%
- By 2040
- 115,975 · +6.1%
- By 2050
- 118,155 · +8.1%
- By 2075
- 120,968 · +10.7%
- By 2100
- 116,163 · +6.3%
Race, ethnicity, and origin ACS 2023
- Neighborhood character
- Predominantly White (76%)
- Race & ethnicity
- White 76% Hispanic / Latino 14% Two or more races 12% Asian 3%
- Hispanic origin (detail)
- Mexican 11%
- Common ancestry
- Italian 5% Portuguese 3% Slovak 3%
- Foreign-born
- 7% · Canada, China
- Languages at home
- 89% English-only · Spanish 8% Other Indo-European 1% Other Asian/Pacific 1%
Political lean MEDSL · Yamhill
- 2024 margin
- Lean R (+6.1) · D 45.3% · R 51.4% · Other 3.3%
- 2008→2024 swing
- -4.8pp toward R · 2008: -1.4pp · 2024: -6.1pp
- All cycles
- 2024: R+6.1 2020: R+4.0 2016: R+8.8 2012: R+6.7 2008: R+1.4
Not yet ingested
- Civics
- —
Market trends
- HPI YoY
- ▼ -265.11%
- Current HPI
- 320.8972
- Rent YoY
- ▲ 0.55%
- Metro
- Portland-Vancouver-Hillsboro, OR-WA
- State GDP YoY
- ▲ 2.05%
- F500 in state
- 2
Industry mix (Fortune 500 HQ in OR)
| Industry | F500 HQs | Revenue |
|---|---|---|
| Consumer Goods | 1 | $51B |
|
||
Price history
-7.1% since first listed4 events — show timeline
- 2025-12-06 Price Changed $130,000 WVMLS
- 2025-10-30 Price Changed $135,000 WVMLS
- 2025-09-24 Price Changed $138,000 WVMLS
- 2025-07-17 Listed $140,000 WVMLS
Cash-flow waterfall
monthlySold comps — $/sqft
last 12 mo · ≤1 miLoading sold comps…