 Duplex
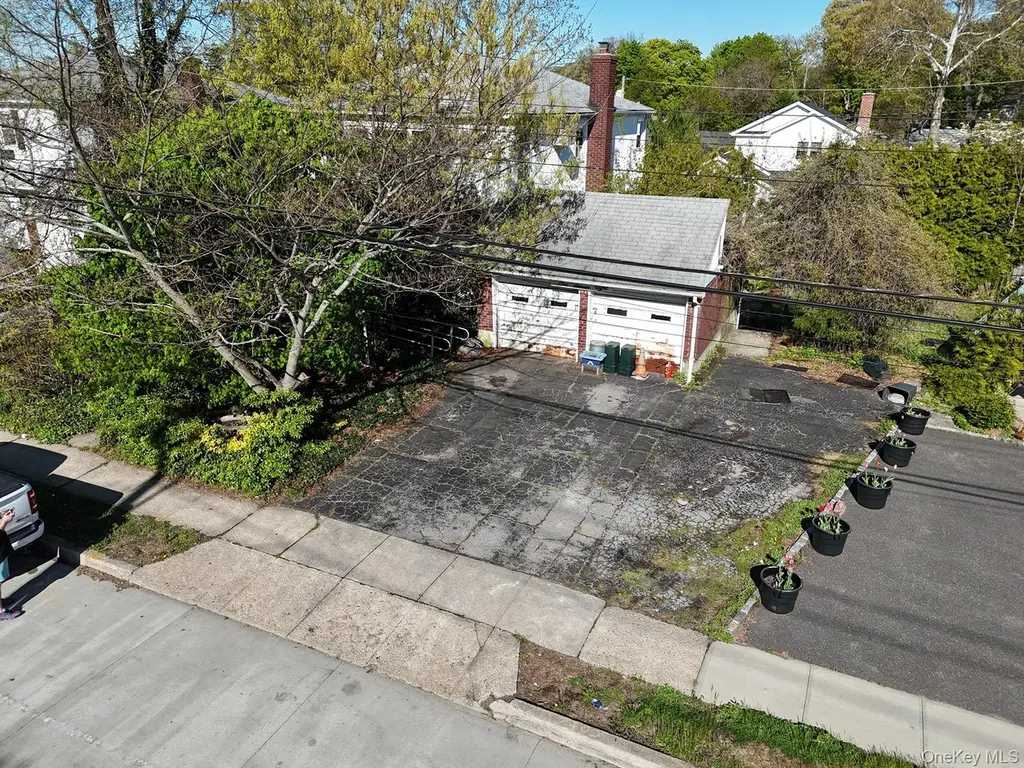
178 S Long Beach Rd · Rockville Centre, NY
Flood risk 6/10 · Moderate
- FEMA flood zone
- X (unshaded)
- Chance of flooding over 30 yrs
- 0.73%
- Est. flood insurance / yr
- $473 – $860
Fire risk 1/10 · Minimal
- Est. fire insurance / yr
- $691 – $1,283
Heat risk 6/10 · Moderate
- Hot days now (above 94°F)
- 7 days/yr
- Hot days in 30 yrs
- 16 days/yr
Wind risk 6/10 · Moderate
- Chance of severe wind over 30 yrs
- 71.0%
Air-quality risk 4/10 · Minor
- Unhealthy air days now
- 4 days/yr
- Unhealthy air days in 30 yrs
- 6 days/yr
Risk factors via First Street. Map © Google.
Why this score? — see what drove the C grade
The composite is a weighted blend of 9 inputs, each scored 0–100. Each bar is that input's sub-score; the figure is the points it added to the 100-point composite (weight × sub-score).
- Cash flow +20.0/30.0
- ARV discount +7.5/15.0
- Schools +6.7/10.0
- 1% rule +6.4/10.0
- DSCR +6.3/10.0
- Livability +4.3/5.0
- Rent growth +2.5/5.0
- Condition / age +2.5/5.0
- Appreciation +0.0/10.0
$570,000
🖨 Deal sheet 📄 Offer letter ✓ Due diligence
Multi-family units
County records classify this as Multi-Family (2-4 Unit). Listing-text estimate: 2 units. confirmed
Listing remarks
Public online Auction: Bidding opens 5/26/26 @ 11 AM & Ends 5/28/26 11 AM (approx). The price of property exclusively represents the suggested opening bid & not the price of the property. Sold "as-is". Great opportunity for a buyer who does their homework & is looking to purchase a 2 family fixer-upper in RVC/Oceanside SD. Registration deadline 5/27/26 4 PM . Please read all information-your due diligence is necessary
Key facts
- 6,300 sq ft lot
- 2 garage spots
- Built 1959
Property features AI
Finance
- Financial info: Tax year 2024 (tax amount provided but excluded per instructions)
- HOA & community: One-time buyer's premium (additional fee of $0.03)
Exterior
- Parking: Driveway; Garage with 2 spaces
- Utilities: Public sewer; Utilities: see remarks
- Home design: Duplex; Property described as actual condition and fixer
- Construction: Frame construction
- Exterior features: Frame construction; Not waterfront; No additional parcels
Interior
- Heating & cooling: No central cooling; Heating noted as 'See Remarks' / Other
- Interior features: Other interior features; Full basement
Neighborhood map
What this means for you Summary
Snapshot
- This is a 2 × 2-bed/1-bath units multifamily listed at $570k.
Deal economics
- At list price, monthly cash flow is $699 ($8k/yr) — positive. Per door: $349/mo.
- The deal already cash-flows at list — no discount required.
- Meets the 1% rule at list price ($6k rent vs $570k).
- Recommended offer: $561k (1.5% below list) — sets the bar for market timing.
- Cap rate 7.8% vs local median 2.5% in Rockville Centre — top-decile yield for the area; either an underpriced asset or a hidden risk that comps aren't pricing in. Stress-test before assuming the spread holds.
Location & tenants
- Location reads 86/100 on livability (#17 in NY, #365 nationally) — a professional / high-income tenant draw. Strengths: amenities A+, commute A+, employment A+; Watch: cost of living F.
- Oceanside Union Free School District (suburban): math 69% / reading 77% proficiency, ranked #75 of 590 in NY (top 13%) — strong family-tenant draw, lease renewals of 3-5y typical; only 10% free/reduced lunch — higher-income household profile.
- Zoned schools: School 4 (math 67% / reading 77%, grade A-, #378 of 2,108 statewide, top 20%, 298 students, 20% FRL); School 9M-Oceanside Middle School (math 48% / reading 61%, grade B-, #214 of 729 statewide, top 31%, 817 students, 16% FRL); School 7-Oceanside Senior High School (math 91% / reading 96%, grade A+, #131 of 1,100 statewide, top 13%, 1,692 students, 20% FRL).
- Market conditions: 143 active listings in the ZIP; 7 comparable units currently listed for rent nearby; rentals lingering (median 44d on market — plan ~5-8 weeks vacancy on turnover, expect pricing pressure); 86% of comp listings sitting > 30 days — soft ceiling on asking rent; high-income renter base; 824 units permitted in Nassau County in 2024 (153 in 5+ unit buildings).
- At $6,481/mo this rent would consume 49% of the median local household income ($157k/yr) (locally 732% of renters already pay >50% of income on rent) — very limited rent-growth headroom before tenants either downsize or default.
Forward outlook
- Local home prices are declining (-3.0%/yr); year-one equity from $4k of loan paydown is wiped out by about $17k of value loss. Plan a longer hold.
- Nassau County population projected at +7% by 2050 — modest demand growth; plan on rents tracking national, not racing it.
Negotiation context
- It's been on market 22 days — a 2% lower offer ($561k) is reasonable based on typical stale-listing flexibility.
Risks & watch-outs
- Watch-outs: property tax is 2.5% of price; built in 1959 — expect roof / HVAC / electrical / plumbing capex.
- Climate carrying-cost: major flood risk; major wind risk, 71% chance of damaging wind over 30y; extreme-heat days projected 7→16/yr by 2055 (HVAC capex compounding) — expect insurance premiums to compound above CPI over the hold.
Questions for the listing agent
- Can we see the unit-by-unit rent roll, current vacancy, and any below-market leases? What's the average tenancy length?
- What capital expenditures (roof, boiler, parking lot, exteriors) have been made in the last 5 years, and what's planned in the next 2?
- Built in 1959 — when were the roof, HVAC, electrical panel, plumbing, and water heater last replaced?
- Property tax is high relative to price — has the assessment been appealed recently, and will the sale trigger a re-assessment?
- Is there a deadline driving the sale (1031 exchange, divorce, estate, relocation)? That informs how much negotiation room exists.
- Schools are A-rated — typically a magnet for longer-tenancy family renters. What's the average tenant stay here, and is there a school-zone premium baked into asking?
- What's the average days-on-market for RENTAL listings here right now (not sales)? A rising rental-DOM trend means longer vacancies and softer asking-rent achievability than the comps imply.
- What's the recent tenant-quality profile in this submarket — average credit score on applications, eviction rate, late-payment / NSF rate, and stable-employment percentage? A property-management company in the area should have these aggregated.
- How much new apartment / multifamily construction is in the pipeline within 1–3 miles? Heavy new supply (>2% of stock underway) typically softens rents 12–24 months out; light construction supports rent growth.
Investment metrics
- 1% rule
- 1.14% ✓
- Cap rate
- 7.76%
- Cash-on-cash
- 5.25%
- DSCR
- 1.23
- GRM
- 7.3
CMA / ARV
- ARV (median comp)
- $1,389,557
- List price
- $570,000
- Delta
- -58.98%
- Verdict
- UNDERPRICED
- Comps
- 10 within 1.0 mi
Show comp detail 1 sale within ~0.75 mi
| Address | Dist | Beds/Ba | Sqft | Sold | Price | $/sf | Match |
|---|---|---|---|---|---|---|---|
| 60 Chestnut St | 0.64mi | 5/2.0 | 2,128 (-5%) | 9mo | $900,000 | $423 | 53 |
Match score weights: distance 35% · size 25% · config 20% · recency 20%. Top-matched comps best support the ARV.
Projected returns pro-forma
-3.0% appreciation · 3.0% rent growth · sell at horizon
- IRR
- -8.1%
- Equity multiple
- 0.70×
- Total profit
- $-47,479
- Equity at exit
- $84,989
- IRR
- 1.5%
- Equity multiple
- 1.11×
- Total profit
- $17,547
- Equity at exit
- $49,283
Cash invested: $159,600 (down + closing). Projections, not guarantees.
Landlord ↔ Tenant lean methodology
- Overall (STATE)
- 15 Strongly Tenant-Friendly
- State New York
- 15 Strongly Tenant-Friendly · D+10
- County
- — inherits STATE
- City
- — inherits STATE
ZIP-level market 11570
- Active inventory
- 143
- Price-to-rent
- 14.7×
Monthly cashflow live
- Estimated rent
- $6,481 high interval (Pro) →
- Mortgage (P&I)
- −$2,989
- Tax from tax record
- −$1,195 /mo · $14,338/yr
- Insurance
- −$238
- HOA
- −$0
- Vacancy / Maint / Mgmt
- −$1,361
- Net cashflow
- $699
Break-even live
2-unit breakdown (identical units grouped — click to expand)
| Units | Beds | Baths | Est. rent |
|---|---|---|---|
| 2× units | 2 | 1 | $6,480 |
| #1 | 2 | 1 | $3,240 |
| #2 | 2 | 1 | $3,240 |
| Total (2 units) | $6,481 | ||
UW: 25.0% down · 7.5% · 30yr · 1.5% tax · 5.0% vac · 8.0% maint · 8.0% mgmt
Financing live
Cash to close
- Down payment
- $142,500
- Closing costs
- $17,100
- Reserves months
- —
- Total cash needed
- —
Loan-product check · same deal, 3 products live
Conventional
25% down · 7.5% · 30yr
- Down + closing
- —
- Monthly P&I
- —
- Monthly cashflow
- —
- DSCR
- —
- Eligible?
- —
Personal DTI + credit; lowest rate.
DSCR
20% down · 8.5% · 30yr
- Down + closing
- —
- Monthly P&I
- —
- Monthly cashflow
- —
- DSCR
- —
- Eligible?
- —
No personal income docs; deal must DSCR.
Hard money
10% down · 12.0% · 12mo
- Down + closing
- —
- Monthly P&I
- —
- Monthly cashflow
- —
- DSCR
- —
- Eligible?
- —
Short-term bridge; refi at stabilization.
Rent comps 7 comps
| Address | Beds | Baths | Sqft | Rent | $/sqft | DOM | Units | Dist |
|---|---|---|---|---|---|---|---|---|
| 107 Fairview Ave Oceanside, NY | 1.0 | 2.5 | 1954 | $1,900 | $0.97 | 43d | 1 | 0.53mi |
| 2701 Magee Pl Unit 2 Oceanside, NY | 2.0 | 1.0 | 1500 | $3,100 | $2.07 | 43d | 1 | 0.72mi |
| 40 Southard Ave Rockville Centre, NY | 2.0 | 1.0 | 1939 | $2,650 | $1.37 | 43d | 1 | 0.98mi |
| 80 N Centre Ave Rockville Centre, NY | 3.0 | 1.0–3.5 | 1254 | $4,918 | $3.92 | 1d | 1 | 0.98mi |
| 311 Marina Pointe Dr Oceanside, NY | 2.0 | 2.5 | 1700 | $5,200 | $3.06 | 43d | 1 | 1.21mi |
| 44 Jefferson Ave Unit Second Floor Lynbrook, NY | 2.0 | 1.0 | 1452 | $2,850 | $1.96 | 43d | 1 | 1.44mi |
| 56 4th Ave Unit 3 East Rockaway, NY | 1.0 | 1.0 | 1528 | $2,100 | $1.37 | 43d | 1 | 1.50mi |
Listing history 5 events
-
2026-06-02status $570,000 Pending 22 DOM
-
2026-06-01days on market $570,000 Active 22 DOM
-
2026-05-31days on market $570,000 Active 21 DOM
-
2026-05-11$570,000 Active 450-char remark
-
2026-05-08historical $570,000 450-char remark
ⓘ Source: listings_history table (triggers on properties + properties_extension) + one-shot
backfill from property_details.listing_events for pre-trigger history.
Tax reassessment forecast NY · Partial reset (capped growth)
- Current annual tax
- $14,338 · $1,195/mo
- Projected year-2 tax
- $14,338 · $1,195/mo
- Expected delta
- $0/yr ($0/mo · 0.0%)
ⓘ Screening estimate from a state-policy table — verify with the county assessor before closing.
Climate risk First Street
- Flood 6/10 Major FEMA zone X (unshaded) · 73% chance over 30 yrs
- Wildfire 1/10 Low
- Heat 6/10 Major 7 d/yr ≥94°F today · 16 d/yr by 30 yrs out
- Wind 6/10 Major 71% chance of damaging wind over 30 yrs
- Air quality 4/10 Moderate 4 unhealthy d/yr today · 6 by 30 yrs out
Nearby sold comps map
Loading sold comps map…
Walkable amenities ~0.75 mi
Loading nearby amenities…
Taxation est. · year 1
- Rental income
- $77,772
- − Mortgage interest
- −$31,929
- − Property taxes
- −$14,338
- − Insurance
- −$2,850
- − Repairs & maintenance
- −$6,222
- − Management
- −$6,222
- − Depreciation
- −$16,582
- Taxable loss
- −$370
- Est. tax savings @ 24.0%
- +$89
- After-tax cash flow
- $8,471/yr
For passive investors: Depreciation is non-cash, so a rental often shows a tax loss while cash-flowing — sheltering income. Rental losses are passive: they offset passive income freely, and up to $25,000/yr can offset ordinary (W-2) income if you actively participate and your MAGI is under $100k (phasing out to $0 by $150k); unused losses carry forward. On sale, claimed depreciation is recaptured at up to 25%, and gains may owe capital-gains tax (a 1031 exchange can defer both). Figures are a year-1 estimate at your 24.0% rate — not tax advice; consult a CPA.
Schools (NCES district)
- District
- Oceanside Union Free School District
- NCES district ID
- 3621570
- Math proficiency
- 69% ▼ -1.00%
- Reading proficiency
- 77% ▲ 13.00%
- Median HH income
- $100,802
- Composite
- 66.68/100
- National rank
- #410
- State rank
- #75 of 590 in NY
Livability — Rockville Centre
- Score
- 86/100
- State rank
- #17
- US rank
- #365
Category grades
Schools grade is shown separately in the Schools card above.
Census & demographics
- Census place
- Rockville Centre, NY
- County
- Nassau County · 653,051 people
- City population
- 28,908
- Metro
- New York-Newark-Jersey City, NY-NJ-PA
- Population (ZIP)
- 28,908
- Household income
- $157,163
- Rent vs Own
- Severe rent burden
- 732.0
Population outlook (Nassau County) Hauer SSP2
- Today (2025)
- 1,409,302 people
- By 2030
- 1,431,482 · +1.6%
- By 2040
- 1,471,607 · +4.4%
- By 2050
- 1,502,845 · +6.6%
- By 2075
- 1,575,403 · +11.8%
- By 2100
- 1,554,356 · +10.3%
Race, ethnicity, and origin ACS 2023
- Neighborhood character
- Predominantly White (74%)
- Race & ethnicity
- White 74% Hispanic / Latino 12% Two or more races 7% Black 5% Asian 5%
- Hispanic origin (detail)
- Puerto Rican 2% Dominican 4%
- Common ancestry
- Romanian 4% Scotch-Irish 4% Subsaharan African 1%
- Foreign-born
- 12% · Canada, China, South Korea
- Languages at home
- 84% English-only · Spanish 8% Other Indo-European 5% Chinese 1%
Political lean MEDSL · Nassau
- 2024 margin
- Toss-up / Even · D 47.9% · R 52.1%
- 2008→2024 swing
- -12.6pp toward R · 2008: 8.4pp · 2024: -4.2pp
- All cycles
- 2024: R+4.2 2020: D+9.5 2016: D+5.3 2012: D+6.7 2008: D+8.4
Not yet ingested
- Civics
- —
Market trends
- HPI YoY
- ▼ -731.15%
- Current HPI
- 275.9882
- Rent YoY
- —
- Metro
- New York-Newark-Jersey City, NY-NJ-PA
- State GDP YoY
- ▲ 2.60%
- F500 in state
- 92
Industry mix (Fortune 500 HQ in NY)
| Industry | F500 HQs | Revenue |
|---|---|---|
| Financial Services | 10 | $950B |
|
||
| Consumer Goods | 9 | $162B |
|
||
| Insurance | 4 | $225B |
|
||
| Telecommunications | 2 | $144B |
|
||
| Pharmaceuticals | 2 | $112B |
|
||
| Media / Entertainment | 2 | $69B |
|
||
Price history
+0.0% since first listed3 events — show timeline
- 2026-06-01 Pending — OneKey® MLS as Distributed by MLS Grid
- 2026-05-11 Listed $570,000 OneKey® MLS as Distributed by MLS Grid
- 2026-05-08 Coming Soon $570,000 OneKey® MLS as Distributed by MLS Grid
Property tax history
+5.3%/yrLatest (2024): $14,338 · -2.0% YoY. Source: county tax records.
Cash-flow waterfall
monthlySold comps — $/sqft
last 12 mo · ≤1 miLoading sold comps…