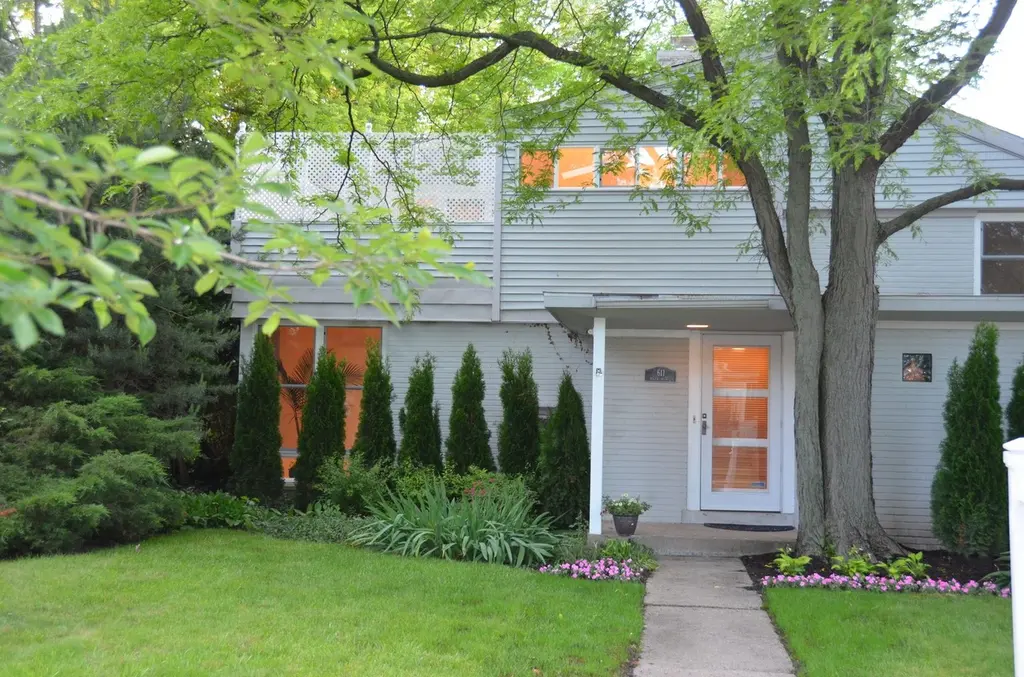
611 Roger Ave · Kenilworth, IL
Flood risk 4/10 · Minor
- FEMA flood zone
- X (unshaded)
- Chance of flooding over 30 yrs
- 0.2%
- Est. flood insurance / yr
- $473 – $860
Fire risk 1/10 · Minimal
- Est. fire insurance / yr
- $804 – $1,492
Heat risk 2/10 · Minimal
- Hot days now (above 98°F)
- 7 days/yr
- Hot days in 30 yrs
- 14 days/yr
Wind risk 2/10 · Minimal
- Chance of severe wind over 30 yrs
- 1.0%
Air-quality risk 3/10 · Minor
- Unhealthy air days now
- 4 days/yr
- Unhealthy air days in 30 yrs
- 4 days/yr
Risk factors via First Street. Map © Google.
Why this score? — see what drove the D- grade
The composite is a weighted blend of 9 inputs, each scored 0–100. Each bar is that input's sub-score; the figure is the points it added to the 100-point composite (weight × sub-score).
- Appreciation +9.2/10.0
- Schools +7.7/10.0
- ARV discount +7.5/15.0
- Livability +4.1/5.0
- Rent growth +2.5/5.0
- Condition / age +2.5/5.0
- Cash flow +1.9/30.0
- 1% rule +0.0/10.0
- DSCR +0.0/10.0
$925,000
🖨 Deal sheet 📄 Offer letter ✓ Due diligence
Listing remarks
Bright, sunny, and full of potential, this mid-century modern home brings an easy, elevated lifestyle to a convenient Kenilworth location. Thoughtfully updated and deceptively spacious, it lives far larger than it appears from the outside. The main level is designed for both everyday comfort and effortless living, featuring a welcoming living room with a gas fireplace and a dining room that opens seamlessly to an exceptionally deep, private backyard-perfect for outdoor dinners, play, or relaxing weekends at home. The updated kitchen offers granite countertops, newer stainless steel appliances, and functional flow for daily life. Upstairs, three bedrooms include a spacious primary retreat wi
Key facts
- Garage
- Built 1948
- Listed 9 days
Property features AI
Finance
- Other: Some photos are virtually staged; Possession at closing
- Financial info: Special service area: No
- HOA & community: No master association fee required; Community amenities include a park
Exterior
- Parking: Attached garage (garage owned) with garage door opener; Carport; 1 garage/parking space total
- Security: Carbon monoxide detectors
- Utilities: Lake Michigan water source; Public sewer; Gas water heater
- Home design: Detached single-family home; Split-level design; Fee simple ownership; Estimated living area; Built before 1978 (older character)
- Construction: Asphalt roof; Concrete perimeter foundation; Brick, aluminum siding and vinyl siding exterior; Approximately 71–80 years old
- Exterior features: Deck; Roof deck; Fenced yard; Curbs, sidewalks, street lights, paved streets; School bus and commuter bus/train access
Interior
- Kitchen: Updated kitchen with granite counters; Stainless steel appliances; Oven; Microwave; Dishwasher; Refrigerator; Disposal
- Bedrooms: 3 bedrooms (master and two additional bedrooms on second level)
- Flooring: Hardwood flooring throughout main living areas and bedrooms; Other flooring in laundry room
- Bathrooms: 2 full bathrooms; 1 half bathroom; Basement includes a bathroom
- Heating & cooling: Natural gas heating; Steam heating; Window and wall air conditioning units
- Interior features: Open floorplan; Partially finished basement with exterior/walk-out access
- Laundry & utility: Laundry room on lower level; Washer; Dryer; Sump pump; Humidifier; Gas water heater
Neighborhood map
What this means for you Summary
Snapshot
- This is a 3-bed/1.5-bath single-family listed at $925k.
Deal economics
- At list price, monthly cash flow is $-3k ($-42k/yr) — negative.
- To cash-flow at today's rent, offer at most $313k (66.2% below list).
- To meet the 1% rule (rent ≥ 1% of price), the offer needs to be $279k (69.9% below list).
- Recommended offer: $279k (69.9% below list) — sets the bar for 1% rule.
Location & tenants
- Location reads 82/100 on livability (#72 in IL, #1,175 nationally) — a professional / high-income tenant draw. Strengths: crime A+, commute A+, employment A+; Watch: cost of living F.
- New Trier Twp Hsd 203 (suburban): math 76% / reading 80% proficiency, ranked #2 of 620 in IL (top 0%) — strong family-tenant draw, lease renewals of 3-5y typical.
- Zoned schools: New Trier Township H S Northfield (923 students, 0% FRL).
- Market conditions: 20 active listings in the ZIP; 17 comparable units currently listed for rent nearby; rentals at typical pace (median 22d on market — plan ~3-4 weeks tenant-placement turnaround); 6,272 units permitted in Cook County in 2024 (4,658 in 5+ unit buildings).
Forward outlook
- In year one you build about $84k of equity ($6k loan paydown + $78k appreciation (8.4% local appreciation)).
- By year 2, paydown + projected appreciation supports a ~$135k cash-out refi (75% LTV) — recoverable capital for the next deal without selling this one.
Negotiation context
- Only 9 days on market — expect competitive offers; lowballing is unlikely to land.
- 6 sale attempts since 17y ago; this cycle's ask is 97% above the opening price — seller raised mid-cycle; expect resistance to lowballs.
- Current owner paid $400k; list at $925k implies a 131% gain — meaningful room to come down on a strong offer.
Risks & watch-outs
- Watch-outs: built in 1948 — expect roof / HVAC / electrical / plumbing capex.
Questions for the listing agent
- What do current leases actually rent for vs. the listed asking? Can we see a recent rent roll and the last 12 months of T-12 income?
- Built in 1948 — when were the roof, HVAC, electrical panel, plumbing, and water heater last replaced?
- Is there a deadline driving the sale (1031 exchange, divorce, estate, relocation)? That informs how much negotiation room exists.
- Schools are A-rated — typically a magnet for longer-tenancy family renters. What's the average tenant stay here, and is there a school-zone premium baked into asking?
- The area grade is low — what's the realistic commute time and amenity access for the typical tenant pool here? Any planned neighborhood developments (good or bad) we should know about?
- What's the average days-on-market for RENTAL listings here right now (not sales)? A rising rental-DOM trend means longer vacancies and softer asking-rent achievability than the comps imply.
- What's the recent tenant-quality profile in this submarket — average credit score on applications, eviction rate, late-payment / NSF rate, and stable-employment percentage? A property-management company in the area should have these aggregated.
- How much new for-sale + rental construction is in the pipeline within 1–3 miles? Heavy new supply typically softens prices + rents 12–24 months out; constrained supply supports both.
Investment metrics
- 1% rule
- 0.30% ✗
- Cap rate
- 1.80%
- Cash-on-cash
- -16.06%
- DSCR
- 0.29
- GRM
- 27.6
CMA / ARV
No comps found within radius.
Projected returns pro-forma
8.43% appreciation · 3.0% rent growth · sell at horizon
- IRR
- 9.2%
- Equity multiple
- 1.72×
- Total profit
- $185,434
- Equity at exit
- $729,872
- IRR
- 10.5%
- Equity multiple
- 3.71×
- Total profit
- $702,854
- Equity at exit
- $1,475,452
Cash invested: $259,000 (down + closing). Projections, not guarantees.
Landlord ↔ Tenant lean methodology
- Overall (STATE)
- 43 Moderately Tenant-Leaning
- State Illinois
- 43 Moderately Tenant-Leaning · D+7
- County
- — inherits STATE
- City
- — inherits STATE
ZIP-level market 60043
- Home prices YoY
- 4.8%
- Active inventory
- 20
- Price-to-rent
- 27.6×
Monthly cashflow live
- Estimated rent
- $2,789 high interval (Pro) →
- Mortgage (P&I)
- −$4,851
- Tax from tax record
- −$432 /mo · $5,185/yr
- Insurance
- −$385
- HOA
- −$0
- Vacancy / Maint / Mgmt
- −$586
- Net cashflow
- $-3,465
Break-even live
UW: 25.0% down · 7.5% · 30yr · 1.5% tax · 5.0% vac · 8.0% maint · 8.0% mgmt
Financing live
Cash to close
- Down payment
- $231,250
- Closing costs
- $27,750
- Reserves months
- —
- Total cash needed
- —
Loan-product check · same deal, 3 products live
Conventional
25% down · 7.5% · 30yr
- Down + closing
- —
- Monthly P&I
- —
- Monthly cashflow
- —
- DSCR
- —
- Eligible?
- —
Personal DTI + credit; lowest rate.
DSCR
20% down · 8.5% · 30yr
- Down + closing
- —
- Monthly P&I
- —
- Monthly cashflow
- —
- DSCR
- —
- Eligible?
- —
No personal income docs; deal must DSCR.
Hard money
10% down · 12.0% · 12mo
- Down + closing
- —
- Monthly P&I
- —
- Monthly cashflow
- —
- DSCR
- —
- Eligible?
- —
Short-term bridge; refi at stabilization.
Rent comps 17 comps
| Address | Beds | Baths | Sqft | Rent | $/sqft | DOM | Units | Dist |
|---|---|---|---|---|---|---|---|---|
| 903 Ridge Rd Unit 2 Wilmette, IL | 2.0 | 1.0 | 900 | $2,450 | $2.72 | 7d | 1 | 0.75mi |
| 903 Ridge Rd Unit 2 Wilmette, IL | 2.0 | 1.0 | 900 | $2,450 | $2.72 | 14d | 1 | 0.75mi |
| 903 Ridge Rd Unit 2 Wilmette, IL | 2.0 | 1.0 | 900 | $2,600 | $2.89 | 24d | 1 | 0.75mi |
| 903 Ridge Rd Unit 2 Wilmette, IL | 2.0 | 1.0 | 900 | $2,600 | $2.89 | 20d | 1 | 0.75mi |
| 901 Ridge Rd Wilmette, IL | 2.0 | 1.0 | 1000 | $2,450 | $2.45 | 24d | 1 | 0.75mi |
| 1229 26th St Wilmette, IL | 2.0 | 1.0 | 1250 | $4,650 | $3.72 | 3d | 1 | 1.01mi |
| 617 Green Bay Rd Wilmette, IL | 2.0 | 1.0–2.0 | 971 | $5,505 | $5.67 | 1d | 9 | 1.18mi |
| 800 Oak St Unit 3E Winnetka, IL | 2.0 | 2.0 | 1400 | $2,730 | $1.95 | 24d | 1 | 1.21mi |
| 800 Oak St Apt 3B Winnetka, IL | 2.0 | 2.0 | 1400 | $2,780 | $1.99 | 24d | 1 | 1.21mi |
| 800 Oak St Unit 3A Winnetka, IL | 2.0 | 2.0 | 1400 | $2,750 | $1.96 | 24d | 1 | 1.21mi |
| 1428 Wilmette Ave Unit 1 Wilmette, IL | 3.0 | 2.0 | 1500 | $3,800 | $2.53 | 2d | 1 | 1.24mi |
| 1937 Wilmette Ave Unit 2 Wilmette, IL | 2.0 | 1.0 | 1350 | $2,500 | $1.85 | 4d | 1 | 1.29mi |
| 1937 Wilmette Ave Wilmette, IL | 2.0 | 1.0 | 1350 | $2,500 | $1.85 | 24d | 1 | 1.29mi |
| 1011 Central Ave Unit 2 Wilmette, IL | 2.0 | 2.0 | 1100 | $2,995 | $2.72 | 14d | 1 | 1.30mi |
| 811 Elm St Unit 209 Winnetka, IL | 2.0 | 1.0 | 900 | $2,595 | $2.88 | 24d | 1 | 1.31mi |
| 545 Chestnut St Unit 307 Winnetka, IL | 2.0 | 1.0 | 900 | $2,495 | $2.77 | 24d | 1 | 1.32mi |
| 545 Chestnut St Unit 817-205 Winnetka, IL | 2.0 | 1.0 | 900 | $2,495 | $2.77 | 21d | 1 | 1.32mi |
Listing history 11 events
-
2026-06-18days on market $925,000 Active 9 DOM
-
2026-06-17days on market $925,000 Active 8 DOM
-
2026-06-16days on market $925,000 Active 7 DOM
-
2026-06-15days on market $925,000 Active 6 DOM
-
2026-06-13days on market $925,000 Active 4 DOM
-
2026-06-13days on market $925,000 Active 3 DOM
-
2026-06-10statusdays on market $925,000 Active 1 DOM
-
2026-06-09days on market $925,000 Coming Soon 2 DOM
-
2026-06-08price $925,000 Coming Soon 1 DOM
-
2026-06-08remarks 699-char remark
-
2026-06-08Coming Soon 1 DOM
ⓘ Source: listings_history table (triggers on properties + properties_extension) + one-shot
backfill from property_details.listing_events for pre-trigger history.
Tax reassessment forecast IL · Partial reset (capped growth)
- Current annual tax
- $5,185 · $432/mo
- Projected year-2 tax
- $13,091 · $1,091/mo
- Expected delta
- +$7,906/yr (+$659/mo · 152.5%)
ⓘ Screening estimate from a state-policy table — verify with the county assessor before closing.
Climate risk First Street
- Flood 4/10 Moderate FEMA zone X (unshaded) · 20% chance over 30 yrs
- Wildfire 1/10 Low
- Heat 2/10 Low 7 d/yr ≥98°F today · 14 d/yr by 30 yrs out
- Wind 2/10 Low 100% chance of damaging wind over 30 yrs
- Air quality 3/10 Moderate 4 unhealthy d/yr today · 4 by 30 yrs out
Nearby sold comps map
Loading sold comps map…
Walkable amenities ~0.75 mi
Loading nearby amenities…
Taxation est. · year 1
- Rental income
- $33,463
- − Mortgage interest
- −$51,814
- − Property taxes
- −$5,185
- − Insurance
- −$4,625
- − Repairs & maintenance
- −$2,677
- − Management
- −$2,677
- − Depreciation
- −$26,909
- Taxable loss
- −$60,424
- Est. tax savings @ 24.0%
- +$14,502
- After-tax cash flow
- $-27,082/yr
For passive investors: Depreciation is non-cash, so a rental often shows a tax loss while cash-flowing — sheltering income. Rental losses are passive: they offset passive income freely, and up to $25,000/yr can offset ordinary (W-2) income if you actively participate and your MAGI is under $100k (phasing out to $0 by $150k); unused losses carry forward. On sale, claimed depreciation is recaptured at up to 25%, and gains may owe capital-gains tax (a 1031 exchange can defer both). Figures are a year-1 estimate at your 24.0% rate — not tax advice; consult a CPA.
Schools (NCES district)
- District
- New Trier Twp Hsd 203
- NCES district ID
- 1728200
- Math proficiency
- 76% ▼ -4.00%
- Reading proficiency
- 80% ▼ -1.00%
- Median HH income
- $164,521
- Composite
- 76.94/100
- National rank
- #103
- State rank
- #2 of 620 in IL
Livability — Kenilworth
- Score
- 82/100
- State rank
- #72
- US rank
- #1175
Category grades
Schools grade is shown separately in the Schools card above.
Census & demographics
- Census place
- Kenilworth, IL
- City population
- 2,543
- Population (ZIP)
- 2,543
Population outlook (Cook County) Hauer SSP2
- Today (2025)
- 5,347,519 people
- By 2030
- 5,357,703 · +0.2%
- By 2040
- 5,324,924 · -0.4%
- By 2050
- 5,230,762 · -2.2%
- By 2075
- 4,785,735 · -10.5%
- By 2100
- 4,188,836 · -21.7%
Race, ethnicity, and origin ACS 2023
- Neighborhood character
- Predominantly White (84%)
- Race & ethnicity
- White 84% Two or more races 11% Hispanic / Latino 5% Asian 2%
- Common ancestry
- Romanian 4% Italian 3% Slovak 2%
- Foreign-born
- 7% · Canada, South Korea
- Languages at home
- 89% English-only · Spanish 3% Russian/Polish/Slavic 2% Other Indo-European 1%
Political lean MEDSL · Cook
- 2024 margin
- Solid D (+42.0) · D 70.4% · R 28.4% · Other 1.2%
- 2008→2024 swing
- -11.4pp toward R · 2008: 53.4pp · 2024: 42.0pp
- All cycles
- 2024: D+42.0 2020: D+50.3 2016: D+53.0 2012: D+49.4 2008: D+53.4
Not yet ingested
- Civics
- —
Market trends
- HPI YoY
- ▲ 8.43%
- Current HPI
- 182.2931
- Rent YoY
- —
- Metro
- —
- State GDP YoY
- ▲ 1.59%
- F500 in state
- 60
Industry mix (Fortune 500 HQ in IL)
| Industry | F500 HQs | Revenue |
|---|---|---|
| Insurance | 4 | $201B |
|
||
| Consumer Goods | 4 | $87B |
|
||
| Industrial Machinery | 3 | $64B |
|
||
| Healthcare | 2 | $55B |
|
||
| Retail / Pharmacy | 1 | $148B |
|
||
| Agriculture / Food | 1 | $86B |
|
||
Price history
+56.2% since first listed29 events — show timeline
- 2026-04-25 Listing Removed — MRED as Distributed by MLS Grid
- 2023-04-18 Listing Removed — MRED as Distributed by MLS Grid
- 2023-03-24 Price Changed — MRED as Distributed by MLS Grid
- 2023-03-07 Listed — MRED as Distributed by MLS Grid
- 2018-03-16 Sold (Public Records) $400,000 Public Records
- 2018-03-13 Sold (MLS) $400,000 MRED as Distributed by MLS Grid
- 2018-03-09 Pending — MRED as Distributed by MLS Grid
- 2018-01-22 Contingent — MRED as Distributed by MLS Grid
- 2018-01-14 Relisted — MRED as Distributed by MLS Grid
- 2018-01-08 Contingent — MRED as Distributed by MLS Grid
- 2017-10-27 Listed $469,000 MRED as Distributed by MLS Grid
- 2012-08-14 Listing Removed — MRED as Distributed by MLS Grid
- 2012-05-30 Price Changed — MRED as Distributed by MLS Grid
- 2011-09-29 Listed — MRED as Distributed by MLS Grid
- 2011-08-31 Listing Removed — MRED as Distributed by MLS Grid
- 2011-08-02 Price Changed — MRED as Distributed by MLS Grid
- 2011-06-09 Listed — MRED as Distributed by MLS Grid
- 2010-08-10 Listing Removed — MRED as Distributed by MLS Grid
- 2010-06-07 Price Changed — MRED as Distributed by MLS Grid
- 2010-03-11 Price Changed — MRED as Distributed by MLS Grid
- 2010-01-24 Price Changed — MRED as Distributed by MLS Grid
- 2009-09-24 Price Changed — MRED as Distributed by MLS Grid
- 2009-09-01 Price Changed — MRED as Distributed by MLS Grid
- 2009-04-27 Listed — MRED as Distributed by MLS Grid
- 2001-06-15 Sold (Public Records) $195,000 Public Records
- 1999-12-20 Sold (Public Records) $298,500 Public Records
- 1999-12-20 Sold (Public Records) $298,500 Public Records
- 1999-10-27 Sold (Public Records) $281,000 Public Records
- 1989-07-03 Sold (Public Records) $256,000 Public Records
Property tax history
+3.8%/yrLatest (2023): $5,185 · -1.1% YoY. Source: county tax records.
Cash-flow waterfall
monthlySold comps — $/sqft
last 12 mo · ≤1 miLoading sold comps…