 Fourplex
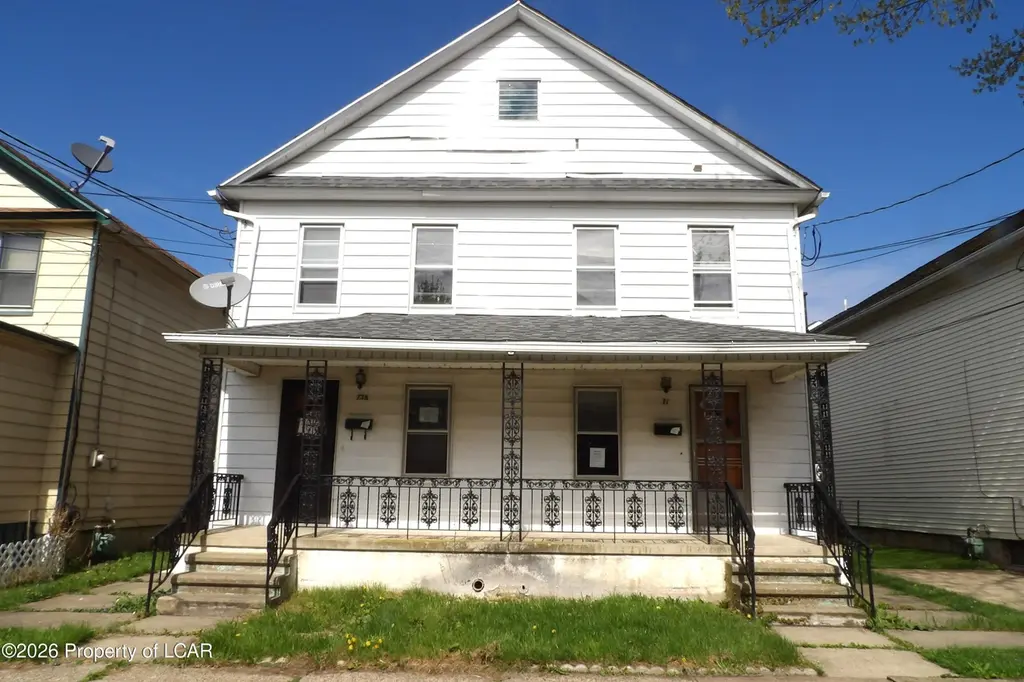
71-73 Penn St · Kingston, PA
Flood risk 5/10 · Moderate
- FEMA flood zone
- X
- Chance of flooding over 30 yrs
- 0.24%
- Est. flood insurance / yr
- $507 – $1,088
Fire risk 3/10 · Minor
- Est. fire insurance / yr
- $511 – $949
Heat risk 4/10 · Minor
- Hot days now (above 97°F)
- 7 days/yr
- Hot days in 30 yrs
- 16 days/yr
Wind risk 3/10 · Minor
- Chance of severe wind over 30 yrs
- 5.0%
Air-quality risk 3/10 · Minor
- Unhealthy air days now
- 2 days/yr
- Unhealthy air days in 30 yrs
- 4 days/yr
Risk factors via First Street. Map © Google.
Why this score? — see what drove the B- grade
The composite is a weighted blend of 9 inputs, each scored 0–100. Each bar is that input's sub-score; the figure is the points it added to the 100-point composite (weight × sub-score).
- Cash flow +30.0/30.0
- 1% rule +10.0/10.0
- DSCR +10.0/10.0
- ARV discount +4.0/15.0
- Livability +4.0/5.0
- Rent growth +3.7/5.0
- Schools +2.5/10.0
- Condition / age +2.2/5.0
- Appreciation +0.0/10.0
$295,000
🖨 Deal sheet (PDF) 📄 Offer letter ✓ Due diligence
Multi-family units
County records classify this as Multi-Family (2-4 Unit). Listing-text estimate: 4 units. confirmed
Listing remarks MLS
New roof!!! Fully rented 4 units - 1 bedroom each. Landlord pays just sewer, tenant pays heat, hot water, electric, and water. OSP for 4 cars in rear. Rents below market value.
Key facts
- Separate utilities
- Off street parking
- Living room
Tags
Property features AI
Exterior
- Parking: Off-street parking
- Utilities: Public water; Public sewer
- Home design: Multi-family residential income property
- Construction: Aluminum siding
- Exterior features: Front porch
Interior
- Heating & cooling: Natural gas heating; Baseboard heating
- Interior features: Has basement
Neighborhood map
What this means for you Summary
Snapshot
- This is a 4 × 1-bed/1-bath units multifamily listed at $295k. Condition is rated fair.
Deal economics
- At list price, monthly cash flow is $2k ($22k/yr) — positive. Per door: $460/mo.
- The deal already cash-flows at list — no discount required.
- Meets the 1% rule at list price ($5k rent vs $295k).
- Recommended offer: $291k (1.5% below list) — sets the bar for market timing.
- Cap rate 13.8% vs local median 5.4% in Kingston — top-decile yield for the area; either an underpriced asset or a hidden risk that comps aren't pricing in. Stress-test before assuming the spread holds.
Location & tenants
- Location reads 81/100 on livability (#162 in PA, #1,345 nationally) — a professional / high-income tenant draw. Strengths: cost of living A+, health & safety A+, housing A; Watch: employment D, commute F.
- Wyoming Valley West SD (suburban): math 18% / reading 42% proficiency, ranked #445 of 539 in PA (top 83%) — families likely to look elsewhere, expect single-tenant / working-renter base with shorter leases.
- Zoned schools: Schuyler Avenue El Sch (math 2% / reading 37%); Wyoming Valley West Ms (math 13% / reading 41%, grade F, #404 of 512 statewide, top 80%, 1,191 students, 100% FRL); Wyoming Valley West Shs (math 57% / reading 24%, grade F, #255 of 437 statewide, top 60%, 1,357 students, 100% FRL) — zoned schools average 100% FRL vs 56% district-wide (44 pts higher); higher-poverty schools than district average — tighter screening recommended.
- Market conditions: Rents rising fast (+4.7%/yr); 134 active listings in the ZIP; 349 units permitted in Luzerne County in 2024 (16 in 5+ unit buildings).
- At $4,911/mo this rent would consume 91% of the median local household income ($64k/yr) (locally 1454% of renters already pay >50% of income on rent) — very limited rent-growth headroom before tenants either downsize or default.
Forward outlook
- Local home prices are declining (-3.0%/yr); year-one equity from $2k of loan paydown is wiped out by about $9k of value loss. Plan a longer hold.
- Luzerne County population projected at +4% by 2050 — modest demand growth; plan on rents tracking national, not racing it.
- At projected returns (-3.0% appreciation + 4.7% rent growth), your $83k cash investment doubles in ~5 years — after that, you're playing with house money.
Negotiation context
- It's been on market 18 days — a 2% lower offer ($291k) is reasonable based on typical stale-listing flexibility.
- 2 sale attempts since 7y ago with the ask held roughly flat each time — persistent listings suggest the price (not the market) is what's stuck; bring a comps-based counter.
- Current owner paid $105k; list at $295k implies a 181% gain — meaningful room to come down on a strong offer.
Risks & watch-outs
- Climate carrying-cost: moderate flood risk — expect insurance premiums to compound above CPI over the hold.
Questions for the listing agent
- Can we see the unit-by-unit rent roll, current vacancy, and any below-market leases? What's the average tenancy length?
- What capital expenditures (roof, boiler, parking lot, exteriors) have been made in the last 5 years, and what's planned in the next 2?
- Have any recent inspections been done? Can we get a copy of the seller's disclosures and any deferred-maintenance estimates?
- Is there a deadline driving the sale (1031 exchange, divorce, estate, relocation)? That informs how much negotiation room exists.
- What's the average days-on-market for RENTAL listings here right now (not sales)? A rising rental-DOM trend means longer vacancies and softer asking-rent achievability than the comps imply.
- What's the recent tenant-quality profile in this submarket — average credit score on applications, eviction rate, late-payment / NSF rate, and stable-employment percentage? A property-management company in the area should have these aggregated.
- How much new apartment / multifamily construction is in the pipeline within 1–3 miles? Heavy new supply (>2% of stock underway) typically softens rents 12–24 months out; light construction supports rent growth.
Investment metrics
- 1% rule
- 1.66% ✓
- Cap rate
- 13.78%
- Cash-on-cash
- 26.75%
- DSCR
- 2.19
- GRM
- 5.0
CMA / ARV
- ARV (median comp)
- $273,991
- List price
- $295,000
- Delta
- 7.67%
- Verdict
- FAIR
- Comps
- 20 within 1.0 mi
Projected returns pro-forma
-3.0% appreciation · 4.65% rent growth · sell at horizon
- IRR
- 22.5%
- Equity multiple
- 1.94×
- Total profit
- $77,813
- Equity at exit
- $43,985
- IRR
- 31.6%
- Equity multiple
- 4.08×
- Total profit
- $254,214
- Equity at exit
- $25,506
Cash invested: $82,600 (down + closing). Projections, not guarantees.
Landlord ↔ Tenant lean methodology
- Overall (STATE)
- 62 Landlord-Friendly
- State Pennsylvania
- 62 Landlord-Friendly · EVEN
- County
- — inherits STATE
- City
- — inherits STATE
ZIP-level market 18704
- Rents YoY
- 4.7%
- Active inventory
- 134
- Price-to-rent
- 20.0×
Monthly cashflow live
- Estimated rent
- $4,911 high interval (Pro) →
- Mortgage (P&I)
- −$1,547
- Tax est. 1.5%
- −$369 /mo · $4,425/yr
- Insurance
- −$123
- HOA
- −$0
- Vacancy / Maint / Mgmt
- −$1,031
- Net cashflow
- $1,841
Break-even live
Sensitivity live
| Price | -10% $2,045 | -5% $1,943 | +0% $1,841 | +5% $1,739 | +10% $1,637 |
|---|---|---|---|---|---|
| Rent | -10% $1,453 | -5% $1,647 | +0% $1,841 | +5% $2,035 | +10% $2,229 |
| Rate | -1.0pp $1,990 | -0.5pp $1,916 | base $1,841 | +0.5pp $1,765 | +1.0pp $1,687 |
4-unit breakdown (identical units grouped — click to expand)
| Units | Beds | Baths | Est. rent |
|---|---|---|---|
| 4× units | 1 | 1 | $4,912 |
| #1 | 1 | 1 | $1,228 |
| #2 | 1 | 1 | $1,228 |
| #3 | 1 | 1 | $1,228 |
| #4 | 1 | 1 | $1,228 |
| Total (4 units) | $4,911 | ||
UW: 25.0% down · 7.5% · 30yr · 1.5% tax · 5.0% vac · 8.0% maint · 8.0% mgmt
Financing live
Cash to close
- Down payment
- $73,750
- Closing costs
- $8,850
- Reserves months
- —
- Total cash needed
- —
Loan-product check · same deal, 3 products live
Conventional
25% down · 7.5% · 30yr
- Down + closing
- —
- Monthly P&I
- —
- Monthly cashflow
- —
- DSCR
- —
- Eligible?
- —
Personal DTI + credit; lowest rate.
DSCR
20% down · 8.5% · 30yr
- Down + closing
- —
- Monthly P&I
- —
- Monthly cashflow
- —
- DSCR
- —
- Eligible?
- —
No personal income docs; deal must DSCR.
Hard money
10% down · 12.0% · 12mo
- Down + closing
- —
- Monthly P&I
- —
- Monthly cashflow
- —
- DSCR
- —
- Eligible?
- —
Short-term bridge; refi at stabilization.
Listing history 7 events
-
2026-06-02status $295,000 Pending 18 DOM
-
2026-06-01days on market $295,000 Active 18 DOM
-
2026-05-31days on market $295,000 Active 17 DOM
-
2026-05-30days on market $295,000 Active 16 DOM
-
2026-05-14$295,000 Active 397-char remark
-
2020-02-21soldstatus $105,000 176-char remark
Show marketing remark (176 chars)
New roof!!! Fully rented 4 units - 1 bedroom each. Landlord pays just sewer, tenant pays heat, hot water, electric, and water. OSP for 4 cars in rear. Rents below market value.
-
2019-11-20$110,000 176-char remark
Show marketing remark (176 chars)
New roof!!! Fully rented 4 units - 1 bedroom each. Landlord pays just sewer, tenant pays heat, hot water, electric, and water. OSP for 4 cars in rear. Rents below market value.
ⓘ Source: listings_history table (triggers on properties + properties_extension) + one-shot
backfill from property_details.listing_events for pre-trigger history.
Climate risk First Street
- Flood 5/10 Major FEMA zone X · 24% chance over 30 yrs
- Wildfire 3/10 Moderate
- Heat 4/10 Moderate 7 d/yr ≥97°F today · 16 d/yr by 30 yrs out
- Wind 3/10 Moderate 5% chance of damaging wind over 30 yrs
- Air quality 3/10 Moderate 2 unhealthy d/yr today · 4 by 30 yrs out
Nearby sold comps map
Loading sold comps map…
Walkable amenities ~0.75 mi
Loading nearby amenities…
Taxation est. · year 1
- Rental income
- $58,932
- − Mortgage interest
- −$16,525
- − Property taxes
- −$4,425
- − Insurance
- −$1,475
- − Repairs & maintenance
- −$4,715
- − Management
- −$4,715
- − Depreciation
- −$8,582
- Taxable income
- $18,496
- Est. tax owed @ 24.0%
- −$4,439
- After-tax cash flow
- $17,653/yr
For passive investors: Depreciation is non-cash, so a rental often shows a tax loss while cash-flowing — sheltering income. Rental losses are passive: they offset passive income freely, and up to $25,000/yr can offset ordinary (W-2) income if you actively participate and your MAGI is under $100k (phasing out to $0 by $150k); unused losses carry forward. On sale, claimed depreciation is recaptured at up to 25%, and gains may owe capital-gains tax (a 1031 exchange can defer both). Figures are a year-1 estimate at your 24.0% rate — not tax advice; consult a CPA.
Condition & rehab AI · 12 photos
This 4-unit property requires moderate renovations to improve its condition and increase its value. The kitchen and bathrooms are in poor condition and need major updates. The exterior siding and landscaping also need attention. Updating these areas will significantly boost its resale and rental value.
Repairs flagged
- Major kitchen cabinets — severely dated and worn
- Major bathroom fixtures — dated and worn
- Moderate exterior siding — weathered and some discoloration
- Minor landscaping — overgrown lawn
Value-add opportunities
- Both update kitchen cabinets and countertops — modernizing the kitchen will improve both resale and rental value
- Both update bathrooms with new fixtures and tiles — modernizing the bathrooms will improve both resale and rental value
- Rental landscape and maintain the lawn — a well-maintained lawn can attract tenants and improve rental value
Renovation cost estimate screening
| Repair item | Severity | Est. cost |
|---|---|---|
| kitchen cabinets · severely dated and worn | Major | $15,000–50,000 |
| bathroom fixtures · dated and worn | Major | $15,000–50,000 |
| exterior siding · weathered and some discoloration | Moderate | $3,000–15,000 |
| landscaping · overgrown lawn | Minor | $500–3,000 |
| Total estimated repair cost · 4 items | $33,500–118,000 |
Value-add ROI direction
- Both update kitchen cabinets and countertops — modernizing the kitchen will improve both resale and rental value ↑
- Both update bathrooms with new fixtures and tiles — modernizing the bathrooms will improve both resale and rental value ↑
- Rental landscape and maintain the lawn — a well-maintained lawn can attract tenants and improve rental value ↑
ⓘ Cost ranges are severity-bucket heuristics (US national rule-of-thumb). Get contractor quotes + a written scope before underwriting a rehab budget.
Schools (NCES district)
- District
- Wyoming Valley West SD
- NCES district ID
- 4225950
- Math proficiency
- 18% ▼ -11.00%
- Reading proficiency
- 42% ▼ -12.00%
- Median HH income
- $42,437
- Composite
- 25.38/100
- National rank
- #7470
- State rank
- #445 of 539 in PA
Livability — Kingston
- Score
- 81/100
- State rank
- #162
- US rank
- #1345
Category grades
Schools grade is shown separately in the Schools card above.
Census & demographics
- Census place
- Kingston, PA
- County
- Luzerne County · 118,885 people
- City population
- 31,149
- Metro
- Scranton--Wilkes-Barre, PA
- Population (ZIP)
- 31,149
- Household income
- $64,444
- Rent vs Own
- Severe rent burden
- 1454.0
Population outlook (Luzerne County) Hauer SSP2
- Today (2025)
- 319,505 people
- By 2030
- 319,943 · +0.1%
- By 2040
- 322,643 · +1.0%
- By 2050
- 330,817 · +3.5%
- By 2075
- 379,145 · +18.7%
- By 2100
- 431,908 · +35.2%
Race, ethnicity, and origin ACS 2023
- Neighborhood character
- Predominantly White (82%)
- Race & ethnicity
- White 82% Hispanic / Latino 8% Black 6% Two or more races 6%
- Hispanic origin (detail)
- Mexican 1% Puerto Rican 4% Dominican 1%
- Common ancestry
- Romanian 18% Scotch-Irish 4% Italian 2%
- Foreign-born
- 3% · Canada
- Languages at home
- 93% English-only · Spanish 4% Russian/Polish/Slavic 1%
Political lean MEDSL · Luzerne
- 2024 margin
- R (+19.2) · D 40.0% · R 59.2%
- 2008→2024 swing
- -27.6pp toward R · 2008: 8.4pp · 2024: -19.2pp
- All cycles
- 2024: R+19.2 2020: R+14.4 2016: R+19.6 2012: D+4.8 2008: D+8.4
Not yet ingested
- Civics
- —
Market trends
- HPI YoY
- ▼ -154.72%
- Current HPI
- 255.5375
- Rent YoY
- ▲ 4.65%
- Metro
- Scranton--Wilkes-Barre, PA
- State GDP YoY
- ▲ 1.68%
- F500 in state
- 34
Industry mix (Fortune 500 HQ in PA)
| Industry | F500 HQs | Revenue |
|---|---|---|
| Healthcare | 2 | $309B |
|
||
| Insurance | 2 | $27B |
|
||
| Telecommunications / Media | 1 | $124B |
|
||
| Industrial Distribution | 1 | $22B |
|
||
| Financial Services | 1 | $20B |
|
||
| Chemicals / Materials | 1 | $18B |
|
||
Price history
+168.2% since first listed4 events — show timeline
- 2026-06-01 Pending — LCAR
- 2026-05-14 Listed $295,000 LCAR
- 2020-02-21 Sold (MLS) $105,000 LCAR
- 2019-11-20 Listed $110,000 LCAR
Cash-flow waterfall
monthlySold comps — $/sqft
last 12 mo · ≤1 miLoading sold comps…