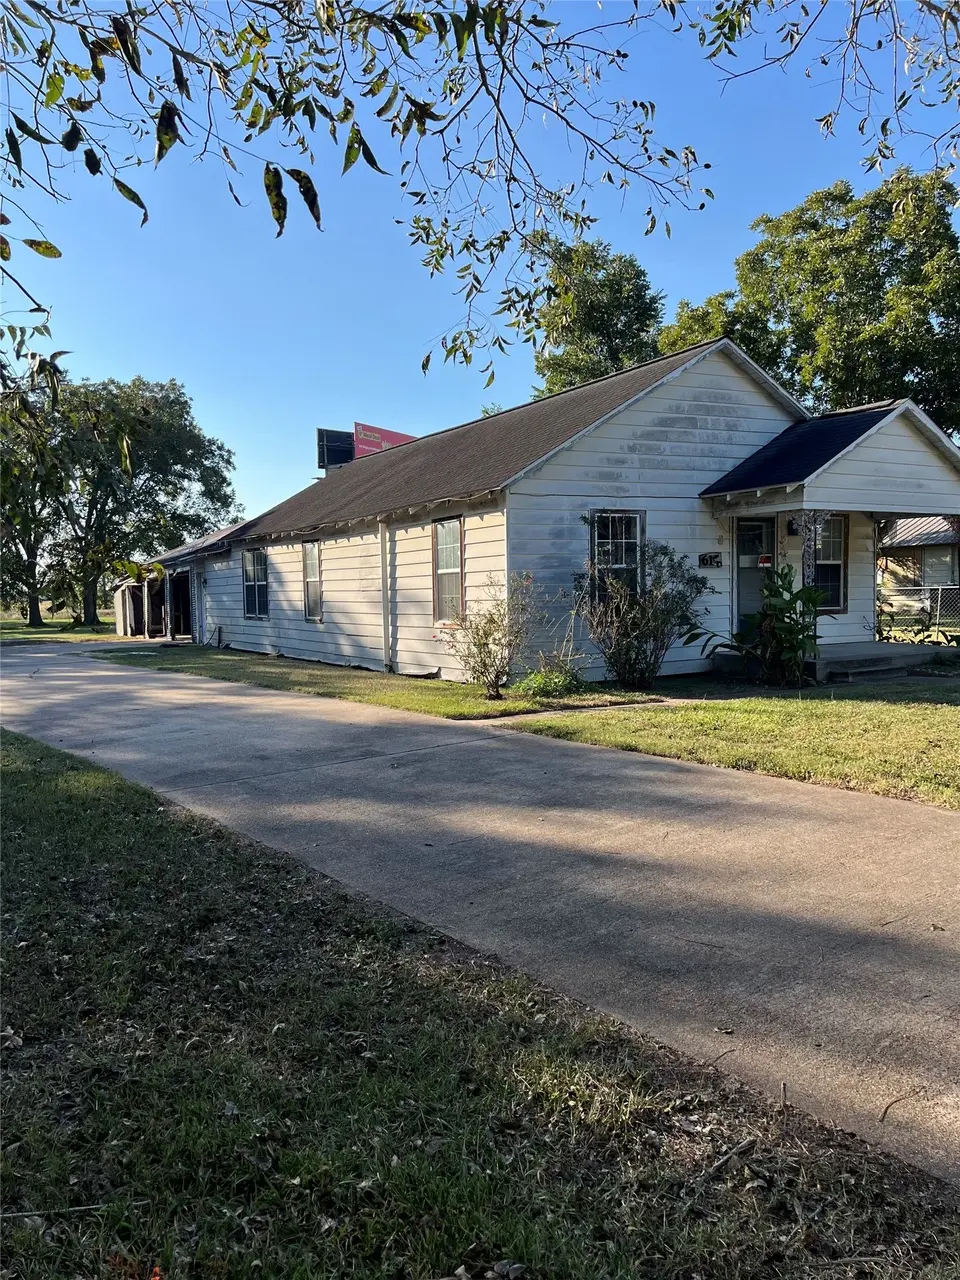
615 N Fourth St · Ganado, TX
Flood risk 1/10 · Minimal
- FEMA flood zone
- X (unshaded)
- Chance of flooding over 30 yrs
- 0.0%
- Est. flood insurance / yr
- $507 – $1,088
Fire risk 3/10 · Minor
- Est. fire insurance / yr
- $1,222 – $2,270
Heat risk 9/10 · Severe
- Hot days now (above 111°F)
- 7 days/yr
- Hot days in 30 yrs
- 22 days/yr
Wind risk 9/10 · Severe
- Chance of severe wind over 30 yrs
- 99.0%
Air-quality risk 1/10 · Minimal
- Unhealthy air days now
- 0 days/yr
- Unhealthy air days in 30 yrs
- 0 days/yr
Risk factors via First Street. Map © Google.
Why this score? — see what drove the B+ grade
The composite is a weighted blend of 9 inputs, each scored 0–100. Each bar is that input's sub-score; the figure is the points it added to the 100-point composite (weight × sub-score).
- Cash flow +30.0/30.0
- 1% rule +10.0/10.0
- DSCR +10.0/10.0
- ARV discount +7.5/15.0
- Appreciation +6.7/10.0
- Livability +3.9/5.0
- Schools +3.6/10.0
- Rent growth +2.5/5.0
- Condition / age +2.5/5.0
$60,000
🖨 Deal sheet 📄 Offer letter ✓ Due diligence
Listing remarks MLS
Home can use some TLC but has lots of potential to tailor to your needs. Large lot. Secondary building with electrical and water (great potential for income producing). Selling "AS IS"! Schedule a showing today!
Key facts
- Large lot
- Secondary building
- 0.45 acre lot
Tags
Neighborhood map
What this means for you Summary
Snapshot
- This is a 3-bed/1.5-bath single-family listed at $60k.
Deal economics
- At list price, monthly cash flow is $281 ($3k/yr) — positive.
- The deal already cash-flows at list — no discount required.
- Meets the 1% rule at list price ($921 rent vs $60k).
- Recommended offer: $56k (6.0% below list) — sets the bar for market timing.
Location & tenants
- Location reads 78/100 on livability (#70 in TX, #2,570 nationally) — a middle-class / working-renter tenant base. Strengths: crime A+, cost of living A+, housing A+; Watch: schools D-, amenities F, commute F.
- Ganado ISD (rural): math 43% / reading 39% proficiency, ranked #345 of 826 in TX (top 42%) — families likely to look elsewhere, expect single-tenant / working-renter base with shorter leases.
- Market conditions: 24 active listings in the ZIP; 2 comparable units currently listed for rent nearby.
Forward outlook
- In year one you build about $2k of equity ($415 loan paydown + $2k appreciation (3.4% local appreciation)).
- Jackson County population projected at +28% by 2050 — long-run rental-demand tailwind backs the buy-and-hold thesis.
- At projected returns (3.4% appreciation + 3.0% rent growth), your $17k cash investment doubles in ~3 years — after that, you're playing with house money.
Negotiation context
- It's been on market 66 days — a 6% lower offer ($56k) is reasonable based on typical stale-listing flexibility.
- 3 sale attempts with the ask held roughly flat each time — persistent listings suggest the price (not the market) is what's stuck; bring a comps-based counter.
- Current owner paid $26k; list at $60k implies a 131% gain — meaningful room to come down on a strong offer.
Risks & watch-outs
- Climate carrying-cost: severe wind risk, 99% chance of damaging wind over 30y; extreme-heat days projected 7→22/yr by 2055 (HVAC capex compounding) — expect insurance premiums to compound above CPI over the hold.
Questions for the listing agent
- It's been on market 66 days. Have you received any prior offers? Is the seller open to a 6% concession, seller financing, or rate buy-down credit?
- Built in 1972 — when were the roof, HVAC, electrical panel, plumbing, and water heater last replaced?
- Why hasn't it sold? Are there any deal-killer items the seller is aware of (foundation, flood, title, zoning, code violations)?
- Is there a deadline driving the sale (1031 exchange, divorce, estate, relocation)? That informs how much negotiation room exists.
- Schools are D-rated, which usually means shorter tenancies and higher turnover. Who's the typical renter profile here, and what's been the actual vacancy rate?
- What's the average days-on-market for RENTAL listings here right now (not sales)? A rising rental-DOM trend means longer vacancies and softer asking-rent achievability than the comps imply.
- What's the recent tenant-quality profile in this submarket — average credit score on applications, eviction rate, late-payment / NSF rate, and stable-employment percentage? A property-management company in the area should have these aggregated.
- How much new for-sale + rental construction is in the pipeline within 1–3 miles? Heavy new supply typically softens prices + rents 12–24 months out; constrained supply supports both.
Investment metrics
- 1% rule
- 1.54% ✓
- Cap rate
- 11.92%
- Cash-on-cash
- 20.09%
- DSCR
- 1.89
- GRM
- 5.4
CMA / ARV
- ARV (median comp)
- $122,769
- List price
- $60,000
- Delta
- -51.13%
- Verdict
- UNDERPRICED
- Comps
- 6 within 1.0 mi
Show comp detail 1 sale within ~0.75 mi
| Address | Dist | Beds/Ba | Sqft | Sold | Price | $/sf | Match |
|---|---|---|---|---|---|---|---|
| 614 County Road 254 | 0.05mi | 3/1.0 | 1,178 (-8%) | 14mo | $110,000 | $93 | 71 |
Match score weights: distance 35% · size 25% · config 20% · recency 20%. Top-matched comps best support the ARV.
Projected returns pro-forma
3.41% appreciation · 3.0% rent growth · sell at horizon
- IRR
- 27.2%
- Equity multiple
- 2.58×
- Total profit
- $26,471
- Equity at exit
- $28,358
- IRR
- 27.5%
- Equity multiple
- 5.02×
- Total profit
- $67,606
- Equity at exit
- $44,807
Cash invested: $16,800 (down + closing). Projections, not guarantees.
Landlord ↔ Tenant lean methodology
- Overall (STATE)
- 87 Strongly Landlord-Friendly
- State Texas
- 87 Strongly Landlord-Friendly · R+5
- County
- — inherits STATE
- City
- — inherits STATE
ZIP-level market 77962
- Home prices YoY
- 1.8%
- Active inventory
- 24
- Price-to-rent
- 5.4×
Monthly cashflow live
- Estimated rent
- $921 medium interval (Pro) →
- Mortgage (P&I)
- −$315
- Tax from tax record
- −$107 /mo · $1,284/yr
- Insurance
- −$25
- HOA
- −$0
- Vacancy / Maint / Mgmt
- −$193
- Net cashflow
- $281
Break-even live
UW: 25.0% down · 7.5% · 30yr · 1.5% tax · 5.0% vac · 8.0% maint · 8.0% mgmt
Financing live
Cash to close
- Down payment
- $15,000
- Closing costs
- $1,800
- Reserves months
- —
- Total cash needed
- —
Loan-product check · same deal, 3 products live
Conventional
25% down · 7.5% · 30yr
- Down + closing
- —
- Monthly P&I
- —
- Monthly cashflow
- —
- DSCR
- —
- Eligible?
- —
Personal DTI + credit; lowest rate.
DSCR
20% down · 8.5% · 30yr
- Down + closing
- —
- Monthly P&I
- —
- Monthly cashflow
- —
- DSCR
- —
- Eligible?
- —
No personal income docs; deal must DSCR.
Hard money
10% down · 12.0% · 12mo
- Down + closing
- —
- Monthly P&I
- —
- Monthly cashflow
- —
- DSCR
- —
- Eligible?
- —
Short-term bridge; refi at stabilization.
Rent comps 2 comps
| Address | Beds | Baths | Sqft | Rent | $/sqft | DOM | Units | Dist |
|---|---|---|---|---|---|---|---|---|
| 1611 S 3rd St Unit 1213 Ganado, TX | 2.0 | 2.0 | 885 | $785 | $0.89 | 43d | 1 | 1.43mi |
| 1611 S 3rd St Unit 1300 Ganado, TX | 3.0 | 2.0 | 1189 | $1,025 | $0.86 | 43d | 1 | 1.46mi |
Listing history 21 events
-
2026-06-18days on market $60,000 Active 66 DOM
-
2026-06-17days on market $60,000 Active 65 DOM
-
2026-06-16days on market $60,000 Active 64 DOM
-
2026-06-15days on market $60,000 Active 63 DOM
-
2026-06-13days on market $60,000 Active 61 DOM
-
2026-06-12days on market $60,000 Active 60 DOM
-
2026-06-09days on market $60,000 Active 57 DOM
-
2026-06-08days on market $60,000 Active 56 DOM
-
2026-06-08days on market $60,000 Active 55 DOM
-
2026-06-05days on market $60,000 Active 53 DOM
-
2026-06-03days on market $60,000 Active 51 DOM
-
2026-06-02days on market $60,000 Active 50 DOM
-
2026-06-01days on market $60,000 Active 49 DOM
-
2026-05-31days on market $60,000 Active 48 DOM
-
2026-04-13historical
Show marketing remark (224 chars)
Home can use some TLC but has lots of potential to tailor to your needs. Large lot. Secondary building with electrical and water (great potential for income producing). Selling "AS IS"! Schedule a showing today!
-
2026-04-13$60,000 Active 224-char remark
Show marketing remark (224 chars)
Home can use some TLC but has lots of potential to tailor to your needs. Large lot. Secondary building with electrical and water (great potential for income producing). Selling "AS IS"! Schedule a showing today!
-
2025-11-24status Active
-
2025-11-04status Pending
-
2025-10-24status Pending
-
2025-10-15$70,000 Active
-
1993-09-01soldstatus $26,000
ⓘ Source: listings_history table (triggers on properties + properties_extension) + one-shot
backfill from property_details.listing_events for pre-trigger history.
Tax reassessment forecast TX · Resets to sale price
- Current annual tax
- $1,284 · $107/mo
- Projected year-2 tax
- $1,284 · $107/mo
- Expected delta
- $0/yr ($0/mo · 0.0%)
ⓘ Screening estimate from a state-policy table — verify with the county assessor before closing.
Climate risk First Street
- Flood 1/10 Low FEMA zone X (unshaded) · 0% chance over 30 yrs
- Wildfire 3/10 Moderate
- Heat 9/10 Extreme 7 d/yr ≥111°F today · 22 d/yr by 30 yrs out
- Wind 9/10 Extreme 99% chance of damaging wind over 30 yrs
- Air quality 1/10 Low 0 unhealthy d/yr today · 0 by 30 yrs out
Nearby sold comps map
Loading sold comps map…
Walkable amenities ~0.75 mi
Loading nearby amenities…
Taxation est. · year 1
- Rental income
- $11,056
- − Mortgage interest
- −$3,361
- − Property taxes
- −$1,284
- − Insurance
- −$300
- − Repairs & maintenance
- −$885
- − Management
- −$885
- − Depreciation
- −$1,745
- Taxable income
- $2,597
- Est. tax owed @ 24.0%
- −$623
- After-tax cash flow
- $2,752/yr
For passive investors: Depreciation is non-cash, so a rental often shows a tax loss while cash-flowing — sheltering income. Rental losses are passive: they offset passive income freely, and up to $25,000/yr can offset ordinary (W-2) income if you actively participate and your MAGI is under $100k (phasing out to $0 by $150k); unused losses carry forward. On sale, claimed depreciation is recaptured at up to 25%, and gains may owe capital-gains tax (a 1031 exchange can defer both). Figures are a year-1 estimate at your 24.0% rate — not tax advice; consult a CPA.
Schools (NCES district)
- District
- Ganado ISD
- NCES district ID
- 4820310
- Math proficiency
- 43% ▲ 2.00%
- Reading proficiency
- 39% ▼ -6.00%
- Median HH income
- $54,618
- Composite
- 35.79/100
- National rank
- #4838
- State rank
- #345 of 826 in TX
Livability — Ganado
- Score
- 78/100
- State rank
- #70
- US rank
- #2570
Category grades
Schools grade is shown separately in the Schools card above.
Census & demographics
- Census place
- Ganado, TX
- City population
- 3,325
- Population (ZIP)
- 3,325
Population outlook (Jackson County) Hauer SSP2
- Today (2025)
- 16,579 people
- By 2030
- 17,480 · +5.4%
- By 2040
- 19,328 · +16.6%
- By 2050
- 21,182 · +27.8%
- By 2075
- 25,781 · +55.5%
- By 2100
- 28,184 · +70.0%
Race, ethnicity, and origin ACS 2023
- Neighborhood character
- Diverse neighborhood (Simpson 0.56)
- Race & ethnicity
- White 51% Hispanic / Latino 42% Two or more races 17% Black 5%
- Hispanic origin (detail)
- Mexican 42%
- Common ancestry
- Lithuanian 2% Hungarian 2% Romanian 1%
- Foreign-born
- 11% · Canada, China
- Languages at home
- 69% English-only · Spanish 29% Russian/Polish/Slavic 1% Chinese 1%
Political lean MEDSL · Jackson
- 2024 margin
- Solid R (+70.8) · D 14.3% · R 85.1%
- 2008→2024 swing
- -22.9pp toward R · 2008: -47.9pp · 2024: -70.8pp
- All cycles
- 2024: R+70.8 2020: R+66.2 2016: R+63.7 2012: R+56.5 2008: R+47.9
Not yet ingested
- Civics
- —
Market trends
- HPI YoY
- ▲ 3.41%
- Current HPI
- 193.3816
- Rent YoY
- —
- Metro
- —
- State GDP YoY
- ▲ 3.95%
- F500 in state
- 110
Industry mix (Fortune 500 HQ in TX)
| Industry | F500 HQs | Revenue |
|---|---|---|
| Energy | 16 | $1,198B |
|
||
| Technology | 5 | $198B |
|
||
| Engineering / Construction | 4 | $72B |
|
||
| Energy Services | 3 | $60B |
|
||
| Utilities | 3 | $41B |
|
||
| Healthcare | 2 | $330B |
|
||
Price history
+130.8% since first listed7 events — show timeline
- 2026-04-13 Listed $60,000 HARMLS
- 2026-04-13 Listing Removed — HARMLS
- 2025-11-24 Relisted — HARMLS
- 2025-11-04 Pending — HARMLS
- 2025-10-24 Pending — HARMLS
- 2025-10-15 Listed $70,000 HARMLS
- 1993-09-01 Sold (Public Records) $26,000 Public Records
Property tax history
+1.4%/yrLatest (2025): $1,284 · -4.5% YoY. Source: county tax records.
Cash-flow waterfall
monthlySold comps — $/sqft
last 12 mo · ≤1 miLoading sold comps…