68860 Foley Dr · Twentynine Palms, CA
Flood risk 1/10 · Minimal
- FEMA flood zone
- X (unshaded)
- Chance of flooding over 30 yrs
- 0.0%
- Est. flood insurance / yr
- $507 – $1,088
Fire risk 1/10 · Minimal
- Est. fire insurance / yr
- $659 – $1,223
Heat risk 8/10 · Major
- Hot days now (above 105°F)
- 7 days/yr
- Hot days in 30 yrs
- 20 days/yr
Wind risk 1/10 · Minimal
- Chance of severe wind over 30 yrs
- —
Air-quality risk 6/10 · Moderate
- Unhealthy air days now
- 12 days/yr
- Unhealthy air days in 30 yrs
- 15 days/yr
Risk factors via First Street. Map © Google.
Why this score? — see what drove the F grade
The composite is a weighted blend of 9 inputs, each scored 0–100. Each bar is that input's sub-score; the figure is the points it added to the 100-point composite (weight × sub-score).
- Cash flow +7.5/30.0
- ARV discount +7.5/15.0
- Rent growth +3.6/5.0
- Livability +3.0/5.0
- Condition / age +2.5/5.0
- Schools +2.2/10.0
- DSCR +1.7/10.0
- 1% rule +1.0/10.0
- Appreciation +0.0/10.0
$195,000
🖨 Deal sheet (PDF) 📄 Offer letter ✓ Due diligence
Listing remarks MLS
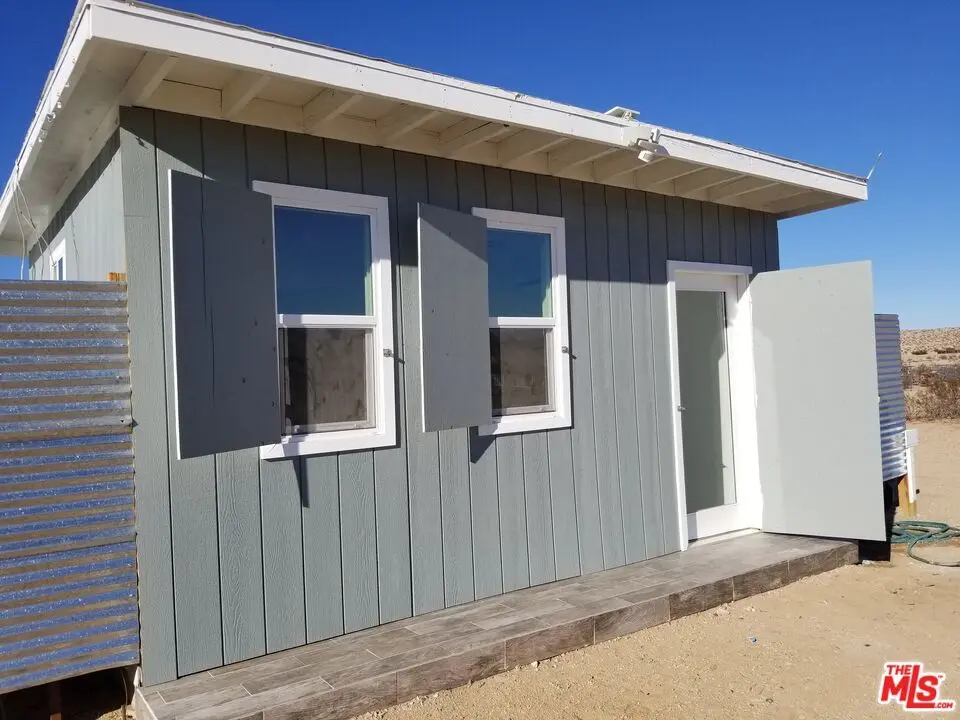
Exceptional opportunity to own a legally converted Single Family Residence on 5 acres with public water in the highly desirable Desert Heights area. An active public water meter on a full 5-acre parcel is rare and highly valuable in this location. No hauling water, storage tanks, or concerns over well failure or contamination. Originally a cabin, the structure has been legally converted to an SFR and is expected to be delivered with a Certificate of Occupancy. The approximately 200 sq ft fully remodeled home features a kitchen, bathroom, tile flooring throughout, and a newly installed, permitted septic system. Enjoy privacy, open desert views, and star filled skies while remaining just minutes from shops, restaurants, and the growing Joshua Tree community. Approximately 17 minutes (14.3 miles) to the West Entrance and 22 minutes (15.6 miles) to the North Entrance of Joshua Tree National Park, which attracts over 3 million visitors annually. The property operates on solar power and includes a small tri-fuel backup generator. An electrical pole is located near the corner of Los Olivos Ave. and Foley Dr. Buyer to verify feasibility and cost of connecting to public electricity. A detached shed is located on the property. There may be potential to split the parcel into two 2.5-acre lots, and each parcel may allow additional structures (buyer to verify). Seller and broker make no representations regarding subdivision or development potential. Buyer to verify all zoning, land use, and development standards with the San Bernardino County Land Use Services Department. GPS Coordinates: 34.189949, -116.160743 for mapping purposes, please cut and paste GPS coordinates.
Key facts
- 5 acre lot
- Parking
- Listed 63 days
Neighborhood map
What this means for you Summary
Snapshot
- This is a 2-bed/1.0-bath other listed at $195k.
Deal economics
- At list price, monthly cash flow is $-239 ($-3k/yr) — negative.
- To cash-flow at today's rent, offer at most $153k (21.6% below list).
- To meet the 1% rule (rent ≥ 1% of price), the offer needs to be $118k (39.6% below list).
- Recommended offer: $118k (39.6% below list) — sets the bar for 1% rule.
Location & tenants
- Location reads 59/100 on livability (#622 in CA) — a working-class tenant base; expect higher turnover. Strengths: commute A+, housing A+; Watch: amenities F, employment D-, health & safety F.
- Morongo Unified (town): math 15% / reading 38% proficiency, ranked #395 of 517 in CA (top 76%) — low school quality limits family demand, transient renter base, plan for 1-2y turnover.
- Zoned schools: Twentynine Palms Elementary (math 10% / reading 24%, grade F, #1,335 of 1,571 statewide, top 85%, 548 students, 47% FRL); Twentynine Palms Junior High (math 17% / reading 39%, grade F, #236 of 498 statewide, top 48%, 413 students, 63% FRL); Twentynine Palms High (math 32% / reading 62%, grade D-, #389 of 1,170 statewide, top 35%, 729 students, 66% FRL) — zoned schools at 59% FRL track the district average.
- Market conditions: Rents rising fast (+4.5%/yr); 751 active listings in the ZIP; 5,458 units permitted in San Bernardino County in 2024 (1,500 in 5+ unit buildings).
Forward outlook
- Local home prices are declining (-3.0%/yr); year-one equity from $1k of loan paydown is wiped out by about $6k of value loss. Plan a longer hold.
- San Bernardino County population projected at +15% by 2050 — modest demand growth; plan on rents tracking national, not racing it.
Negotiation context
- It's been on market 63 days — a 6% lower offer ($183k) is reasonable based on typical stale-listing flexibility.
- 6 sale attempts since 7y ago with the ask held roughly flat each time — persistent listings suggest the price (not the market) is what's stuck; bring a comps-based counter.
- Current owner paid $40k; list at $195k implies a 388% gain — meaningful room to come down on a strong offer.
Risks & watch-outs
- Watch-outs: built in 1956 — expect roof / HVAC / electrical / plumbing capex.
- Climate carrying-cost: extreme-heat days projected 7→20/yr by 2055 (HVAC capex compounding) — expect insurance premiums to compound above CPI over the hold.
Questions for the listing agent
- What do current leases actually rent for vs. the listed asking? Can we see a recent rent roll and the last 12 months of T-12 income?
- It's been on market 63 days. Have you received any prior offers? Is the seller open to a 40% concession, seller financing, or rate buy-down credit?
- Built in 1956 — when were the roof, HVAC, electrical panel, plumbing, and water heater last replaced?
- Why hasn't it sold? Are there any deal-killer items the seller is aware of (foundation, flood, title, zoning, code violations)?
- Is there a deadline driving the sale (1031 exchange, divorce, estate, relocation)? That informs how much negotiation room exists.
- Schools are D-rated, which usually means shorter tenancies and higher turnover. Who's the typical renter profile here, and what's been the actual vacancy rate?
- The area grade is low — what's the realistic commute time and amenity access for the typical tenant pool here? Any planned neighborhood developments (good or bad) we should know about?
- What's the average days-on-market for RENTAL listings here right now (not sales)? A rising rental-DOM trend means longer vacancies and softer asking-rent achievability than the comps imply.
- What's the recent tenant-quality profile in this submarket — average credit score on applications, eviction rate, late-payment / NSF rate, and stable-employment percentage? A property-management company in the area should have these aggregated.
- How much new for-sale + rental construction is in the pipeline within 1–3 miles? Heavy new supply typically softens prices + rents 12–24 months out; constrained supply supports both.
Investment metrics
- 1% rule
- 0.60% ✗
- Cap rate
- 4.83%
- Cash-on-cash
- -5.24%
- DSCR
- 0.77
- GRM
- 13.8
CMA / ARV
No comps found within radius.
Projected returns pro-forma
-3.0% appreciation · 4.45% rent growth · sell at horizon
- IRR
- -24.0%
- Equity multiple
- 0.17×
- Total profit
- $-45,140
- Equity at exit
- $29,075
- IRR
- -16.2%
- Equity multiple
- 0.05×
- Total profit
- $-51,878
- Equity at exit
- $16,860
Cash invested: $54,600 (down + closing). Projections, not guarantees.
Landlord ↔ Tenant lean methodology
- Overall (STATE)
- 18 Strongly Tenant-Friendly
- State California
- 18 Strongly Tenant-Friendly · D+13
- County
- — inherits STATE
- City
- — inherits STATE
ZIP-level market 92277
- Home prices YoY
- -3.1%
- Rents YoY
- 4.5%
- Active inventory
- 751
- Price-to-rent
- 13.8×
Monthly cashflow live
- Estimated rent
- $1,177 medium interval (Pro) →
- Mortgage (P&I)
- −$1,023
- Tax from tax record
- −$65 /mo · $778/yr
- Insurance
- −$81
- HOA
- −$0
- Vacancy / Maint / Mgmt
- −$247
- Net cashflow
- $-239
Break-even live
Sensitivity live
| Price | -10% $-128 | -5% $-183 | +0% $-239 | +5% $-294 | +10% $-349 |
|---|---|---|---|---|---|
| Rent | -10% $-332 | -5% $-285 | +0% $-239 | +5% $-192 | +10% $-146 |
| Rate | -1.0pp $-140 | -0.5pp $-189 | base $-239 | +0.5pp $-289 | +1.0pp $-340 |
UW: 25.0% down · 7.5% · 30yr · 1.5% tax · 5.0% vac · 8.0% maint · 8.0% mgmt
Financing live
Cash to close
- Down payment
- $48,750
- Closing costs
- $5,850
- Reserves months
- —
- Total cash needed
- —
Loan-product check · same deal, 3 products live
Conventional
25% down · 7.5% · 30yr
- Down + closing
- —
- Monthly P&I
- —
- Monthly cashflow
- —
- DSCR
- —
- Eligible?
- —
Personal DTI + credit; lowest rate.
DSCR
20% down · 8.5% · 30yr
- Down + closing
- —
- Monthly P&I
- —
- Monthly cashflow
- —
- DSCR
- —
- Eligible?
- —
No personal income docs; deal must DSCR.
Hard money
10% down · 12.0% · 12mo
- Down + closing
- —
- Monthly P&I
- —
- Monthly cashflow
- —
- DSCR
- —
- Eligible?
- —
Short-term bridge; refi at stabilization.
Listing history 22 events
-
2026-06-09days on market $195,000 Active 63 DOM
-
2026-06-08days on market $195,000 Active 62 DOM
-
2026-06-07days on market $195,000 Active 61 DOM
-
2026-06-04days on market $195,000 Active 58 DOM
-
2026-06-03days on market $195,000 Active 57 DOM
-
2026-06-02days on market $195,000 Active 56 DOM
-
2026-06-01days on market $195,000 Active 55 DOM
-
2026-05-31days on market $195,000 Active 54 DOM
-
2026-04-07$195,000 Active 1685-char remark
Show marketing remark (1685 chars)
Exceptional opportunity to own a legally converted Single Family Residence on 5 acres with public water in the highly desirable Desert Heights area. An active public water meter on a full 5-acre parcel is rare and highly valuable in this location. No hauling water, storage tanks, or concerns over well failure or contamination. Originally a cabin, the structure has been legally converted to an SFR and is expected to be delivered with a Certificate of Occupancy. The approximately 200 sq ft fully remodeled home features a kitchen, bathroom, tile flooring throughout, and a newly installed, permitted septic system. Enjoy privacy, open desert views, and star filled skies while remaining just minutes from shops, restaurants, and the growing Joshua Tree community. Approximately 17 minutes (14.3 miles) to the West Entrance and 22 minutes (15.6 miles) to the North Entrance of Joshua Tree National Park, which attracts over 3 million visitors annually. The property operates on solar power and includes a small tri-fuel backup generator. An electrical pole is located near the corner of Los Olivos Ave. and Foley Dr. Buyer to verify feasibility and cost of connecting to public electricity. A detached shed is located on the property. There may be potential to split the parcel into two 2.5-acre lots, and each parcel may allow additional structures (buyer to verify). Seller and broker make no representations regarding subdivision or development potential. Buyer to verify all zoning, land use, and development standards with the San Bernardino County Land Use Services Department. GPS Coordinates: 34.189949, -116.160743 for mapping purposes, please cut and paste GPS coordinates.
-
2026-03-14price
-
2026-03-04price
-
2026-01-31Active
-
2021-09-15soldstatus $40,000 Closed Sale
-
2021-07-11$55,888 Active
-
2021-07-10historical $55,888
-
2020-11-02soldstatus $20,000 Closed Sale
-
2020-10-06historical Active Under Contract
-
2020-08-10status Active
-
2020-08-05historical Active Under Contract
-
2020-07-12status Active
-
2020-07-02historical Active Under Contract
-
2019-08-24$25,000 Active
ⓘ Source: listings_history table (triggers on properties + properties_extension) + one-shot
backfill from property_details.listing_events for pre-trigger history.
Tax reassessment forecast CA · Resets to sale price
- Current annual tax
- $778 · $65/mo
- Projected year-2 tax
- $1,482 · $124/mo
- Expected delta
- +$704/yr (+$59/mo · 90.5%)
ⓘ Screening estimate from a state-policy table — verify with the county assessor before closing.
Climate risk First Street
- Flood 1/10 Low FEMA zone X (unshaded) · 0% chance over 30 yrs
- Wildfire 1/10 Low
- Heat 8/10 Severe 7 d/yr ≥105°F today · 20 d/yr by 30 yrs out
- Wind 1/10 Low
- Air quality 6/10 Major 12 unhealthy d/yr today · 15 by 30 yrs out
Nearby sold comps map
Loading sold comps map…
Walkable amenities ~0.75 mi
Loading nearby amenities…
Taxation est. · year 1
- Rental income
- $14,129
- − Mortgage interest
- −$10,923
- − Property taxes
- −$778
- − Insurance
- −$975
- − Repairs & maintenance
- −$1,130
- − Management
- −$1,130
- − Depreciation
- −$5,673
- Taxable loss
- −$6,480
- Est. tax savings @ 24.0%
- +$1,555
- After-tax cash flow
- $-1,307/yr
For passive investors: Depreciation is non-cash, so a rental often shows a tax loss while cash-flowing — sheltering income. Rental losses are passive: they offset passive income freely, and up to $25,000/yr can offset ordinary (W-2) income if you actively participate and your MAGI is under $100k (phasing out to $0 by $150k); unused losses carry forward. On sale, claimed depreciation is recaptured at up to 25%, and gains may owe capital-gains tax (a 1031 exchange can defer both). Figures are a year-1 estimate at your 24.0% rate — not tax advice; consult a CPA.
Schools (NCES district)
- District
- Morongo Unified
- NCES district ID
- 0625860
- Math proficiency
- 15% ▼ -12.00%
- Reading proficiency
- 38% ▼ -3.00%
- Median HH income
- $39,399
- Composite
- 22.19/100
- National rank
- #8156
- State rank
- #395 of 517 in CA
Livability — Twentynine Palms
- Score
- 59/100
- State rank
- #622
- US rank
- #19731
Category grades
Schools grade is shown separately in the Schools card above.
Census & demographics
- County
- San Bernardino County · 2,030,291 people
- City population
- 26,277
- Metro
- Riverside-San Bernardino-Ontario, CA
- Population (ZIP)
- 26,277
- Household income
- $60,901
- Rent vs Own
- Severe rent burden
- 1057.0
Population outlook (San Bernardino County) Hauer SSP2
- Today (2025)
- 2,300,329 people
- By 2030
- 2,378,907 · +3.4%
- By 2040
- 2,523,137 · +9.7%
- By 2050
- 2,642,388 · +14.9%
- By 2075
- 2,880,769 · +25.2%
- By 2100
- 2,909,436 · +26.5%
Race, ethnicity, and origin ACS 2023
- Neighborhood character
- Diverse neighborhood (Simpson 0.70)
- Race & ethnicity
- White 49% Two or more races 24% Hispanic / Latino 24% Black 9% Asian 4% Pacific Islander 1% Native American 1%
- Hispanic origin (detail)
- Mexican 20%
- Common ancestry
- Italian 5% Lithuanian 3% Slovak 3%
- Foreign-born
- 9% · Canada, China, South Korea
- Languages at home
- 81% English-only · Spanish 12% Other Asian/Pacific 2% Tagalog/Filipino 1%
Political lean MEDSL · San Bernardino
- 2024 margin
- Toss-up / Even · D 47.5% · R 49.7% · Other 2.8%
- 2008→2024 swing
- -8.5pp toward R · 2008: 6.3pp · 2024: -2.1pp
- All cycles
- 2024: R+2.1 2020: D+10.7 2016: D+9.8 2012: D+5.4 2008: D+6.3
Not yet ingested
- Civics
- —
Market trends
- HPI YoY
- ▼ -12.15%
- Current HPI
- 380.5083
- Rent YoY
- ▲ 4.45%
- Metro
- Riverside-San Bernardino-Ontario, CA
- State GDP YoY
- ▲ 3.21%
- F500 in state
- 116
Industry mix (Fortune 500 HQ in CA)
| Industry | F500 HQs | Revenue |
|---|---|---|
| Technology | 27 | $1,492B |
|
||
| Financial Services | 3 | $174B |
|
||
| Retail | 3 | $44B |
|
||
| Insurance | 3 | $26B |
|
||
| Media / Entertainment | 2 | $115B |
|
||
| Pharmaceuticals / Biotech | 2 | $62B |
|
||
Price history
+680.0% since first listed14 events — show timeline
- 2026-04-07 Listed $195,000 TheMLS
- 2026-03-14 Price Changed — TheMLS
- 2026-03-04 Price Changed — TheMLS
- 2026-01-31 Listed — TheMLS
- 2021-09-15 Sold (MLS) $40,000 CRMLS
- 2021-07-11 Listed $55,888 CRMLS
- 2021-07-10 Coming Soon $55,888 CRMLS
- 2020-11-02 Sold (MLS) $20,000 CRMLS
- 2020-10-06 Contingent — CRMLS
- 2020-08-10 Relisted — CRMLS
- 2020-08-05 Contingent — CRMLS
- 2020-07-12 Relisted — CRMLS
- 2020-07-02 Contingent — CRMLS
- 2019-08-24 Listed $25,000 CRMLS
Property tax history
+3.4%/yrLatest (2025): $778 · +3.7% YoY. Source: county tax records.
Cash-flow waterfall
monthlySold comps — $/sqft
last 12 mo · ≤1 miLoading sold comps…