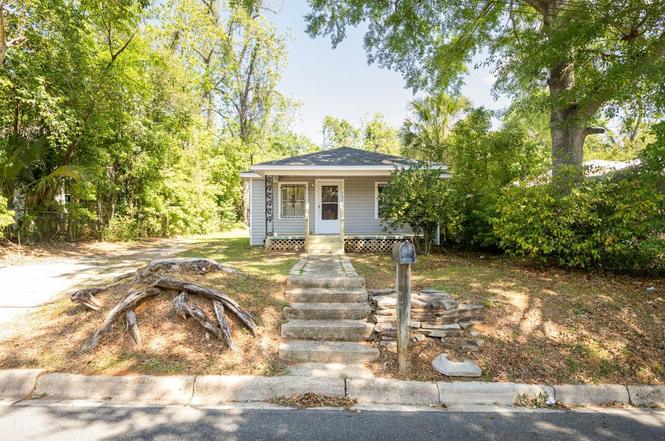
722 Dover St · Tallahassee, FL
Flood risk 1/10 · Minimal
- FEMA flood zone
- X (unshaded)
- Chance of flooding over 30 yrs
- 0.0%
- Est. flood insurance / yr
- $507 – $1,088
Fire risk 1/10 · Minimal
- Est. fire insurance / yr
- $947 – $1,759
Heat risk 8/10 · Major
- Hot days now (above 108°F)
- 7 days/yr
- Hot days in 30 yrs
- 20 days/yr
Wind risk 9/10 · Severe
- Chance of severe wind over 30 yrs
- 99.0%
Air-quality risk 5/10 · Moderate
- Unhealthy air days now
- 7 days/yr
- Unhealthy air days in 30 yrs
- 7 days/yr
Risk factors via First Street. Map © Google.
Why this score? — see what drove the B+ grade
The composite is a weighted blend of 9 inputs, each scored 0–100. Each bar is that input's sub-score; the figure is the points it added to the 100-point composite (weight × sub-score).
- Cash flow +29.3/30.0
- ARV discount +15.0/15.0
- DSCR +10.0/10.0
- 1% rule +8.0/10.0
- Schools +4.3/10.0
- Livability +4.3/5.0
- Rent growth +3.7/5.0
- Condition / age +2.2/5.0
- Appreciation +0.0/10.0
$115,000
🖨 Deal sheet 📄 Offer letter ✓ Due diligence
Listing remarks MLS
Cute 3/1 with split plan, nice sized bedrooms, inside utility room with washer/dryer hook ups, and much more. There is a covered front porch and large mostly fenced yard. Convenient location to downtown, FSU, FAMU, TCC, state offices, restaurants, and shopping! Could rent for $775 in its current shape or up to $850 with a few upgrades. Could also be a great first home! Selling as-is. All dimensions are approximate.
Key facts
- Remodeled bathroom
- New roof
- New hvac system
Tags
Property features AI
Finance
- Financial info: Offered for sale
Exterior
- Parking: Driveway
- Utilities: Public sewer
- Home design: Single-story; Vinyl siding
- Construction: Vinyl siding construction
- Exterior features: Covered porch; Paved road access
Interior
- Kitchen: Oven; Range; Refrigerator
- Bedrooms: Bedroom 2 (10x10); Bedroom 3 (10x10)
- Flooring: Carpet; Laminate; Tile
- Bathrooms: 1 full bathroom
- Heating & cooling: Central heating (electric); Central air; Ceiling fans; Electric cooling
- Interior features: Pantry
- Laundry & utility: Washer; Dryer; Utility room
Neighborhood map
What this means for you Summary
Snapshot
- This is a 3-bed/1.0-bath single-family listed at $115k. Condition is rated fair.
Deal economics
- At list price, monthly cash flow is $405 ($5k/yr) — positive.
- The deal already cash-flows at list — no discount required.
- Meets the 1% rule at list price ($1k rent vs $115k).
- Recommended offer: $108k (6.0% below list) — sets the bar for market timing.
- Cap rate 10.5% vs local median 4.2% in Tallahassee — top-decile yield for the area; either an underpriced asset or a hidden risk that comps aren't pricing in. Stress-test before assuming the spread holds.
Location & tenants
- Location reads 86/100 on livability (#19 in FL, #429 nationally) — a professional / high-income tenant draw. Strengths: amenities A+, commute A+, health & safety A+; Watch: employment D.
- Leon (urban): math 48% / reading 53% proficiency, ranked #33 of 73 in FL (top 45%) — acceptable for families but not a draw, mixed tenant base, ~2y average lease.
- Market conditions: Rents rising fast (+4.7%/yr); 142 active listings in the ZIP; 32 comparable units currently listed for rent nearby; rentals at typical pace (median 21d on market — plan ~3-4 weeks tenant-placement turnaround); lower-income renter base — watch delinquency; 1,765 units permitted in Leon County in 2024 (975 in 5+ unit buildings).
- At $1,493/mo this rent would consume 55% of the median local household income ($32k/yr) (locally 6995% of renters already pay >50% of income on rent) — very limited rent-growth headroom before tenants either downsize or default.
Forward outlook
- Local home prices are declining (-3.0%/yr); year-one equity from $795 of loan paydown is wiped out by about $3k of value loss. Plan a longer hold.
- Leon County population projected at +23% by 2050 — long-run rental-demand tailwind backs the buy-and-hold thesis.
- At projected returns (-3.0% appreciation + 4.7% rent growth), your $32k cash investment doubles in ~7 years — after that, you're playing with house money.
Negotiation context
- It's been on market 62 days — a 6% lower offer ($108k) is reasonable based on typical stale-listing flexibility.
- 3 sale attempts since 5y ago; this cycle's ask has dropped $10k (8%) from the opening price — seller is motivated, your offer sets the floor, not the list.
- Current owner paid $58k; list at $115k implies a 99% gain — meaningful room to come down on a strong offer.
Risks & watch-outs
- Watch-outs: built in 1928 — expect roof / HVAC / electrical / plumbing capex.
- Climate carrying-cost: severe wind risk, 99% chance of damaging wind over 30y; extreme-heat days projected 7→20/yr by 2055 (HVAC capex compounding) — expect insurance premiums to compound above CPI over the hold.
Questions for the listing agent
- It's been on market 62 days. Have you received any prior offers? Is the seller open to a 6% concession, seller financing, or rate buy-down credit?
- Have any recent inspections been done? Can we get a copy of the seller's disclosures and any deferred-maintenance estimates?
- Built in 1928 — when were the roof, HVAC, electrical panel, plumbing, and water heater last replaced?
- Why hasn't it sold? Are there any deal-killer items the seller is aware of (foundation, flood, title, zoning, code violations)?
- Is there a deadline driving the sale (1031 exchange, divorce, estate, relocation)? That informs how much negotiation room exists.
- Schools are B-rated — typically a magnet for longer-tenancy family renters. What's the average tenant stay here, and is there a school-zone premium baked into asking?
- What's the average days-on-market for RENTAL listings here right now (not sales)? A rising rental-DOM trend means longer vacancies and softer asking-rent achievability than the comps imply.
- What's the recent tenant-quality profile in this submarket — average credit score on applications, eviction rate, late-payment / NSF rate, and stable-employment percentage? A property-management company in the area should have these aggregated.
- How much new for-sale + rental construction is in the pipeline within 1–3 miles? Heavy new supply typically softens prices + rents 12–24 months out; constrained supply supports both.
Investment metrics
- 1% rule
- 1.30% ✓
- Cap rate
- 10.52%
- Cash-on-cash
- 15.09%
- DSCR
- 1.67
- GRM
- 6.4
CMA / ARV
- ARV (on-the-fly)
- $148,716
- Comps found
- 12
Show comp detail 12 sales within ~0.75 mi
| Address | Dist | Beds/Ba | Sqft | Sold | Price | $/sf | Match |
|---|---|---|---|---|---|---|---|
| 808 Goodbread Ln | 0.34mi | 3/2.0 | 994 (+2%) | 6mo | $117,000 | $118 | 72 |
| 1310 N Bronough St | 0.71mi | 3/1.0 | 988 (+2%) | 2mo | $220,000 | $223 | 63 |
| 532 W 4th Ave | 0.37mi | 2/1.0 (-1) | 920 (-5%) | 8mo | $55,000 | $60 | 62 |
| 1053 Delaware St | 0.39mi | 3/2.0 | 1,036 (+7%) | 6mo | $159,000 | $153 | 62 |
| 651 W 8th Ave | 0.50mi | 3/1.0 | 1,054 (+8%) | 6mo | $264,000 | $250 | 58 |
| 643 W 8th Ave | 0.51mi | 3/1.0 | 1,083 (+11%) | 7mo | $75,000 | $69 | 51 |
| 1530 Yancey St | 0.60mi | 3/2.0 | 1,022 (+5%) | 10mo | $118,000 | $115 | 51 |
| 1338 Branch St | 0.52mi | 2/1.0 (-1) | 872 (-10%) | 5mo | $193,200 | $222 | 50 |
| 439 Shephard St | 0.52mi | 3/1.0 | 1,116 (+15%) | 3mo | $225,000 | $202 | 49 |
| 1517 Branch St | 0.66mi | 2/1.0 (-1) | 918 (-6%) | 9mo | $197,500 | $215 | 47 |
| 1107 N M L King Jr Blvd | 0.59mi | 2/2.0 (-1) | 1,074 (+10%) | 4mo | $120,000 | $112 | 43 |
| 1010 Calloway St | 0.67mi | 3/1.0 | 1,112 (+14%) | 8mo | $98,000 | $88 | 38 |
Match score weights: distance 35% · size 25% · config 20% · recency 20%. Top-matched comps best support the ARV.
Projected returns pro-forma
-3.0% appreciation · 4.69% rent growth · sell at horizon
- IRR
- 7.6%
- Equity multiple
- 1.30×
- Total profit
- $9,744
- Equity at exit
- $17,147
- IRR
- 18.3%
- Equity multiple
- 2.64×
- Total profit
- $52,697
- Equity at exit
- $9,943
Cash invested: $32,200 (down + closing). Projections, not guarantees.
Landlord ↔ Tenant lean methodology
- Overall (STATE)
- 87 Strongly Landlord-Friendly
- State Florida
- 87 Strongly Landlord-Friendly · R+3
- County
- — inherits STATE
- City
- — inherits STATE
ZIP-level market 32304
- Home prices YoY
- -21.2%
- Rents YoY
- 4.7%
- Active inventory
- 142
- Price-to-rent
- 6.4×
Monthly cashflow live
- Estimated rent
- $1,493 high interval (Pro) →
- Mortgage (P&I)
- −$603
- Tax from tax record
- −$124 /mo · $1,484/yr
- Insurance
- −$48
- HOA
- −$0
- Vacancy / Maint / Mgmt
- −$314
- Net cashflow
- $405
Break-even live
UW: 25.0% down · 7.5% · 30yr · 1.5% tax · 5.0% vac · 8.0% maint · 8.0% mgmt
Financing live
Cash to close
- Down payment
- $28,750
- Closing costs
- $3,450
- Reserves months
- —
- Total cash needed
- —
Loan-product check · same deal, 3 products live
Conventional
25% down · 7.5% · 30yr
- Down + closing
- —
- Monthly P&I
- —
- Monthly cashflow
- —
- DSCR
- —
- Eligible?
- —
Personal DTI + credit; lowest rate.
DSCR
20% down · 8.5% · 30yr
- Down + closing
- —
- Monthly P&I
- —
- Monthly cashflow
- —
- DSCR
- —
- Eligible?
- —
No personal income docs; deal must DSCR.
Hard money
10% down · 12.0% · 12mo
- Down + closing
- —
- Monthly P&I
- —
- Monthly cashflow
- —
- DSCR
- —
- Eligible?
- —
Short-term bridge; refi at stabilization.
Rent comps 32 comps
| Address | Beds | Baths | Sqft | Rent | $/sqft | DOM | Units | Dist |
|---|---|---|---|---|---|---|---|---|
| 916 N Woodward Ave #1 Tallahassee, FL | 2.0 | 1.0 | 794 | $1,000 | $1.26 | 13d | 1 | 0.20mi |
| 412 W Brevard St Unit 412 Tallahassee, FL | 3.0 | 2.0 | 900 | $800 | $0.89 | 21d | 1 | 0.57mi |
| 718 N Bronough St Tallahassee, FL | 2.0 | 1.0 | 798 | $1,100 | $1.38 | 21d | 1 | 0.64mi |
| 1410 Nylic St Unit B Tallahassee, FL | 2.0 | 1.0 | 550 | $900 | $1.64 | 13d | 1 | 0.65mi |
| 322 Conradi St Tallahassee, FL | 3.0 | 2.0 | 1100 | $1,950 | $1.77 | 21d | 4 | 0.89mi |
| 440 N Monroe St Tallahassee, FL | 3.0 | 1.0–3.0 | 1311 | $3,850 | $2.94 | 13d | 15 | 0.91mi |
| 1325 W Tharpe St Tallahassee, FL | 1.0–3.0 | 1.0–4.0 | 937 | $1,676 | $1.79 | 13d | 21 | 0.97mi |
| 1916 Nannette Dr Unit 1916 Tallahassee, FL | 2.0 | 1.0 | 1000 | $1,100 | $1.10 | 13d | 1 | 0.98mi |
| 1935 Dawsey St Unit 1935-2 Tallahassee, FL | 2.0 | 1.0 | 875 | $975 | $1.11 | 13d | 1 | 1.02mi |
| 215 W College Ave Unit 706B Tallahassee, FL | 2.0 | 1.0 | 823 | $2,600 | $3.16 | 21d | 1 | 1.02mi |
| 1108 Greentree Ct Tallahassee, FL | 2.0 | 2.0 | 888 | $1,275 | $1.44 | 21d | 1 | 1.06mi |
| 415 N Gadsden St Tallahassee, FL | 1.0–2.0 | 1.0–1.5 | 990 | $1,575 | $1.59 | 21d | 6 | 1.09mi |
| 1111 High Rd Tallahassee, FL | 2.0–3.0 | 2.0 | 1000 | $1,594 | $1.59 | 13d | 11 | 1.11mi |
| 833 W Gaines St Tallahassee, FL | 2.0 | 2.0 | 1080 | $2,350 | $2.18 | 13d | 2 | 1.16mi |
| 2020 Continental Ave Tallahassee, FL | 1.0–2.0 | 1.0–1.5 | 850 | $1,300 | $1.53 | 21d | 3 | 1.19mi |
| 1001 Ocala Rd Tallahassee, FL | 4.0 | 1.0–2.0 | 899 | $642 | $0.71 | 21d | 6 | 1.21mi |
| 424 E 7th Ave Unit 15 Tallahassee, FL | 2.0 | 1.0 | 859 | $1,550 | $1.80 | 13d | 1 | 1.22mi |
| 420 E Park Ave Unit 50 Tallahassee, FL | 2.0 | 1.0 | 770 | $1,050 | $1.36 | 13d | 1 | 1.23mi |
| 1332 Cherry St Tallahassee, FL | 2.0 | 1.0 | 859 | $1,550 | $1.80 | 21d | 1 | 1.24mi |
| 1330 Cherry St Tallahassee, FL | 2.0 | 1.0 | 859 | $1,600 | $1.86 | 13d | 5 | 1.24mi |
| 1338 Cherry St Unit 5 Tallahassee, FL | 2.0 | 1.0 | 859 | $1,550 | $1.80 | 13d | 1 | 1.25mi |
| 1340 Cherry St Unit 6 Tallahassee, FL | 2.0 | 1.0 | 859 | $1,649 | $1.92 | 21d | 1 | 1.25mi |
| 717 Edgewood St Tallahassee, FL | 2.0 | 1.0 | 717 | $1,325 | $1.85 | 21d | 1 | 1.26mi |
| 220 Atkinson Dr Unit D Tallahassee, FL | 2.0 | 1.0 | 928 | $1,100 | $1.19 | 21d | 1 | 1.32mi |
| 2060 Continental Ave Tallahassee, FL | 1.0–3.0 | 1.0–2.5 | 1121 | $1,185 | $1.06 | 13d | 26 | 1.34mi |
| 1101 Washington Ct #1 Tallahassee, FL | 2.0 | 1.0 | 950 | $1,050 | $1.11 | 13d | 1 | 1.37mi |
| 1303 Ocala Rd Tallahassee, FL | 1.0–4.0 | 1.0–2.0 | 1121 | $1,445 | $1.29 | 13d | 48 | 1.40mi |
| 406 Glenview Dr Unit 11 Tallahassee, FL | 2.0 | 1.0 | 896 | $1,100 | $1.23 | 13d | 1 | 1.44mi |
| 1303 Airport Dr Unit A08 Tallahassee, FL | 2.0 | 2.5 | 1083 | $1,475 | $1.36 | 21d | 1 | 1.44mi |
| 1854 Belle Vue Way Tallahassee, FL | 2.0–4.0 | 1.0–2.0 | 1100 | $1,768 | $1.61 | 21d | 1 | 1.45mi |
| 1360 Ocala Rd Tallahassee, FL | 2.0 | 1.0 | 800 | $1,000 | $1.25 | 21d | 1 | 1.48mi |
| 1643 Fernando Dr #2 Tallahassee, FL | 2.0 | 2.0 | 1000 | $1,650 | $1.65 | 21d | 1 | 1.48mi |
Listing history 21 events
-
2026-06-18statusdays on market $115,000 Active 62 DOM
-
2026-06-17days on market $115,000 Active Under Contract 61 DOM
-
2026-06-16days on market $115,000 Active Under Contract 60 DOM
-
2026-06-15days on market $115,000 Active Under Contract 59 DOM
-
2026-06-14days on market $115,000 Active Under Contract 57 DOM
-
2026-06-10days on market $115,000 Active Under Contract 54 DOM
-
2026-06-09days on market $115,000 Active Under Contract 53 DOM
-
2026-06-08days on market $115,000 Active Under Contract 52 DOM
-
2026-06-07days on market $115,000 Active Under Contract 51 DOM
-
2026-06-05days on market $115,000 Active Under Contract 48 DOM
-
2026-06-03days on market $115,000 Active Under Contract 47 DOM
-
2026-06-02days on market $115,000 Active Under Contract 46 DOM
-
2026-06-01days on market $115,000 Active Under Contract 45 DOM
-
2026-05-31days on market $115,000 Active Under Contract 44 DOM
-
2026-05-30days on market $115,000 Active Under Contract 43 DOM
-
2026-05-14historical Active Under Contract
-
2026-05-03price $115,000
-
2026-04-17$125,000 Active
-
2021-04-12soldstatus $57,800 Closed 418-char remark
Show marketing remark (418 chars)
Cute 3/1 with split plan, nice sized bedrooms, inside utility room with washer/dryer hook ups, and much more. There is a covered front porch and large mostly fenced yard. Convenient location to downtown, FSU, FAMU, TCC, state offices, restaurants, and shopping! Could rent for $775 in its current shape or up to $850 with a few upgrades. Could also be a great first home! Selling as-is. All dimensions are approximate.
-
2021-04-01Active Under Contract 418-char remark
Show marketing remark (418 chars)
Cute 3/1 with split plan, nice sized bedrooms, inside utility room with washer/dryer hook ups, and much more. There is a covered front porch and large mostly fenced yard. Convenient location to downtown, FSU, FAMU, TCC, state offices, restaurants, and shopping! Could rent for $775 in its current shape or up to $850 with a few upgrades. Could also be a great first home! Selling as-is. All dimensions are approximate.
-
2021-02-10$61,900 418-char remark
Show marketing remark (418 chars)
Cute 3/1 with split plan, nice sized bedrooms, inside utility room with washer/dryer hook ups, and much more. There is a covered front porch and large mostly fenced yard. Convenient location to downtown, FSU, FAMU, TCC, state offices, restaurants, and shopping! Could rent for $775 in its current shape or up to $850 with a few upgrades. Could also be a great first home! Selling as-is. All dimensions are approximate.
ⓘ Source: listings_history table (triggers on properties + properties_extension) + one-shot
backfill from property_details.listing_events for pre-trigger history.
Tax reassessment forecast FL · Resets to sale price
- Current annual tax
- $1,484 · $124/mo
- Projected year-2 tax
- $1,484 · $124/mo
- Expected delta
- $0/yr ($0/mo · 0.0%)
ⓘ Screening estimate from a state-policy table — verify with the county assessor before closing.
Climate risk First Street
- Flood 1/10 Low FEMA zone X (unshaded) · 0% chance over 30 yrs
- Wildfire 1/10 Low
- Heat 8/10 Severe 7 d/yr ≥108°F today · 20 d/yr by 30 yrs out
- Wind 9/10 Extreme 99% chance of damaging wind over 30 yrs
- Air quality 5/10 Major 7 unhealthy d/yr today · 7 by 30 yrs out
Nearby sold comps map
Loading sold comps map…
Walkable amenities ~0.75 mi
Loading nearby amenities…
Taxation est. · year 1
- Rental income
- $17,917
- − Mortgage interest
- −$6,442
- − Property taxes
- −$1,484
- − Insurance
- −$575
- − Repairs & maintenance
- −$1,433
- − Management
- −$1,433
- − Depreciation
- −$3,345
- Taxable income
- $3,204
- Est. tax owed @ 24.0%
- −$769
- After-tax cash flow
- $4,090/yr
For passive investors: Depreciation is non-cash, so a rental often shows a tax loss while cash-flowing — sheltering income. Rental losses are passive: they offset passive income freely, and up to $25,000/yr can offset ordinary (W-2) income if you actively participate and your MAGI is under $100k (phasing out to $0 by $150k); unused losses carry forward. On sale, claimed depreciation is recaptured at up to 25%, and gains may owe capital-gains tax (a 1031 exchange can defer both). Figures are a year-1 estimate at your 24.0% rate — not tax advice; consult a CPA.
Condition & rehab AI · 12 photos
This home requires moderate repairs to its exterior and front yard, but has a good roof and interior systems. Painting and updating the front porch can significantly increase its value.
Repairs flagged
- Major Exterior siding — Significant wear and tear
- Major Exterior wood — Exposed and deteriorating
- Major Debris removal — Large debris pile in front yard
Value-add opportunities
- Resale Paint exterior — Enhances curb appeal
- Rental Replace front porch railings — Improves safety and aesthetics
Renovation cost estimate screening
| Repair item | Severity | Est. cost |
|---|---|---|
| Exterior siding · Significant wear and tear | Major | $15,000–50,000 |
| Exterior wood · Exposed and deteriorating | Major | $15,000–50,000 |
| Debris removal · Large debris pile in front yard | Major | $15,000–50,000 |
| Total estimated repair cost · 3 items | $45,000–150,000 |
Value-add ROI direction
- Resale Paint exterior — Enhances curb appeal ↑
- Rental Replace front porch railings — Improves safety and aesthetics ↑
ⓘ Cost ranges are severity-bucket heuristics (US national rule-of-thumb). Get contractor quotes + a written scope before underwriting a rehab budget.
Schools (NCES district)
- District
- Leon
- NCES district ID
- 1201110
- Math proficiency
- 48% ▼ -13.00%
- Reading proficiency
- 53% ▼ -5.00%
- Median HH income
- $46,339
- Composite
- 42.84/100
- National rank
- #3131
- State rank
- #33 of 73 in FL
Livability — Tallahassee
- Score
- 86/100
- State rank
- #19
- US rank
- #429
Category grades
Schools grade is shown separately in the Schools card above.
Census & demographics
- Census place
- Tallahassee, FL
- County
- Leon County · 294,472 people
- City population
- 294,472
- Metro
- Tallahassee, FL
- Population (ZIP)
- 51,673
- Household income
- $32,348
- Rent vs Own
- Severe rent burden
- 6995.0
Population outlook (Leon County) Hauer SSP2
- Today (2025)
- 315,507 people
- By 2030
- 330,677 · +4.8%
- By 2040
- 358,465 · +13.6%
- By 2050
- 386,804 · +22.6%
- By 2075
- 465,480 · +47.5%
- By 2100
- 519,959 · +64.8%
Race, ethnicity, and origin ACS 2023
- Neighborhood character
- Diverse neighborhood (Simpson 0.65)
- Race & ethnicity
- White 45% Black 36% Hispanic / Latino 10% Two or more races 7% Asian 4%
- Hispanic origin (detail)
- Mexican 2% Puerto Rican 2% Cuban 2%
- Common ancestry
- Romanian 2% Lithuanian 1% Italian 1%
- Foreign-born
- 8% · Canada, China
- Languages at home
- 86% English-only · Spanish 7% Other Indo-European 2% French/Haitian/Cajun 1%
Political lean MEDSL · Leon
- 2024 margin
- Strong D (+21.8) · D 60.3% · R 38.5% · Other 1.2%
- 2008→2024 swing
- -2.5pp toward R · 2008: 24.3pp · 2024: 21.8pp
- All cycles
- 2024: D+21.8 2020: D+28.3 2016: D+25.1 2012: D+23.6 2008: D+24.3
Not yet ingested
- Civics
- —
Market trends
- HPI YoY
- ▼ -72.04%
- Current HPI
- 267.8426
- Rent YoY
- ▲ 4.69%
- Metro
- Tallahassee, FL
- State GDP YoY
- ▲ 3.28%
- F500 in state
- 36
Industry mix (Fortune 500 HQ in FL)
| Industry | F500 HQs | Revenue |
|---|---|---|
| Industrial Technology | 2 | $29B |
|
||
| Insurance | 2 | $17B |
|
||
| Retail | 1 | $60B |
|
||
| Technology Distribution | 1 | $58B |
|
||
| Homebuilding | 1 | $35B |
|
||
| Technology Manufacturing | 1 | $35B |
|
||
Price history
+85.8% since first listed6 events — show timeline
- 2026-05-14 Contingent — CATRS
- 2026-05-03 Price Changed $115,000 CATRS
- 2026-04-17 Listed $125,000 CATRS
- 2021-04-12 Sold (MLS) $57,800 CATRS
- 2021-04-01 Listed — CATRS
- 2021-02-10 Listed $61,900 CATRS
Property tax history
+11.8%/yrLatest (2025): $1,484 · +10.0% YoY. Source: county tax records.
Cash-flow waterfall
monthlySold comps — $/sqft
last 12 mo · ≤1 miLoading sold comps…