 🏷️ Likely Rental
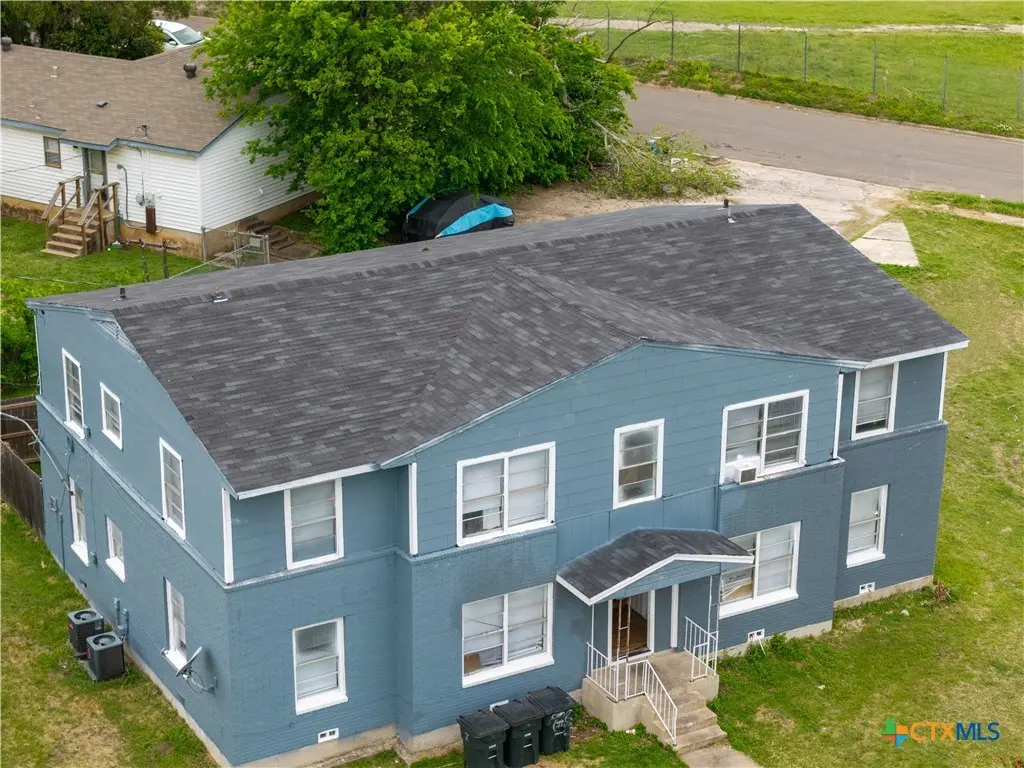
908 Sissom Rd · Killeen, TX
Flood risk 1/10 · Minimal
- FEMA flood zone
- X (unshaded)
- Chance of flooding over 30 yrs
- 0.0%
- Est. flood insurance / yr
- $507 – $1,088
Fire risk 4/10 · Minor
- Est. fire insurance / yr
- $1,222 – $2,270
Heat risk 8/10 · Major
- Hot days now (above 107°F)
- 7 days/yr
- Hot days in 30 yrs
- 24 days/yr
Wind risk 6/10 · Moderate
- Chance of severe wind over 30 yrs
- 54.0%
Air-quality risk 1/10 · Minimal
- Unhealthy air days now
- 0 days/yr
- Unhealthy air days in 30 yrs
- 0 days/yr
Risk factors via First Street. Map © Google.
Why this score? — see what drove the D grade
The composite is a weighted blend of 9 inputs, each scored 0–100. Each bar is that input's sub-score; the figure is the points it added to the 100-point composite (weight × sub-score).
- ARV discount +15.0/15.0
- Cash flow +6.1/30.0
- Appreciation +6.1/10.0
- Livability +3.2/5.0
- Schools +3.0/10.0
- 1% rule +2.7/10.0
- Condition / age +2.5/5.0
- Rent growth +2.0/5.0
- DSCR +0.4/10.0
$197,170
🖨 Deal sheet 📄 Offer letter ✓ Due diligence
Listing remarks MLS
Investment Opportunity – 12 Units/ Doors in Killeen, TX | Priced Below Market for Quick Sale!!Don’t miss this rare chance to acquire a cash-flowing 12-unit multifamily package in a strong rental market in Killeen, Texas. This portfolio includes : 6-Plex – 1016 N 12th Street , 4-Plex - 908 Sissom Road, and a Duplex- 405 W. Avenue E. Current Gross Monthly Rent: $7,580. Package deal pricing is at $599k for all 12 doors. All three properties are located in the same neighborhood, making management efficient and streamlined. Value-Add Opportunity: Rents are currently below market, offering immediate upside potential for increased cash flow. Instant Income: Fully operating rental portfolio with consistent tenants. Strong Upside: Raise rents to market rates and significantly boost returns. Motivated Seller: Priced aggressively for a quick sale. New Roof and New Window Units in 2024.Whether you’re a seasoned investor looking to expand your portfolio or a buyer seeking a high-potential multifamily asset, this package offers cash flow + appreciation upside from day one.
Key facts
- Built 1953
- Listed 72 days
Neighborhood map
What this means for you Summary
Snapshot
- This is a 8-bed/1.0-bath townhouse listed at $197k.
Deal economics
- At list price, monthly cash flow is $-371 ($-4k/yr) — negative.
- To cash-flow at today's rent, offer at most $132k (33.2% below list).
- To meet the 1% rule (rent ≥ 1% of price), the offer needs to be $152k (22.9% below list).
- Recommended offer: $132k (33.2% below list) — sets the bar for cash-flow.
Location & tenants
- Location reads 63/100 on livability (#853 in TX) — a middle-class / working-renter tenant base. Strengths: cost of living A+, housing A+; Watch: schools D+, amenities D, employment D.
- Killeen ISD (urban): math 31% / reading 38% proficiency, ranked #524 of 826 in TX (top 63%) — families likely to look elsewhere, expect single-tenant / working-renter base with shorter leases.
- Market conditions: Rents soft (-2.0%/yr); 123 active listings in the ZIP; lower-income renter base — watch delinquency; 3,222 units permitted in Bell County in 2024 (246 in 5+ unit buildings).
- At $1,519/mo this rent would consume 49% of the median local household income ($37k/yr) (locally 1668% of renters already pay >50% of income on rent) — very limited rent-growth headroom before tenants either downsize or default.
Forward outlook
- In year one you build about $6k of equity ($1k loan paydown + $4k appreciation (2.3% local appreciation)).
- Bell County population projected at +21% by 2050 — long-run rental-demand tailwind backs the buy-and-hold thesis.
- By year 6, paydown + projected appreciation supports a ~$31k cash-out refi (75% LTV) — recoverable capital for the next deal without selling this one.
Negotiation context
- It's been on market 72 days — a 6% lower offer ($185k) is reasonable based on typical stale-listing flexibility.
- 7 sale attempts since 20y ago with the ask held roughly flat each time — persistent listings suggest the price (not the market) is what's stuck; bring a comps-based counter.
- Current owner paid $123k; list at $197k implies a 60% gain — meaningful room to come down on a strong offer.
Risks & watch-outs
- Watch-outs: property tax is 2.8% of price; built in 1953 — expect roof / HVAC / electrical / plumbing capex.
- Climate carrying-cost: major wind risk, 54% chance of damaging wind over 30y; extreme-heat days projected 7→24/yr by 2055 (HVAC capex compounding) — expect insurance premiums to compound above CPI over the hold.
Questions for the listing agent
- What do current leases actually rent for vs. the listed asking? Can we see a recent rent roll and the last 12 months of T-12 income?
- It's been on market 72 days. Have you received any prior offers? Is the seller open to a 33% concession, seller financing, or rate buy-down credit?
- Built in 1953 — when were the roof, HVAC, electrical panel, plumbing, and water heater last replaced?
- Property tax is high relative to price — has the assessment been appealed recently, and will the sale trigger a re-assessment?
- Why hasn't it sold? Are there any deal-killer items the seller is aware of (foundation, flood, title, zoning, code violations)?
- Is there a deadline driving the sale (1031 exchange, divorce, estate, relocation)? That informs how much negotiation room exists.
- Schools are D-rated, which usually means shorter tenancies and higher turnover. Who's the typical renter profile here, and what's been the actual vacancy rate?
- Crime grade is D in this area — have there been break-ins, vandalism, or insurance claims at this property in the last 3 years? What carrier currently insures it and at what premium?
- The area grade is low — what's the realistic commute time and amenity access for the typical tenant pool here? Any planned neighborhood developments (good or bad) we should know about?
- What's the average days-on-market for RENTAL listings here right now (not sales)? A rising rental-DOM trend means longer vacancies and softer asking-rent achievability than the comps imply.
- What's the recent tenant-quality profile in this submarket — average credit score on applications, eviction rate, late-payment / NSF rate, and stable-employment percentage? A property-management company in the area should have these aggregated.
- How much new for-sale + rental construction is in the pipeline within 1–3 miles? Heavy new supply typically softens prices + rents 12–24 months out; constrained supply supports both.
Investment metrics
- 1% rule
- 0.77% ✗
- Cap rate
- 4.04%
- Cash-on-cash
- -8.06%
- DSCR
- 0.64
- GRM
- 10.8
CMA / ARV
- ARV (median comp)
- $278,503
- List price
- $197,170
- Delta
- -29.20%
- Verdict
- UNDERPRICED
- Comps
- 1 within 2.0 mi
Show comp detail 1 sale within ~0.75 mi
| Address | Dist | Beds/Ba | Sqft | Sold | Price | $/sf | Match |
|---|---|---|---|---|---|---|---|
| 907 Sissom Rd | 0.04mi | 8/4.0 | 3,654 (+6%) | 7mo | $290,000 | $79 | 71 |
Match score weights: distance 35% · size 25% · config 20% · recency 20%. Top-matched comps best support the ARV.
Projected returns pro-forma
2.26% appreciation · 0.0% rent growth · sell at horizon
- IRR
- -3.9%
- Equity multiple
- 0.79×
- Total profit
- $-11,773
- Equity at exit
- $80,572
- IRR
- -0.5%
- Equity multiple
- 0.93×
- Total profit
- $-4,053
- Equity at exit
- $118,218
Cash invested: $55,208 (down + closing). Projections, not guarantees.
Landlord ↔ Tenant lean methodology
- Overall (STATE)
- 87 Strongly Landlord-Friendly
- State Texas
- 87 Strongly Landlord-Friendly · R+5
- County
- — inherits STATE
- City
- — inherits STATE
ZIP-level market 76541
- Home prices YoY
- 1.4%
- Rents YoY
- -2.0%
- Active inventory
- 123
- Price-to-rent
- 10.8×
Monthly cashflow live
- Estimated rent
- $1,519 medium interval (Pro) →
- Mortgage (P&I)
- −$1,034
- Tax from tax record
- −$455 /mo · $5,460/yr
- Insurance
- −$82
- HOA
- −$0
- Vacancy / Maint / Mgmt
- −$319
- Net cashflow
- $-371
Break-even live
UW: 25.0% down · 7.5% · 30yr · 1.5% tax · 5.0% vac · 8.0% maint · 8.0% mgmt
Financing live
Cash to close
- Down payment
- $49,292
- Closing costs
- $5,915
- Reserves months
- —
- Total cash needed
- —
Loan-product check · same deal, 3 products live
Conventional
25% down · 7.5% · 30yr
- Down + closing
- —
- Monthly P&I
- —
- Monthly cashflow
- —
- DSCR
- —
- Eligible?
- —
Personal DTI + credit; lowest rate.
DSCR
20% down · 8.5% · 30yr
- Down + closing
- —
- Monthly P&I
- —
- Monthly cashflow
- —
- DSCR
- —
- Eligible?
- —
No personal income docs; deal must DSCR.
Hard money
10% down · 12.0% · 12mo
- Down + closing
- —
- Monthly P&I
- —
- Monthly cashflow
- —
- DSCR
- —
- Eligible?
- —
Short-term bridge; refi at stabilization.
Listing history 34 events
-
2026-06-18days on market $197,170 Active 72 DOM
-
2026-06-17days on market $197,170 Active 71 DOM
-
2026-06-16days on market $197,170 Active 70 DOM
-
2026-06-15days on market $197,170 Active 69 DOM
-
2026-06-14days on market $197,170 Active 67 DOM
-
2026-06-13days on market $197,170 Active 66 DOM
-
2026-06-10days on market $197,170 Active 64 DOM
-
2026-06-09days on market $197,170 Active 63 DOM
-
2026-06-08days on market $197,170 Active 62 DOM
-
2026-06-07days on market $197,170 Active 61 DOM
-
2026-06-03days on market $197,170 Active 57 DOM
-
2026-06-02days on market $197,170 Active 56 DOM
-
2026-06-01days on market $197,170 Active 55 DOM
-
2026-05-31days on market $197,170 Active 54 DOM
-
2026-05-30days on market $197,170 Active 53 DOM
-
2026-04-07$199,670 Active 1101-char remark
Show marketing remark (1101 chars)
Investment Opportunity – 12 Units/ Doors in Killeen, TX | Priced Below Market for Quick Sale!!Don’t miss this rare chance to acquire a cash-flowing 12-unit multifamily package in a strong rental market in Killeen, Texas. This portfolio includes : 6-Plex – 1016 N 12th Street , 4-Plex - 908 Sissom Road, and a Duplex- 405 W. Avenue E. Current Gross Monthly Rent: $7,580. Package deal pricing is at $599k for all 12 doors. All three properties are located in the same neighborhood, making management efficient and streamlined. Value-Add Opportunity: Rents are currently below market, offering immediate upside potential for increased cash flow. Instant Income: Fully operating rental portfolio with consistent tenants. Strong Upside: Raise rents to market rates and significantly boost returns. Motivated Seller: Priced aggressively for a quick sale. New Roof and New Window Units in 2024.Whether you’re a seasoned investor looking to expand your portfolio or a buyer seeking a high-potential multifamily asset, this package offers cash flow + appreciation upside from day one.
-
2021-03-11soldstatus
-
2018-08-24soldstatus
-
2017-10-13historical
-
2017-10-11price $45,000
-
2017-10-10price $44,500
-
2017-10-05$40,000 Active
-
2015-04-10historical
-
2014-11-14$59,900
-
2014-07-04historical
-
2014-07-04$65,000
-
2010-03-17$39,900
-
2009-08-18historical
-
2008-09-25$123,000
-
2006-09-26soldstatus $123,000
-
2006-09-22soldstatus
-
2006-01-06$123,000
-
2004-05-25soldstatus
-
1970-03-03soldstatus
ⓘ Source: listings_history table (triggers on properties + properties_extension) + one-shot
backfill from property_details.listing_events for pre-trigger history.
Tax reassessment forecast TX · Resets to sale price
- Current annual tax
- $5,460 · $455/mo
- Projected year-2 tax
- $5,460 · $455/mo
- Expected delta
- $0/yr ($0/mo · 0.0%)
ⓘ Screening estimate from a state-policy table — verify with the county assessor before closing.
Climate risk First Street
- Flood 1/10 Low FEMA zone X (unshaded) · 0% chance over 30 yrs
- Wildfire 4/10 Moderate
- Heat 8/10 Severe 7 d/yr ≥107°F today · 24 d/yr by 30 yrs out
- Wind 6/10 Major 54% chance of damaging wind over 30 yrs
- Air quality 1/10 Low 0 unhealthy d/yr today · 0 by 30 yrs out
Nearby sold comps map
Loading sold comps map…
Walkable amenities ~0.75 mi
Loading nearby amenities…
Taxation est. · year 1
- Rental income
- $18,232
- − Mortgage interest
- −$11,045
- − Property taxes
- −$5,460
- − Insurance
- −$986
- − Repairs & maintenance
- −$1,459
- − Management
- −$1,459
- − Depreciation
- −$5,736
- Taxable loss
- −$7,912
- Est. tax savings @ 24.0%
- +$1,899
- After-tax cash flow
- $-2,552/yr
For passive investors: Depreciation is non-cash, so a rental often shows a tax loss while cash-flowing — sheltering income. Rental losses are passive: they offset passive income freely, and up to $25,000/yr can offset ordinary (W-2) income if you actively participate and your MAGI is under $100k (phasing out to $0 by $150k); unused losses carry forward. On sale, claimed depreciation is recaptured at up to 25%, and gains may owe capital-gains tax (a 1031 exchange can defer both). Figures are a year-1 estimate at your 24.0% rate — not tax advice; consult a CPA.
Schools (NCES district)
- District
- Killeen ISD
- NCES district ID
- 4825660
- Math proficiency
- 31% ▼ -16.00%
- Reading proficiency
- 38% ▼ -3.00%
- Median HH income
- $47,665
- Composite
- 29.69/100
- National rank
- #6458
- State rank
- #524 of 826 in TX
Livability — Killeen
- Score
- 63/100
- State rank
- #853
- US rank
- #15359
Category grades
Schools grade is shown separately in the Schools card above.
Census & demographics
- Census place
- Killeen, TX
- County
- Bell County · 345,090 people
- City population
- 163,398
- Metro
- Killeen-Temple, TX
- Population (ZIP)
- 19,011
- Household income
- $37,349
- Rent vs Own
- Severe rent burden
- 1668.0
Population outlook (Bell County) Hauer SSP2
- Today (2025)
- 371,114 people
- By 2030
- 389,104 · +4.8%
- By 2040
- 420,592 · +13.3%
- By 2050
- 447,779 · +20.7%
- By 2075
- 499,130 · +34.5%
- By 2100
- 505,680 · +36.3%
Race, ethnicity, and origin ACS 2023
- Neighborhood character
- Highly diverse neighborhood (Simpson 0.73)
- Race & ethnicity
- Hispanic / Latino 32% White 31% Black 27% Two or more races 10% Asian 3% Pacific Islander 1%
- Hispanic origin (detail)
- Mexican 21% Puerto Rican 6% Dominican 1%
- Common ancestry
- Italian 2% Slovak 1% Lithuanian 1%
- Foreign-born
- 14% · Canada, Vietnam, South Korea
- Languages at home
- 69% English-only · Spanish 25% German/W. Germanic 2% Korean 1%
Political lean MEDSL · Bell
- 2024 margin
- R (+16.2) · D 41.3% · R 57.6% · Other 1.1%
- 2008→2024 swing
- -6.5pp toward R · 2008: -9.8pp · 2024: -16.2pp
- All cycles
- 2024: R+16.2 2020: R+8.5 2016: R+15.1 2012: R+16.4 2008: R+9.8
Not yet ingested
- Civics
- —
Market trends
- HPI YoY
- ▲ 2.26%
- Current HPI
- 168.1206
- Rent YoY
- ▼ -2.00%
- Metro
- Killeen-Temple, TX
- State GDP YoY
- ▲ 3.95%
- F500 in state
- 110
Industry mix (Fortune 500 HQ in TX)
| Industry | F500 HQs | Revenue |
|---|---|---|
| Energy | 16 | $1,198B |
|
||
| Technology | 5 | $198B |
|
||
| Engineering / Construction | 4 | $72B |
|
||
| Energy Services | 3 | $60B |
|
||
| Utilities | 3 | $41B |
|
||
| Healthcare | 2 | $330B |
|
||
Price history
+62.3% since first listed19 events — show timeline
- 2026-04-07 Listed $199,670 CTXMLS
- 2021-03-11 Sold (Public Records) — Public Records
- 2018-08-24 Sold (Public Records) — Public Records
- 2017-10-13 Listing Removed — CTXMLS
- 2017-10-11 Price Changed $45,000 CTXMLS
- 2017-10-10 Price Changed $44,500 CTXMLS
- 2017-10-05 Listed $40,000 CTXMLS
- 2015-04-10 Listing Removed — CTXMLS
- 2014-11-14 Listed $59,900 CTXMLS
- 2014-07-04 Listed $65,000 CTXMLS
- 2014-07-04 Listing Removed — CTXMLS
- 2010-03-17 Listed $39,900 CTXMLS
- 2009-08-18 Listing Removed — CTXMLS
- 2008-09-25 Listed $123,000 CTXMLS
- 2006-09-26 Sold (MLS) $123,000 CTXMLS
- 2006-09-22 Sold (Public Records) — Public Records
- 2006-01-06 Listed $123,000 CTXMLS
- 2004-05-25 Sold (Public Records) — Public Records
- 1970-03-03 Sold (Public Records) — Public Records
Property tax history
+18.2%/yrLatest (2025): $5,460 · +22.2% YoY. Source: county tax records.
Cash-flow waterfall
monthlySold comps — $/sqft
last 12 mo · ≤1 miLoading sold comps…