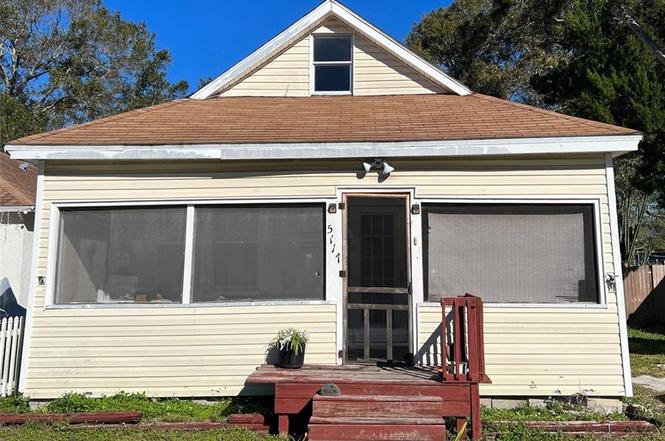
5117 16th Ave · Gulfport, FL
Flood risk 1/10 · Minimal
- FEMA flood zone
- X (unshaded)
- Chance of flooding over 30 yrs
- 0.0%
- Est. flood insurance / yr
- $507 – $1,088
Fire risk 1/10 · Minimal
- Est. fire insurance / yr
- $947 – $1,759
Heat risk 10/10 · Severe
- Hot days now (above 106°F)
- 7 days/yr
- Hot days in 30 yrs
- 26 days/yr
Wind risk 10/10 · Severe
- Chance of severe wind over 30 yrs
- 99.0%
Air-quality risk 4/10 · Minor
- Unhealthy air days now
- 4 days/yr
- Unhealthy air days in 30 yrs
- 4 days/yr
Risk factors via First Street. Map © Google.
Why this score? — see what drove the D- grade
The composite is a weighted blend of 9 inputs, each scored 0–100. Each bar is that input's sub-score; the figure is the points it added to the 100-point composite (weight × sub-score).
- Cash flow +11.8/30.0
- ARV discount +4.7/15.0
- Schools +4.3/10.0
- Livability +4.0/5.0
- 1% rule +3.9/10.0
- DSCR +3.5/10.0
- Condition / age +2.5/5.0
- Rent growth +2.3/5.0
- Appreciation +0.0/10.0
$259,707
🖨 Deal sheet (PDF) 📄 Offer letter ✓ Due diligence
Listing remarks
Under contract-accepting backup offers. Welcome to 5117 16TH AVENUE in Gulfport, Florida! This 3 bedroom, 1.5 bathroom home. This home is a great opportunity for someone who is looking to be clsoer to the beach. About 10min away from the beach and amazing restaurants and entertainment, this house is perfect for those looking to be in a great neighborhood with endless opportunities. This 3 bedroom 1.5 bath home has been recently renovated. stainless steel appliances, wood laminated throughout the entire home. Granite countertops, new cabinets makes the look complete. Circular staircase leads to upstairs bedroom with its own private half bath, this home has great potential for the right buyer
Key facts
- Private half bath
- New cabinets
- Recently renovated
Tags
Neighborhood map
What this means for you Summary
Snapshot
- This is a 3-bed/1.5-bath single-family listed at $260k.
Deal economics
- At list price, monthly cash flow is $-71 ($-854/yr) — negative.
- To cash-flow at today's rent, offer at most $247k (4.8% below list).
- To meet the 1% rule (rent ≥ 1% of price), the offer needs to be $231k (11.2% below list).
- Recommended offer: $231k (11.2% below list) — sets the bar for 1% rule.
- Cap rate 6.0% vs local median 2.0% in Gulfport — top-decile yield for the area; either an underpriced asset or a hidden risk that comps aren't pricing in. Stress-test before assuming the spread holds.
Location & tenants
- Location reads 79/100 on livability (#151 in FL, #2,285 nationally) — a middle-class / working-renter tenant base. Strengths: commute A+, housing A+, health & safety A+; Watch: crime C-, amenities D.
- Pinellas (suburban): math 51% / reading 51% proficiency, ranked #31 of 73 in FL (top 42%) — acceptable for families but not a draw, mixed tenant base, ~2y average lease.
- Zoned schools: Gulfport Montessori Elementary School (math 35% / reading 33%, grade F, #1,744 of 2,144 statewide, top 82%, 435 students, 86% FRL); Azalea Middle School (math 26% / reading 27%, grade F, #503 of 571 statewide, top 88%, 678 students, 74% FRL); Boca Ciega High School (math 24% / reading 33%, grade F, #458 of 667 statewide, top 69%, 1,423 students, 64% FRL) — zoned schools average 74% FRL vs 48% district-wide (26 pts higher); higher-poverty schools than district average — tighter screening recommended.
- Zoned-school proficiency averages 30% at this address vs 51% district-wide (-21 pts) — the specific schools serving this property underperform the Pinellas average; the district grade overstates school quality for this exact location.
- Market conditions: Rents soft (-0.6%/yr); 462 active listings in the ZIP; 40 comparable units currently listed for rent nearby; rentals leasing fast (median 10d on market — plan ~1-2 weeks tenant-placement turnaround); 2,676 units permitted in Pinellas County in 2024 (1,422 in 5+ unit buildings).
Forward outlook
- Local home prices are declining (-3.0%/yr); year-one equity from $2k of loan paydown is wiped out by about $8k of value loss. Plan a longer hold.
- Pinellas County population projected at +14% by 2050 — modest demand growth; plan on rents tracking national, not racing it.
Negotiation context
- It's been on market 113 days — a 9% lower offer ($236k) is reasonable based on typical stale-listing flexibility.
- 14 sale attempts since 22y ago; this cycle's ask has dropped $35k (12%) from the opening price — seller is motivated, your offer sets the floor, not the list.
- Current owner paid $188k; 38% above their basis — modest negotiation headroom, anchor on the comps not their cost.
Risks & watch-outs
- Watch-outs: built in 1925 — expect roof / HVAC / electrical / plumbing capex.
- Climate carrying-cost: severe wind risk, 99% chance of damaging wind over 30y; extreme-heat days projected 7→26/yr by 2055 (HVAC capex compounding) — expect insurance premiums to compound above CPI over the hold.
Questions for the listing agent
- What do current leases actually rent for vs. the listed asking? Can we see a recent rent roll and the last 12 months of T-12 income?
- It's been on market 113 days. Have you received any prior offers? Is the seller open to a 11% concession, seller financing, or rate buy-down credit?
- Built in 1925 — when were the roof, HVAC, electrical panel, plumbing, and water heater last replaced?
- Why hasn't it sold? Are there any deal-killer items the seller is aware of (foundation, flood, title, zoning, code violations)?
- Is there a deadline driving the sale (1031 exchange, divorce, estate, relocation)? That informs how much negotiation room exists.
- Schools are D-rated, which usually means shorter tenancies and higher turnover. Who's the typical renter profile here, and what's been the actual vacancy rate?
- The area grade is low — what's the realistic commute time and amenity access for the typical tenant pool here? Any planned neighborhood developments (good or bad) we should know about?
- What's the average days-on-market for RENTAL listings here right now (not sales)? A rising rental-DOM trend means longer vacancies and softer asking-rent achievability than the comps imply.
- What's the recent tenant-quality profile in this submarket — average credit score on applications, eviction rate, late-payment / NSF rate, and stable-employment percentage? A property-management company in the area should have these aggregated.
- How much new for-sale + rental construction is in the pipeline within 1–3 miles? Heavy new supply typically softens prices + rents 12–24 months out; constrained supply supports both.
Investment metrics
- 1% rule
- 0.89% ✗
- Cap rate
- 5.96%
- Cash-on-cash
- -1.17%
- DSCR
- 0.95
- GRM
- 9.4
CMA / ARV
- ARV (on-the-fly)
- $244,400
- Comps found
- 12
Show comp detail 12 sales within ~0.75 mi
| Address | Dist | Beds/Ba | Sqft | Sold | Price | $/sf | Match |
|---|---|---|---|---|---|---|---|
| 4941 Newton Ave S | 0.13mi | 3/1.0 | 720 (-4%) | 1mo | $160,000 | $222 | 84 |
| 5009 12th Ave S | 0.25mi | 3/1.0 | 804 (+7%) | 5mo | $319,000 | $397 | 70 |
| 4371 18th Ave S | 0.64mi | 2/1.0 (-1) | 752 (0%) | 6mo | $282,000 | $375 | 58 |
| 5145 Preston Ave S | 0.07mi | 2/1.0 (-1) | 861 (+14%) | 9mo | $265,000 | $308 | 58 |
| 4601 21st Ave S | 0.57mi | 2/1.0 (-1) | 780 (+4%) | 4mo | $237,000 | $304 | 57 |
| 1119 51st St S | 0.25mi | 2/1.0 (-1) | 848 (+13%) | 7mo | $215,000 | $254 | 54 |
| 5130 Pine Grove Ter S | 0.18mi | 2/1.0 (-1) | 654 (-13%) | 11mo | $297,000 | $454 | 54 |
| 5410 19th Ave S | 0.40mi | 2/1.0 (-1) | 810 (+8%) | 9mo | $275,000 | $340 | 54 |
| 4727 6th Ave S | 0.73mi | 2/1.5 (-1) | 792 (+5%) | 4mo | $229,000 | $289 | 49 |
| 4727 17th Ave S | 0.27mi | 2/1.0 (-1) | 861 (+14%) | 10mo | $280,000 | $325 | 48 |
| 5314 6th Ave S | 0.71mi | 2/1.0 (-1) | 696 (-7%) | 1mo | $259,000 | $372 | 46 |
| 4627 19th Ave S | 0.47mi | 2/1.0 (-1) | 648 (-14%) | 5mo | $125,000 | $193 | 44 |
Match score weights: distance 35% · size 25% · config 20% · recency 20%. Top-matched comps best support the ARV.
Projected returns pro-forma
-3.0% appreciation · 0.0% rent growth · sell at horizon
- IRR
- -21.8%
- Equity multiple
- 0.27×
- Total profit
- $-53,280
- Equity at exit
- $38,723
- IRR
- -25.9%
- Equity multiple
- -0.07×
- Total profit
- $-77,962
- Equity at exit
- $22,455
Cash invested: $72,718 (down + closing). Projections, not guarantees.
Landlord ↔ Tenant lean methodology
- Overall (STATE)
- 87 Strongly Landlord-Friendly
- State Florida
- 87 Strongly Landlord-Friendly · R+3
- County
- — inherits STATE
- City
- — inherits STATE
ZIP-level market 33707
- Rents YoY
- -0.6%
- Active inventory
- 462
- Price-to-rent
- 9.4×
Monthly cashflow live
- Estimated rent
- $2,306 high interval (Pro) →
- Mortgage (P&I)
- −$1,362
- Tax from tax record
- −$423 /mo · $5,071/yr
- Insurance
- −$108
- HOA
- −$0
- Vacancy / Maint / Mgmt
- −$484
- Net cashflow
- $-71
Break-even live
Sensitivity live
| Price | -10% $76 | -5% $2 | +0% $-71 | +5% $-145 | +10% $-218 |
|---|---|---|---|---|---|
| Rent | -10% $-253 | -5% $-162 | +0% $-71 | +5% $20 | +10% $111 |
| Rate | -1.0pp $60 | -0.5pp $-5 | base $-71 | +0.5pp $-138 | +1.0pp $-207 |
UW: 25.0% down · 7.5% · 30yr · 1.5% tax · 5.0% vac · 8.0% maint · 8.0% mgmt
Financing live
Cash to close
- Down payment
- $64,927
- Closing costs
- $7,791
- Reserves months
- —
- Total cash needed
- —
Loan-product check · same deal, 3 products live
Conventional
25% down · 7.5% · 30yr
- Down + closing
- —
- Monthly P&I
- —
- Monthly cashflow
- —
- DSCR
- —
- Eligible?
- —
Personal DTI + credit; lowest rate.
DSCR
20% down · 8.5% · 30yr
- Down + closing
- —
- Monthly P&I
- —
- Monthly cashflow
- —
- DSCR
- —
- Eligible?
- —
No personal income docs; deal must DSCR.
Hard money
10% down · 12.0% · 12mo
- Down + closing
- —
- Monthly P&I
- —
- Monthly cashflow
- —
- DSCR
- —
- Eligible?
- —
Short-term bridge; refi at stabilization.
Rent comps 40 comps
| Address | Beds | Baths | Sqft | Rent | $/sqft | DOM | Units | Dist |
|---|---|---|---|---|---|---|---|---|
| 1701 53rd St S Gulfport, FL | 3.0 | 1.0 | 994 | $2,800 | $2.82 | 6d | 1 | 0.18mi |
| 4933 13th Ave S Gulfport, FL | 2.0 | 1.0 | 939 | $2,200 | $2.34 | 22d | 1 | 0.24mi |
| 4938 12th Ave S Gulfport, FL | 3.0 | 2.0 | 990 | $1,795 | $1.81 | 0d | 1 | 0.26mi |
| 1922 55th St S Gulfport, FL | 2.0 | 1.0 | 864 | $2,500 | $2.89 | 6d | 1 | 0.43mi |
| 4631 Queensboro Ave S Unit 4631 St. Petersburg, FL | 3.0 | 2.0 | 1094 | $2,600 | $2.38 | 9d | 1 | 0.43mi |
| 4631 Queensboro Ave S St Petersburg, FL | 3.0 | 2.0 | 1094 | $2,600 | $2.38 | 13d | 1 | 0.43mi |
| 1933 47th St S Saint Petersburg, FL | 2.0 | 1.0 | 816 | $1,595 | $1.95 | 6d | 1 | 0.45mi |
| 4801 10th Ave S Unit 1 St. Petersburg, FL | 3.0 | 1.0 | 1100 | $2,200 | $2.00 | 26d | 1 | 0.45mi |
| 5709 18th Ave S Gulfport, FL | 2.0 | 1.0 | 704 | $2,200 | $3.12 | 0d | 1 | 0.51mi |
| 4545 12th Ave S Saint Petersburg, FL | 2.0 | 1.0 | 660 | $2,000 | $3.03 | 6d | 1 | 0.54mi |
| 4618 20th Ave S Saint Petersburg, FL | 2.0 | 1.0 | 921 | $1,800 | $1.95 | 5d | 1 | 0.55mi |
| 4537 10th Ave S Saint Petersburg, FL | 4.0 | 2.0 | 1046 | $2,690 | $2.57 | 6d | 1 | 0.59mi |
| 2402 52nd St S Gulfport, FL | 2.0 | 2.0 | 1028 | $3,000 | $2.92 | 6d | 1 | 0.59mi |
| 4601 22nd Ave S Saint Petersburg, FL | 1.0–2.0 | 1.0 | 872 | $1,349 | $1.55 | 4d | 3 | 0.60mi |
| 4421 11th Ave S Saint Petersburg, FL | 3.0 | 2.0 | 945 | $2,000 | $2.12 | 6d | 1 | 0.62mi |
| 2412 53rd St S Unit A Gulfport, FL | 3.0 | 1.0 | 821 | $2,250 | $2.74 | 26d | 1 | 0.63mi |
| 5713 21st Ave S Gulfport, FL | 2.0 | 1.0 | 800 | $1,750 | $2.19 | 26d | 1 | 0.63mi |
| 5715 21st Ave S Gulfport, FL | 2.0 | 1.0 | 800 | $2,000 | $2.50 | 20d | 1 | 0.64mi |
| 2506 54th St S Gulfport, FL | 2.0 | 1.0 | 876 | $1,800 | $2.05 | 9d | 1 | 0.68mi |
| 2506 54th St S Gulfport, FL | 2.0 | 1.0 | 938 | $1,800 | $1.92 | 26d | 1 | 0.68mi |
| 4327 17th Ave S Saint Petersburg, FL | 2.0 | 1.0 | 880 | $2,500 | $2.84 | 26d | 1 | 0.69mi |
| 1327 43rd St S Saint Petersburg, FL | 3.0 | 1.5 | 959 | $2,250 | $2.35 | 6d | 1 | 0.69mi |
| 4665 Yarmouth Ave S Saint Petersburg, FL | 2.0 | 1.0 | 826 | $1,950 | $2.36 | 26d | 1 | 0.70mi |
| 1628 43rd St S Saint Petersburg, FL | 3.0 | 2.0 | 1045 | $2,100 | $2.01 | 26d | 1 | 0.76mi |
| 2008 59th St S Gulfport, FL | 2.0 | 1.0 | 1024 | $2,300 | $2.25 | 6d | 1 | 0.76mi |
| 4541 6th Ave S Saint Petersburg, FL | 3.0 | 1.0 | 945 | $1,100 | $1.16 | 17d | 1 | 0.83mi |
| 2612 46th St S Gulfport, FL | 2.0 | 2.0 | 1063 | $2,500 | $2.35 | 0d | 1 | 0.87mi |
| 450 47th St S Saint Petersburg, FL | 3.0 | 1.0 | 960 | $2,950 | $3.07 | 6d | 1 | 0.89mi |
| 2865 51st St S Gulfport, FL | 2.0 | 1.0 | 944 | $1,900 | $2.01 | 13d | 1 | 0.92mi |
| 2865 51st St S Unit 5 Gulfport, FL | 2.0 | 1.0 | 944 | $1,900 | $2.01 | 16d | 1 | 0.92mi |
| 2626 58th St S Gulfport, FL | 2.0 | 1.0 | 900 | $2,050 | $2.28 | 6d | 1 | 0.94mi |
| 2800 47th St S Gulfport, FL | 2.0 | 1.0 | 890 | $2,300 | $2.58 | 6d | 1 | 0.96mi |
| 5034 2nd Ave S Unit A St. Petersburg, FL | 2.0 | 1.0 | 1062 | $1,950 | $1.84 | 6d | 1 | 0.96mi |
| 6100 Gulfport Blvd S #102 Gulfport, FL | 2.0 | 1.0 | 914 | $2,100 | $2.30 | 20d | 1 | 0.98mi |
| 6100 Gulfport Blvd S Gulfport, FL | 2.0 | 1.0 | 914 | $2,100 | $2.30 | 14d | 1 | 0.98mi |
| 5845 27th Ave S Gulfport, FL | 2.0 | 1.0 | 1000 | $2,600 | $2.60 | 26d | 1 | 0.99mi |
| 2814 Tifton St S Gulfport, FL | 2.0 | 1.0 | 1010 | $2,200 | $2.18 | 0d | 1 | 1.00mi |
| 641 Folsom St S Saint Petersburg, FL | 2.0 | 1.0 | 852 | $2,250 | $2.64 | 24d | 1 | 1.01mi |
| 505 43rd St S Unit 5051/2 St. Petersburg, FL | 2.0 | 1.0 | 800 | $2,000 | $2.50 | 26d | 1 | 1.03mi |
| 2820 Dupont St S Unit 201 Gulfport, FL | 2.0 | 1.0 | 850 | $1,675 | $1.97 | 26d | 1 | 1.03mi |
Listing history 50 events
-
2026-04-13soldstatus $188,000
-
2025-09-26status Pending
-
2025-09-25price $259,707
-
2025-09-10price $264,000
-
2025-09-05price $272,000
-
2025-08-25price $279,000
-
2025-08-15price $281,507
-
2025-08-12price $284,507
-
2025-07-29price $287,707
-
2025-07-07price $293,707
-
2025-06-05$295,000 Active
-
2024-10-16historical $2,250
-
2024-10-05$2,250
-
2024-10-02historical $2,450
-
2024-08-28price $2,450
-
2024-07-31historical
-
2024-06-18$2,650
-
2024-06-17status Active
-
2024-05-31historical
-
2024-03-18price $325,000
-
2024-01-01$339,000 Active
-
2023-07-25historical
-
2023-05-09price $334,000
-
2023-04-20price $357,900
-
2023-03-21$359,900 Active
-
2023-03-09soldstatus $279,000
-
2023-03-02soldstatus $279,000 Closed
-
2023-01-27status Pending
-
2023-01-26status Active
-
2023-01-16status Pending
-
2023-01-12$279,000 Active
-
2015-07-08soldstatus $72,000
-
2015-07-02soldstatus $72,000 Sold
-
2015-06-26status Pending
-
2015-06-18historical Contingent - Inspections
-
2015-02-27price $79,900
-
2015-01-16$82,500 Active
-
2014-09-18soldstatus $20,000 Sold
-
2014-07-07status Pending
-
2014-06-14status Active
-
2014-06-10historical
-
2014-05-14price $44,000 Active
-
2014-05-14status Active
-
2013-09-07$10,000
-
2006-06-07soldstatus $163,000
-
2006-05-31soldstatus $159,900
-
2006-01-25$159,900
-
2005-08-22soldstatus $68,000
-
2004-11-03$85,900
-
1999-10-29soldstatus $59,900
ⓘ Source: listings_history table (triggers on properties + properties_extension) + one-shot
backfill from property_details.listing_events for pre-trigger history.
Tax reassessment forecast FL · Resets to sale price
- Current annual tax
- $5,071 · $423/mo
- Projected year-2 tax
- $5,071 · $423/mo
- Expected delta
- $0/yr ($0/mo · 0.0%)
ⓘ Screening estimate from a state-policy table — verify with the county assessor before closing.
Climate risk First Street
- Flood 1/10 Low FEMA zone X (unshaded) · 0% chance over 30 yrs
- Wildfire 1/10 Low
- Heat 10/10 Extreme 7 d/yr ≥106°F today · 26 d/yr by 30 yrs out
- Wind 10/10 Extreme 99% chance of damaging wind over 30 yrs
- Air quality 4/10 Moderate 4 unhealthy d/yr today · 4 by 30 yrs out
Nearby sold comps map
Loading sold comps map…
Walkable amenities ~0.75 mi
Loading nearby amenities…
Taxation est. · year 1
- Rental income
- $27,669
- − Mortgage interest
- −$14,548
- − Property taxes
- −$5,071
- − Insurance
- −$1,299
- − Repairs & maintenance
- −$2,214
- − Management
- −$2,214
- − Depreciation
- −$7,555
- Taxable loss
- −$5,230
- Est. tax savings @ 24.0%
- +$1,255
- After-tax cash flow
- $401/yr
For passive investors: Depreciation is non-cash, so a rental often shows a tax loss while cash-flowing — sheltering income. Rental losses are passive: they offset passive income freely, and up to $25,000/yr can offset ordinary (W-2) income if you actively participate and your MAGI is under $100k (phasing out to $0 by $150k); unused losses carry forward. On sale, claimed depreciation is recaptured at up to 25%, and gains may owe capital-gains tax (a 1031 exchange can defer both). Figures are a year-1 estimate at your 24.0% rate — not tax advice; consult a CPA.
Schools (NCES district)
- District
- Pinellas
- NCES district ID
- 1201560
- Math proficiency
- 51% ▼ -5.00%
- Reading proficiency
- 51% ▼ -3.00%
- Median HH income
- $46,270
- Composite
- 43.27/100
- National rank
- #3046
- State rank
- #31 of 73 in FL
Livability — Gulfport
- Score
- 79/100
- State rank
- #151
- US rank
- #2285
Category grades
Schools grade is shown separately in the Schools card above.
Census & demographics
- Census place
- Gulfport, FL
- County
- Pinellas County · 939,478 people
- City population
- 24,324
- Metro
- Tampa-St. Petersburg-Clearwater, FL
- Population (ZIP)
- 24,324
- Household income
- $69,951
- Rent vs Own
- Severe rent burden
- 1371.0
Population outlook (Pinellas County) Hauer SSP2
- Today (2025)
- 1,027,532 people
- By 2030
- 1,063,586 · +3.5%
- By 2040
- 1,125,020 · +9.5%
- By 2050
- 1,168,637 · +13.7%
- By 2075
- 1,265,188 · +23.1%
- By 2100
- 1,260,357 · +22.7%
Race, ethnicity, and origin ACS 2023
- Neighborhood character
- Predominantly White (81%)
- Race & ethnicity
- White 81% Two or more races 7% Hispanic / Latino 7% Black 6% Asian 2%
- Hispanic origin (detail)
- Mexican 2% Puerto Rican 1% Cuban 1%
- Common ancestry
- Romanian 5% Lithuanian 3% Slovak 3%
- Foreign-born
- 11% · Canada, Vietnam
- Languages at home
- 89% English-only · Spanish 5% Russian/Polish/Slavic 1% French/Haitian/Cajun 1%
Political lean MEDSL · Pinellas
- 2024 margin
- Lean R (+5.2) · D 46.9% · R 52.1%
- 2008→2024 swing
- -13.5pp toward R · 2008: 8.3pp · 2024: -5.2pp
- All cycles
- 2024: R+5.2 2020: D+0.2 2016: R+1.1 2012: D+5.6 2008: D+8.3
Not yet ingested
- Civics
- —
Market trends
- HPI YoY
- ▼ -555.96%
- Current HPI
- 359.4858
- Rent YoY
- ▼ -0.61%
- Metro
- Tampa-St. Petersburg-Clearwater, FL
- State GDP YoY
- ▲ 3.28%
- F500 in state
- 36
Industry mix (Fortune 500 HQ in FL)
| Industry | F500 HQs | Revenue |
|---|---|---|
| Industrial Technology | 2 | $29B |
|
||
| Insurance | 2 | $17B |
|
||
| Retail | 1 | $60B |
|
||
| Technology Distribution | 1 | $58B |
|
||
| Homebuilding | 1 | $35B |
|
||
| Technology Manufacturing | 1 | $35B |
|
||
Price history
+1136.8% since first listed52 events — show timeline
- 2026-04-13 Sold (Public Records) $188,000 Public Records
- 2025-09-26 Pending — Stellar MLS as Distributed by MLS Grid
- 2025-09-25 Price Changed $259,707 Stellar MLS as Distributed by MLS Grid
- 2025-09-10 Price Changed $264,000 Stellar MLS as Distributed by MLS Grid
- 2025-09-05 Price Changed $272,000 Stellar MLS as Distributed by MLS Grid
- 2025-08-25 Price Changed $279,000 Stellar MLS as Distributed by MLS Grid
- 2025-08-15 Price Changed $281,507 Stellar MLS as Distributed by MLS Grid
- 2025-08-12 Price Changed $284,507 Stellar MLS as Distributed by MLS Grid
- 2025-07-29 Price Changed $287,707 Stellar MLS as Distributed by MLS Grid
- 2025-07-07 Price Changed $293,707 Stellar MLS as Distributed by MLS Grid
- 2025-06-05 Listed $295,000 Stellar MLS as Distributed by MLS Grid
- 2024-10-16 Rental Removed $2,250 STELLARMLS
- 2024-10-05 Listed for Rent $2,250 STELLARMLS
- 2024-10-02 Rental Removed $2,450 STELLARMLS
- 2024-08-28 Price Changed $2,450 STELLARMLS
- 2024-07-31 Listing Removed — Stellar MLS as Distributed by MLS Grid
- 2024-06-18 Listed for Rent $2,650 STELLARMLS
- 2024-06-17 Relisted — Stellar MLS as Distributed by MLS Grid
- 2024-05-31 Listing Removed — Stellar MLS as Distributed by MLS Grid
- 2024-03-18 Price Changed $325,000 Stellar MLS as Distributed by MLS Grid
- 2024-01-01 Listed $339,000 Stellar MLS as Distributed by MLS Grid
- 2023-07-25 Listing Removed — Stellar MLS as Distributed by MLS Grid
- 2023-05-09 Price Changed $334,000 Stellar MLS as Distributed by MLS Grid
- 2023-04-20 Price Changed $357,900 Stellar MLS as Distributed by MLS Grid
- 2023-03-21 Listed $359,900 Stellar MLS as Distributed by MLS Grid
- 2023-03-09 Sold (Public Records) $279,000 Public Records
- 2023-03-02 Sold (MLS) $279,000 Stellar MLS as Distributed by MLS Grid
- 2023-01-27 Pending — Stellar MLS as Distributed by MLS Grid
- 2023-01-26 Relisted — Stellar MLS as Distributed by MLS Grid
- 2023-01-16 Pending — Stellar MLS as Distributed by MLS Grid
- 2023-01-12 Listed $279,000 Stellar MLS as Distributed by MLS Grid
- 2015-07-08 Sold (Public Records) $72,000 Public Records
- 2015-07-02 Sold (MLS) $72,000 Stellar MLS as Distributed by MLS Grid
- 2015-06-26 Pending — Stellar MLS as Distributed by MLS Grid
- 2015-06-18 Contingent — Stellar MLS as Distributed by MLS Grid
- 2015-02-27 Price Changed $79,900 Stellar MLS as Distributed by MLS Grid
- 2015-01-16 Listed $82,500 Stellar MLS as Distributed by MLS Grid
- 2014-09-18 Sold (MLS) $20,000 Stellar MLS as Distributed by MLS Grid
- 2014-07-07 Pending — Stellar MLS as Distributed by MLS Grid
- 2014-06-14 Relisted — Stellar MLS as Distributed by MLS Grid
- 2014-06-10 Listing Removed — Stellar MLS as Distributed by MLS Grid
- 2014-05-14 Relisted — Stellar MLS as Distributed by MLS Grid
- 2014-05-14 Price Changed $44,000 Stellar MLS as Distributed by MLS Grid
- 2013-09-07 Listed $10,000 Stellar MLS as Distributed by MLS Grid
- 2006-06-07 Sold (Public Records) $163,000 Public Records
- 2006-05-31 Sold (MLS) $159,900 Stellar MLS as Distributed by MLS Grid
- 2006-01-25 Listed $159,900 Stellar MLS as Distributed by MLS Grid
- 2005-08-22 Sold (Public Records) $68,000 Public Records
- 2004-11-03 Listed $85,900 Stellar MLS as Distributed by MLS Grid
- 1999-10-29 Sold (Public Records) $59,900 Public Records
- 1982-05-01 Sold (Public Records) $8,000 Public Records
- 1981-12-01 Sold (Public Records) $15,200 Public Records
Property tax history
+13.2%/yrLatest (2025): $5,071 · +6.0% YoY. Source: county tax records.
Cash-flow waterfall
monthlySold comps — $/sqft
last 12 mo · ≤1 miLoading sold comps…