1525 Cold Spgs #82 · Cold Springs, CA
Flood risk 1/10 · Minimal
- FEMA flood zone
- X (unshaded)
- Chance of flooding over 30 yrs
- 0.0%
- Est. flood insurance / yr
- $507 – $1,088
Fire risk 10/10 · Severe
- Est. fire insurance / yr
- $659 – $1,223
Heat risk 6/10 · Moderate
- Hot days now (above 99°F)
- 7 days/yr
- Hot days in 30 yrs
- 16 days/yr
Wind risk 1/10 · Minimal
- Chance of severe wind over 30 yrs
- —
Air-quality risk 10/10 · Severe
- Unhealthy air days now
- 26 days/yr
- Unhealthy air days in 30 yrs
- 30 days/yr
Risk factors via First Street. Map © Google.
Why this score? — see what drove the B grade
The composite is a weighted blend of 9 inputs, each scored 0–100. Each bar is that input's sub-score; the figure is the points it added to the 100-point composite (weight × sub-score).
- Cash flow +30.0/30.0
- 1% rule +10.0/10.0
- DSCR +10.0/10.0
- ARV discount +9.8/15.0
- Rent growth +5.0/5.0
- Schools +4.7/10.0
- Condition / age +2.5/5.0
- Livability +2.2/5.0
- Appreciation +0.0/10.0
$57,000
🖨 Deal sheet 📄 Offer letter ✓ Due diligence
Listing remarks
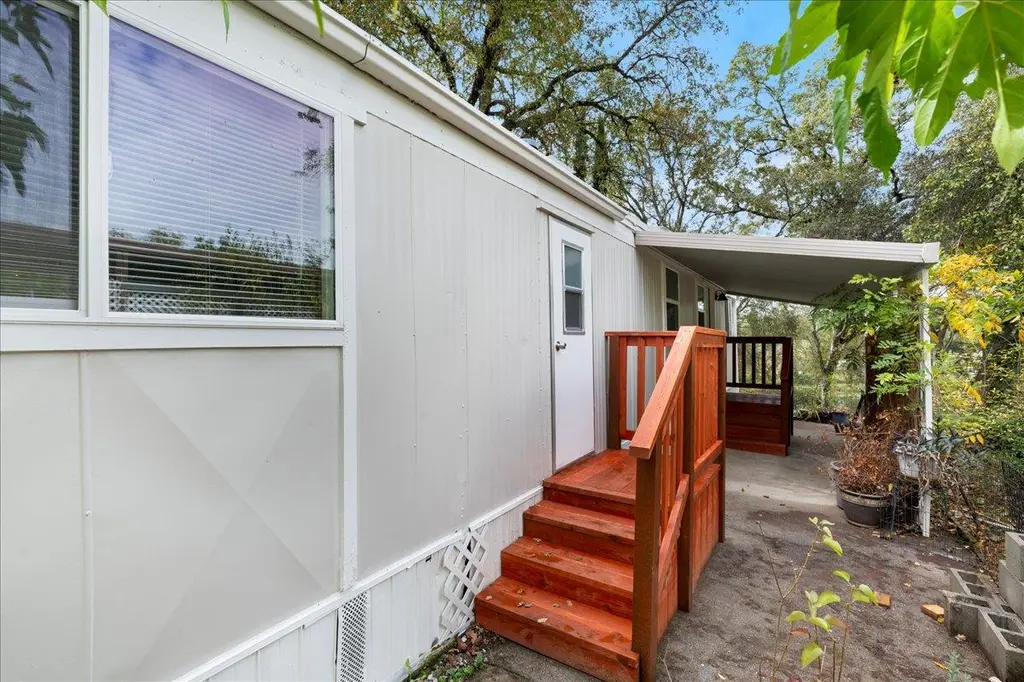
Affordable and Updated in Cold Springs 55+ Community. Discover comfort and simplicity in this nicely updated single-wide mobile home located in the desirable Cold Springs senior community. Featuring newer flooring, modern appliances, and fresh interior paint, this home is move-in ready and full of natural light. Enjoy an efficient layout with cozy living spaces and easy maintenance. Conveniently located near shopping, and dinning, this home offers an ideal blend of affordability and comfort in Placerville's welcoming 55+ neighborhood.
Key facts
- Move-in ready
- Updated mobile home
- Newer flooring
Tags
Property features AI
Finance
- Financial info: Monthly land lease: $770
- HOA & community: No homeowners association; Land lease required
Exterior
- Parking: Directions note: Cold Springs Rd to property, space #82
- Utilities: 220 volts in kitchen; Public water; Septic system
- Home design: Manufactured in park (single wide); Built in 1963; Located in a senior community; Address: 1525 Cold Spgs #82, Placerville, CA 95667 (space #82)
- Construction: Aluminum skirting; Other roof type; Manufactured home by Guerdon Inc
- Exterior features: Shed(s)
Interior
- Kitchen: Free standing gas range; Microwave
- Bedrooms: 1 bedroom
- Flooring: Laminate
- Bathrooms: 1 full bathroom with tub and shower over
- Heating & cooling: Central heating; Window unit(s) for cooling
- Interior features: Free standing gas range; Microwave; Laminate flooring; Living room with unspecified/other feature; Dining space in kitchen
- Laundry & utility: No laundry hookups inside (none listed)
Neighborhood map
What this means for you Summary
Snapshot
- This is a 1-bed/1.0-bath manufactured listed at $57k.
Deal economics
- At list price, monthly cash flow is $741 ($9k/yr) — positive.
- The deal already cash-flows at list — no discount required.
- Meets the 1% rule at list price ($1k rent vs $57k).
- Recommended offer: $55k (3.0% below list) — sets the bar for market timing.
- Cap rate 21.9% vs local median 2.0% in Cold Springs — top-decile yield for the area; either an underpriced asset or a hidden risk that comps aren't pricing in. Stress-test before assuming the spread holds.
Location & tenants
- Location reads 45/100 on livability (#1,305 in CA) — a working-class tenant base; expect higher turnover. Strengths: cost of living A; Watch: employment D+, schools F, crime F.
- Gold Trail Union Elementary (rural): math 45% / reading 54% proficiency, ranked #396 of 1,400 in CA (top 28%) — families likely to look elsewhere, expect single-tenant / working-renter base with shorter leases.
- Market conditions: Rents rising fast (+12.5%/yr); 351 active listings in the ZIP; solid renter incomes; 437 units permitted in El Dorado County in 2024 (0 in 5+ unit buildings).
Forward outlook
- Local home prices are declining (-3.0%/yr); year-one equity from $394 of loan paydown is wiped out by about $2k of value loss. Plan a longer hold.
- El Dorado County population projected to shrink 3% by 2050 — rents likely to lag national; underwrite the cash flow, not the appreciation.
- At projected returns (-3.0% appreciation + 8.0% rent growth), your $16k cash investment doubles in ~2 years — after that, you're playing with house money.
Negotiation context
- It's been on market 48 days — a 3% lower offer ($55k) is reasonable based on typical stale-listing flexibility.
Risks & watch-outs
- Climate carrying-cost: severe wildfire risk; extreme-heat days projected 7→16/yr by 2055 (HVAC capex compounding) — expect insurance premiums to compound above CPI over the hold.
Questions for the listing agent
- It's been on market 48 days. Have you received any prior offers? Is the seller open to a 3% concession, seller financing, or rate buy-down credit?
- Built in 1963 — when were the roof, HVAC, electrical panel, plumbing, and water heater last replaced?
- Is there a deadline driving the sale (1031 exchange, divorce, estate, relocation)? That informs how much negotiation room exists.
- Schools are F-rated, which usually means shorter tenancies and higher turnover. Who's the typical renter profile here, and what's been the actual vacancy rate?
- Crime grade is F in this area — have there been break-ins, vandalism, or insurance claims at this property in the last 3 years? What carrier currently insures it and at what premium?
- What's the average days-on-market for RENTAL listings here right now (not sales)? A rising rental-DOM trend means longer vacancies and softer asking-rent achievability than the comps imply.
- What's the recent tenant-quality profile in this submarket — average credit score on applications, eviction rate, late-payment / NSF rate, and stable-employment percentage? A property-management company in the area should have these aggregated.
- How much new for-sale + rental construction is in the pipeline within 1–3 miles? Heavy new supply typically softens prices + rents 12–24 months out; constrained supply supports both.
Investment metrics
- 1% rule
- 2.52% ✓
- Cap rate
- 21.89%
- Cash-on-cash
- 55.70%
- DSCR
- 3.48
- GRM
- 3.3
CMA / ARV
- ARV (on-the-fly)
- $60,000
- Comps found
- 1
Show comp detail 1 sale within ~0.75 mi
| Address | Dist | Beds/Ba | Sqft | Sold | Price | $/sf | Match |
|---|---|---|---|---|---|---|---|
| 1525 Cold Springs Rd #8 | 0.17mi | 1/1.0 | 500 (0%) | 10mo | $60,000 | $120 | 84 |
Match score weights: distance 35% · size 25% · config 20% · recency 20%. Top-matched comps best support the ARV.
Projected returns pro-forma
-3.0% appreciation · 8.0% rent growth · sell at horizon
- IRR
- 59.6%
- Equity multiple
- 3.85×
- Total profit
- $45,556
- Equity at exit
- $8,499
- IRR
- 66.1%
- Equity multiple
- 9.46×
- Total profit
- $135,057
- Equity at exit
- $4,928
Cash invested: $15,960 (down + closing). Projections, not guarantees.
Landlord ↔ Tenant lean methodology
- Overall (STATE)
- 18 Strongly Tenant-Friendly
- State California
- 18 Strongly Tenant-Friendly · D+13
- County
- — inherits STATE
- City
- — inherits STATE
ZIP-level market 95667
- Rents YoY
- 12.5%
- Active inventory
- 351
- Price-to-rent
- 3.3×
Monthly cashflow live
- Estimated rent
- $1,436 medium interval (Pro) →
- Mortgage (P&I)
- −$299
- Tax est. 1.5%
- −$71 /mo · $855/yr
- Insurance
- −$24
- HOA
- −$0
- Vacancy / Maint / Mgmt
- −$302
- Net cashflow
- $741
Break-even live
UW: 25.0% down · 7.5% · 30yr · 1.5% tax · 5.0% vac · 8.0% maint · 8.0% mgmt
Financing live
Cash to close
- Down payment
- $14,250
- Closing costs
- $1,710
- Reserves months
- —
- Total cash needed
- —
Loan-product check · same deal, 3 products live
Conventional
25% down · 7.5% · 30yr
- Down + closing
- —
- Monthly P&I
- —
- Monthly cashflow
- —
- DSCR
- —
- Eligible?
- —
Personal DTI + credit; lowest rate.
DSCR
20% down · 8.5% · 30yr
- Down + closing
- —
- Monthly P&I
- —
- Monthly cashflow
- —
- DSCR
- —
- Eligible?
- —
No personal income docs; deal must DSCR.
Hard money
10% down · 12.0% · 12mo
- Down + closing
- —
- Monthly P&I
- —
- Monthly cashflow
- —
- DSCR
- —
- Eligible?
- —
Short-term bridge; refi at stabilization.
Listing history 12 events
-
2026-06-18days on market $57,000 Active 48 DOM
-
2026-06-17days on market $57,000 Active 47 DOM
-
2026-06-16days on market $57,000 Active 46 DOM
-
2026-06-15days on market $57,000 Active 45 DOM
-
2026-06-13days on market $57,000 Active 43 DOM
-
2026-06-09days on market $57,000 Active 39 DOM
-
2026-06-08days on market $57,000 Active 38 DOM
-
2026-06-07days on market $57,000 Active 37 DOM
-
2026-06-03days on market $57,000 Active 33 DOM
-
2026-06-02days on market $57,000 Active 32 DOM
-
2026-06-01days on market $57,000 Active 31 DOM
-
2026-05-31days on market $57,000 Active 30 DOM
ⓘ Source: listings_history table (triggers on properties + properties_extension) + one-shot
backfill from property_details.listing_events for pre-trigger history.
Climate risk First Street
- Flood 1/10 Low FEMA zone X (unshaded) · 0% chance over 30 yrs
- Wildfire 10/10 Extreme
- Heat 6/10 Major 7 d/yr ≥99°F today · 16 d/yr by 30 yrs out
- Wind 1/10 Low
- Air quality 10/10 Extreme 26 unhealthy d/yr today · 30 by 30 yrs out
Nearby sold comps map
Loading sold comps map…
Walkable amenities ~0.75 mi
Loading nearby amenities…
Taxation est. · year 1
- Rental income
- $17,236
- − Mortgage interest
- −$3,193
- − Property taxes
- −$855
- − Insurance
- −$285
- − Repairs & maintenance
- −$1,379
- − Management
- −$1,379
- − Depreciation
- −$1,658
- Taxable income
- $8,487
- Est. tax owed @ 24.0%
- −$2,037
- After-tax cash flow
- $6,852/yr
For passive investors: Depreciation is non-cash, so a rental often shows a tax loss while cash-flowing — sheltering income. Rental losses are passive: they offset passive income freely, and up to $25,000/yr can offset ordinary (W-2) income if you actively participate and your MAGI is under $100k (phasing out to $0 by $150k); unused losses carry forward. On sale, claimed depreciation is recaptured at up to 25%, and gains may owe capital-gains tax (a 1031 exchange can defer both). Figures are a year-1 estimate at your 24.0% rate — not tax advice; consult a CPA.
Schools (NCES district)
- District
- Gold Trail Union Elementary
- NCES district ID
- 0615450
- Math proficiency
- 45% ▲ 3.00%
- Reading proficiency
- 54% ▲ 2.00%
- Median HH income
- $72,658
- Composite
- 46.55/100
- National rank
- #5298
- State rank
- #396 of 1400 in CA
Livability — Cold Springs
- Score
- 45/100
- State rank
- #1305
- US rank
- #26620
Category grades
Schools grade is shown separately in the Schools card above.
Census & demographics
- Census place
- Cold Springs, CA
- County
- El Dorado County · 144,198 people
- Metro
- Sacramento-Roseville-Folsom, CA
- Population (ZIP)
- 36,830
- Household income
- $89,938
- Rent vs Own
- Severe rent burden
- 1147.0
Population outlook (El Dorado County) Hauer SSP2
- Today (2025)
- 191,666 people
- By 2030
- 193,662 · +1.0%
- By 2040
- 192,583 · +0.5%
- By 2050
- 185,904 · -3.0%
- By 2075
- 169,543 · -11.5%
- By 2100
- 139,623 · -27.2%
Race, ethnicity, and origin ACS 2023
- Neighborhood character
- Predominantly White (78%)
- Race & ethnicity
- White 78% Hispanic / Latino 14% Two or more races 8% Native American 1%
- Hispanic origin (detail)
- Mexican 11%
- Common ancestry
- Italian 4% Slovak 4% Lithuanian 3%
- Foreign-born
- 6% · Canada, China
- Languages at home
- 92% English-only · Spanish 6%
Political lean MEDSL · El Dorado
- 2024 margin
- R (+12.0) · D 42.6% · R 54.6% · Other 2.8%
- 2008→2024 swing
- -1.5pp toward R · 2008: -10.5pp · 2024: -12.0pp
- All cycles
- 2024: R+12.0 2020: R+8.8 2016: R+13.9 2012: R+18.2 2008: R+10.5
Not yet ingested
- Civics
- —
Market trends
- HPI YoY
- ▼ -480.50%
- Current HPI
- 262.6014
- Rent YoY
- ▲ 12.48%
- Metro
- Sacramento-Roseville-Folsom, CA
- State GDP YoY
- ▲ 3.21%
- F500 in state
- 116
Industry mix (Fortune 500 HQ in CA)
| Industry | F500 HQs | Revenue |
|---|---|---|
| Technology | 27 | $1,492B |
|
||
| Financial Services | 3 | $174B |
|
||
| Retail | 3 | $44B |
|
||
| Insurance | 3 | $26B |
|
||
| Media / Entertainment | 2 | $115B |
|
||
| Pharmaceuticals / Biotech | 2 | $62B |
|
||
Cash-flow waterfall
monthlySold comps — $/sqft
last 12 mo · ≤1 miLoading sold comps…