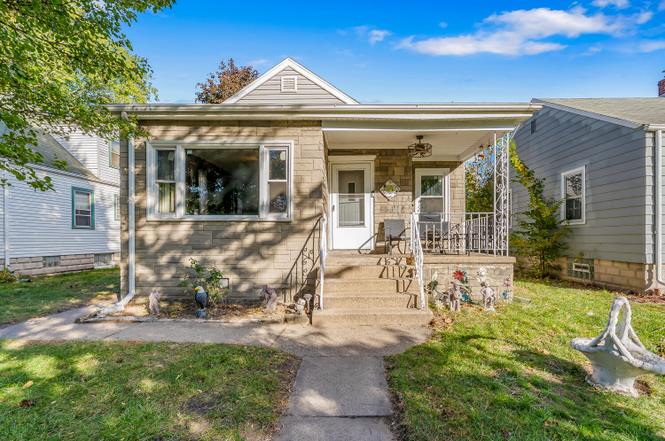
3143 Parkway North St · Hammond, IN
Flood risk 1/10 · Minimal
- FEMA flood zone
- X (unshaded)
- Chance of flooding over 30 yrs
- 0.0%
- Est. flood insurance / yr
- $473 – $860
Fire risk 3/10 · Minor
- Est. fire insurance / yr
- $717 – $1,331
Heat risk 3/10 · Minor
- Hot days now (above 102°F)
- 7 days/yr
- Hot days in 30 yrs
- 15 days/yr
Wind risk 2/10 · Minimal
- Chance of severe wind over 30 yrs
- 1.0%
Air-quality risk 4/10 · Minor
- Unhealthy air days now
- 5 days/yr
- Unhealthy air days in 30 yrs
- 6 days/yr
Risk factors via First Street. Map © Google.
Why this score? — see what drove the C- grade
The composite is a weighted blend of 9 inputs, each scored 0–100. Each bar is that input's sub-score; the figure is the points it added to the 100-point composite (weight × sub-score).
- Cash flow +16.7/30.0
- ARV discount +15.0/15.0
- DSCR +5.2/10.0
- 1% rule +3.7/10.0
- Livability +3.5/5.0
- Rent growth +2.5/5.0
- Condition / age +2.5/5.0
- Schools +1.1/10.0
- Appreciation +0.0/10.0
$199,900
🖨 Deal sheet (PDF) 📄 Offer letter ✓ Due diligence
Listing remarks MLS
Recently updated 3 bedroom home conveniently located to South Shore Train Station and major expressways for easy commute. New roof and siding, 2 car garage, large fenced back yard, full partially finished basement. Ask about Hammond down payment assistance program! Sold as is.
Key facts
- New floors
- Remodeled bathroom
- Fenced yard
Tags
Property features AI
Finance
- Other: Assessor-listed lot size source
Exterior
- Parking: Detached garage; 2-car garage; On-street parking; Alley access
- Security: Smoke detectors
- Utilities: Public water; Public sewer; 100 amp electric service; Cable available
- Home design: One and one-half stories; Built in 1942
- Construction: Stone and vinyl siding exterior; Shingle roof; Has basement (unfinished, storage space)
- Exterior features: Covered front porch; Balcony; Private yard; Back yard fencing; Rain gutters; Neighborhood and trees/woods view; Aluminum window frames; Garage(s) on property
Interior
- Kitchen: Range; Refrigerator
- Bedrooms: Primary bedroom; Bedroom 2; Bedroom 3
- Flooring: Hardwood floors; Linoleum flooring
- Bathrooms: 1 full bathroom; 1 half bathroom
- Heating & cooling: Forced air heating (natural gas); Central air conditioning
- Interior features: Ceiling fans; Eat-in kitchen; Other interior features
- Laundry & utility: Washer; Dryer; Laundry on lower level; Unfinished basement storage space
Neighborhood map
What this means for you Summary
Snapshot
- This is a 3-bed/1.5-bath single-family listed at $200k.
Deal economics
- At list price, monthly cash flow is $125 ($2k/yr) — positive.
- The deal already cash-flows at list — no discount required.
- To meet the 1% rule (rent ≥ 1% of price), the offer needs to be $175k (12.7% below list).
- Recommended offer: $175k (12.7% below list) — sets the bar for 1% rule.
- Cap rate 7.0% vs local median 5.8% in Hammond — meaningfully above typical; check what's discounted (condition, days-on-market, listing class) to confirm the premium yield is real.
Location & tenants
- Location reads 70/100 on livability (#143 in IN) — a middle-class / working-renter tenant base. Strengths: cost of living A+, housing A+, commute A; Watch: health & safety D+, employment D, crime F.
- School City Of Hammond (suburban): math 8% / reading 18% proficiency, ranked #289 of 301 in IN (top 96%) — low school quality limits family demand, transient renter base, plan for 1-2y turnover; 74% free/reduced lunch — lower-income household profile, screen leases tightly.
- Zoned schools: Warren G Harding Elementary School (math 11% / reading 19%, grade F, #859 of 994 statewide, top 87%, 684 students, 77% FRL); Charles N Scott Middle School (math 5% / reading 15%, grade F, #314 of 330 statewide, top 95%, 738 students, 75% FRL); Morton Senior High School (math 12% / reading 54%, grade F, #290 of 369 statewide, top 79%, 1,609 students, 69% FRL) — zoned schools at 74% FRL track the district average.
- Market conditions: 62 active listings in the ZIP; 1 comparable units currently listed for rent nearby; 1,642 units permitted in Lake County in 2024 (14 in 5+ unit buildings).
- This rent runs 35% of the median local income ($60k/yr) — at the standard rent-burdened threshold; future hikes will face affordability resistance.
Forward outlook
- Local home prices are declining (-3.0%/yr); year-one equity from $1k of loan paydown is wiped out by about $6k of value loss. Plan a longer hold.
- Lake County population projected to shrink 7% by 2050 — rents likely to lag national; underwrite the cash flow, not the appreciation.
Negotiation context
- It's been on market 178 days — a 12% lower offer ($176k) is reasonable based on typical stale-listing flexibility.
- 2 sale attempts since 6y ago with the ask held roughly flat each time — persistent listings suggest the price (not the market) is what's stuck; bring a comps-based counter.
- Current owner paid $100k; list at $200k implies a 101% gain — meaningful room to come down on a strong offer.
Risks & watch-outs
- Watch-outs: built in 1942 — expect roof / HVAC / electrical / plumbing capex.
Questions for the listing agent
- It's been on market 178 days. Have you received any prior offers? Is the seller open to a 13% concession, seller financing, or rate buy-down credit?
- Built in 1942 — when were the roof, HVAC, electrical panel, plumbing, and water heater last replaced?
- Why hasn't it sold? Are there any deal-killer items the seller is aware of (foundation, flood, title, zoning, code violations)?
- Is there a deadline driving the sale (1031 exchange, divorce, estate, relocation)? That informs how much negotiation room exists.
- Schools are F-rated, which usually means shorter tenancies and higher turnover. Who's the typical renter profile here, and what's been the actual vacancy rate?
- Crime grade is F in this area — have there been break-ins, vandalism, or insurance claims at this property in the last 3 years? What carrier currently insures it and at what premium?
- What's the average days-on-market for RENTAL listings here right now (not sales)? A rising rental-DOM trend means longer vacancies and softer asking-rent achievability than the comps imply.
- What's the recent tenant-quality profile in this submarket — average credit score on applications, eviction rate, late-payment / NSF rate, and stable-employment percentage? A property-management company in the area should have these aggregated.
- How much new for-sale + rental construction is in the pipeline within 1–3 miles? Heavy new supply typically softens prices + rents 12–24 months out; constrained supply supports both.
Investment metrics
- 1% rule
- 0.87% ✗
- Cap rate
- 7.04%
- Cash-on-cash
- 2.68%
- DSCR
- 1.12
- GRM
- 9.5
CMA / ARV
- ARV (on-the-fly)
- $247,968
- Comps found
- 12
Show comp detail 12 sales within ~0.75 mi
| Address | Dist | Beds/Ba | Sqft | Sold | Price | $/sf | Match |
|---|---|---|---|---|---|---|---|
| 6525 California Ave | 0.40mi | 3/1.5 | 1,800 (+4%) | 1mo | $226,500 | $126 | 73 |
| 3014 Kenwood St | 0.20mi | 3/2.0 | 1,639 (-5%) | 11mo | $248,600 | $152 | 71 |
| 3154 Parkway North St | 0.04mi | 3/1.5 | 1,484 (-14%) | 8mo | $239,500 | $161 | 68 |
| 6632 Maryland Ave | 0.61mi | 3/1.5 | 1,858 (+8%) | 6mo | $199,900 | $108 | 53 |
| 6525 Carolina Ave | 0.35mi | 4/1.0 (+1) | 1,536 (-11%) | 8mo | $215,000 | $140 | 52 |
| 6609 Illinois Ave | 0.48mi | 4/2.0 (+1) | 1,600 (-7%) | 9mo | $255,000 | $159 | 52 |
| 6545 Illinois Ave | 0.45mi | 4/2.0 (+1) | 1,600 (-7%) | 11mo | $250,000 | $156 | 51 |
| 6635 Illinois Ave | 0.54mi | 4/2.0 (+1) | 1,600 (-7%) | 7mo | $130,000 | $81 | 50 |
| 6611 Arkansas Ave | 0.51mi | 2/1.5 (-1) | 1,492 (-13%) | 2mo | $191,000 | $128 | 47 |
| 6715 Idaho Ave | 0.60mi | 3/1.0 | 1,560 (-9%) | 8mo | $225,000 | $144 | 47 |
| 6634 Alabama Ave | 0.64mi | 4/2.0 (+1) | 1,825 (+6%) | 10mo | $239,000 | $131 | 45 |
| 6440 Nebraska Ave | 0.65mi | 4/2.0 (+1) | 1,491 (-13%) | 6mo | $255,000 | $171 | 36 |
Match score weights: distance 35% · size 25% · config 20% · recency 20%. Top-matched comps best support the ARV.
Projected returns pro-forma
-3.0% appreciation · 3.0% rent growth · sell at horizon
- IRR
- -12.1%
- Equity multiple
- 0.56×
- Total profit
- $-24,477
- Equity at exit
- $29,806
- IRR
- -3.0%
- Equity multiple
- 0.80×
- Total profit
- $-11,268
- Equity at exit
- $17,284
Cash invested: $55,972 (down + closing). Projections, not guarantees.
Landlord ↔ Tenant lean methodology
- Overall (STATE)
- 90 Strongly Landlord-Friendly
- State Indiana
- 90 Strongly Landlord-Friendly · R+11
- County
- — inherits STATE
- City
- — inherits STATE
ZIP-level market 46323
- Home prices YoY
- -18.8%
- Active inventory
- 62
- Price-to-rent
- 9.5×
Monthly cashflow live
- Estimated rent
- $1,745 medium interval (Pro) →
- Mortgage (P&I)
- −$1,048
- Tax from tax record
- −$122 /mo · $1,463/yr
- Insurance
- −$83
- HOA
- −$0
- Vacancy / Maint / Mgmt
- −$366
- Net cashflow
- $125
Break-even live
Sensitivity live
| Price | -10% $238 | -5% $182 | +0% $125 | +5% $69 | +10% $12 |
|---|---|---|---|---|---|
| Rent | -10% $-13 | -5% $56 | +0% $125 | +5% $194 | +10% $263 |
| Rate | -1.0pp $226 | -0.5pp $176 | base $125 | +0.5pp $73 | +1.0pp $21 |
UW: 25.0% down · 7.5% · 30yr · 1.5% tax · 5.0% vac · 8.0% maint · 8.0% mgmt
Financing live
Cash to close
- Down payment
- $49,975
- Closing costs
- $5,997
- Reserves months
- —
- Total cash needed
- —
Loan-product check · same deal, 3 products live
Conventional
25% down · 7.5% · 30yr
- Down + closing
- —
- Monthly P&I
- —
- Monthly cashflow
- —
- DSCR
- —
- Eligible?
- —
Personal DTI + credit; lowest rate.
DSCR
20% down · 8.5% · 30yr
- Down + closing
- —
- Monthly P&I
- —
- Monthly cashflow
- —
- DSCR
- —
- Eligible?
- —
No personal income docs; deal must DSCR.
Hard money
10% down · 12.0% · 12mo
- Down + closing
- —
- Monthly P&I
- —
- Monthly cashflow
- —
- DSCR
- —
- Eligible?
- —
Short-term bridge; refi at stabilization.
Rent comps 1 comps
| Address | Beds | Baths | Sqft | Rent | $/sqft | DOM | Units | Dist |
|---|---|---|---|---|---|---|---|---|
| 6949 Alabama Ave Hammond, IN | 2.0 | 1.5 | 1200 | $1,795 | $1.50 | 5d | 1 | 0.99mi |
Listing history 5 events
-
2026-05-01status Pending
-
2026-03-18price $199,900
-
2025-11-04$209,900 Active
-
2020-04-02soldstatus $99,500 277-char remark
Show marketing remark (277 chars)
Recently updated 3 bedroom home conveniently located to South Shore Train Station and major expressways for easy commute. New roof and siding, 2 car garage, large fenced back yard, full partially finished basement. Ask about Hammond down payment assistance program! Sold as is.
-
2020-01-28$99,500 277-char remark
Show marketing remark (277 chars)
Recently updated 3 bedroom home conveniently located to South Shore Train Station and major expressways for easy commute. New roof and siding, 2 car garage, large fenced back yard, full partially finished basement. Ask about Hammond down payment assistance program! Sold as is.
ⓘ Source: listings_history table (triggers on properties + properties_extension) + one-shot
backfill from property_details.listing_events for pre-trigger history.
Tax reassessment forecast IN · Partial reset (capped growth)
- Current annual tax
- $1,463 · $122/mo
- Projected year-2 tax
- $1,581 · $132/mo
- Expected delta
- +$118/yr (+$10/mo · 8.1%)
ⓘ Screening estimate from a state-policy table — verify with the county assessor before closing.
Climate risk First Street
- Flood 1/10 Low FEMA zone X (unshaded) · 0% chance over 30 yrs
- Wildfire 3/10 Moderate
- Heat 3/10 Moderate 7 d/yr ≥102°F today · 15 d/yr by 30 yrs out
- Wind 2/10 Low 100% chance of damaging wind over 30 yrs
- Air quality 4/10 Moderate 5 unhealthy d/yr today · 6 by 30 yrs out
Nearby sold comps map
Loading sold comps map…
Walkable amenities ~0.75 mi
Loading nearby amenities…
Taxation est. · year 1
- Rental income
- $20,941
- − Mortgage interest
- −$11,198
- − Property taxes
- −$1,463
- − Insurance
- −$1,000
- − Repairs & maintenance
- −$1,675
- − Management
- −$1,675
- − Depreciation
- −$5,815
- Taxable loss
- −$1,885
- Est. tax savings @ 24.0%
- +$452
- After-tax cash flow
- $1,954/yr
For passive investors: Depreciation is non-cash, so a rental often shows a tax loss while cash-flowing — sheltering income. Rental losses are passive: they offset passive income freely, and up to $25,000/yr can offset ordinary (W-2) income if you actively participate and your MAGI is under $100k (phasing out to $0 by $150k); unused losses carry forward. On sale, claimed depreciation is recaptured at up to 25%, and gains may owe capital-gains tax (a 1031 exchange can defer both). Figures are a year-1 estimate at your 24.0% rate — not tax advice; consult a CPA.
Schools (NCES district)
- District
- School City Of Hammond
- NCES district ID
- 1804320
- Math proficiency
- 8% ▼ -18.00%
- Reading proficiency
- 18% ▼ -15.00%
- Median HH income
- $39,970
- Composite
- 11.11/100
- National rank
- #9730
- State rank
- #289 of 301 in IN
Livability — Hammond
- Score
- 70/100
- State rank
- #143
- US rank
- #7343
Category grades
Schools grade is shown separately in the Schools card above.
Census & demographics
- Census place
- Hammond, IN
- County
- Lake County · 422,878 people
- City population
- 58,809
- Metro
- Chicago-Naperville-Elgin, IL-IN-WI
- Population (ZIP)
- 23,047
- Household income
- $59,688
- Rent vs Own
- Severe rent burden
- 692.0
Population outlook (Lake County) Hauer SSP2
- Today (2025)
- 484,026 people
- By 2030
- 478,091 · -1.2%
- By 2040
- 462,974 · -4.3%
- By 2050
- 449,894 · -7.1%
- By 2075
- 436,169 · -9.9%
- By 2100
- 426,607 · -11.9%
Race, ethnicity, and origin ACS 2023
- Neighborhood character
- Diverse neighborhood (Simpson 0.68)
- Race & ethnicity
- Hispanic / Latino 38% White 36% Black 21% Two or more races 12% Asian 2% Native American 1%
- Hispanic origin (detail)
- Mexican 29% Puerto Rican 7%
- Common ancestry
- Romanian 6% Italian 2% Lithuanian 1%
- Foreign-born
- 8% · Canada, China
- Languages at home
- 78% English-only · Spanish 19% Chinese 1%
Political lean MEDSL · Lake
- 2024 margin
- Lean D (+5.6) · D 52.1% · R 46.5% · Other 1.5%
- 2008→2024 swing
- -28.6pp toward R · 2008: 34.3pp · 2024: 5.6pp
- All cycles
- 2024: D+5.6 2020: D+15.1 2016: D+20.6 2012: D+31.0 2008: D+34.3
Not yet ingested
- Civics
- —
Market trends
- HPI YoY
- ▼ -67.70%
- Current HPI
- 293.4702
- Rent YoY
- —
- Metro
- Chicago-Naperville-Elgin, IL-IN-WI
- State GDP YoY
- ▲ 2.90%
- F500 in state
- 18
Industry mix (Fortune 500 HQ in IN)
| Industry | F500 HQs | Revenue |
|---|---|---|
| Industrial Machinery | 2 | $37B |
|
||
| Healthcare | 1 | $177B |
|
||
| Pharmaceuticals | 1 | $45B |
|
||
| Metals / Steel | 1 | $18B |
|
||
| Agriculture | 1 | $17B |
|
||
| Packaging | 1 | $12B |
|
||
Price history
+100.9% since first listed5 events — show timeline
- 2026-05-01 Pending — NIRA MLS as Distributed by MLS Grid
- 2026-03-18 Price Changed $199,900 NIRA MLS as Distributed by MLS Grid
- 2025-11-04 Listed $209,900 NIRA MLS as Distributed by MLS Grid
- 2020-04-02 Sold (MLS) $99,500 NIRA MLS as Distributed by MLS Grid
- 2020-01-28 Listed $99,500 NIRA MLS as Distributed by MLS Grid
Property tax history
+4.6%/yrLatest (2024): $1,463 · -9.9% YoY. Source: county tax records.
Cash-flow waterfall
monthlySold comps — $/sqft
last 12 mo · ≤1 miLoading sold comps…