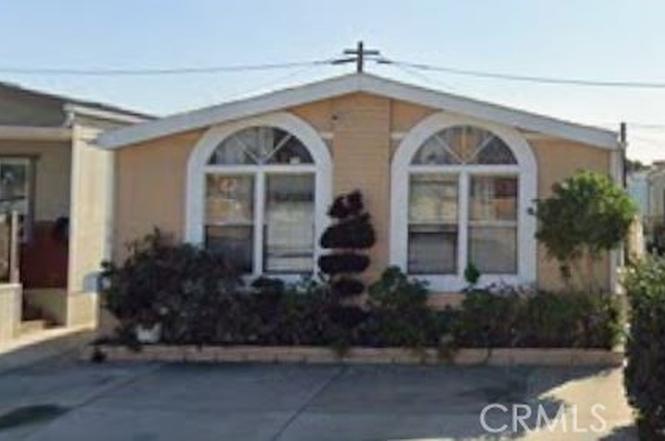
706 W Romneya Dr · Anaheim, CA
Flood risk 1/10 · Minimal
- FEMA flood zone
- X (shaded)
- Chance of flooding over 30 yrs
- 0.0%
- Est. flood insurance / yr
- $507 – $1,088
Fire risk 1/10 · Minimal
- Est. fire insurance / yr
- $659 – $1,223
Heat risk 6/10 · Moderate
- Hot days now (above 92°F)
- 7 days/yr
- Hot days in 30 yrs
- 23 days/yr
Wind risk 1/10 · Minimal
- Chance of severe wind over 30 yrs
- —
Air-quality risk 5/10 · Moderate
- Unhealthy air days now
- 7 days/yr
- Unhealthy air days in 30 yrs
- 9 days/yr
Risk factors via First Street. Map © Google.
Why this score? — see what drove the B+ grade
The composite is a weighted blend of 9 inputs, each scored 0–100. Each bar is that input's sub-score; the figure is the points it added to the 100-point composite (weight × sub-score).
- Cash flow +30.0/30.0
- ARV discount +15.0/15.0
- 1% rule +10.0/10.0
- DSCR +10.0/10.0
- Rent growth +3.8/5.0
- Livability +3.5/5.0
- Condition / age +2.5/5.0
- Schools +2.3/10.0
- Appreciation +0.0/10.0
$189,900
🖨 Deal sheet (PDF) 📄 Offer letter ✓ Due diligence
Listing remarks
Welcome to affordable California living! This spacious 4-bedroom, 2-bathroom manufactured home is a rare opportunity in the heart of Anaheim, CA, offering the perfect blend of comfort, functionality, and unbeatable value. With a low monthly land lease, your housing costs stay remarkably budget-friendly without sacrificing space or convenience. The home features new interior paint and new bedroom flooring, and two year old whole-home water filtration system and double pain windows throughout (except 2 front windows). This home offers thrree parking spaces out front. With some TLC and updates, you can make this home truly your own. A great opportunity for the hands-on buyer looking to put th
Key facts
- 3 parking spots
- Built 1988
- Listed 62 days
Property features AI
Finance
- Financial info: Land lease of $1,450
- HOA & community: Part of an association; Located in Romneya Mobile Estates; Community park
Exterior
- Parking: Driveway parking; 3 uncovered parking spaces
- Utilities: Public sewer; Private water
- Home design: Single-story mobile home; Mobile home remains on site; 12 ft by 64 ft mobile dimensions; Seller-supplied year built
- Exterior features: No pool; Park nearby
Interior
- Bathrooms: 2 full bathrooms
- Interior features: Street-level entry
- Laundry & utility: Washer included; Dryer included
Neighborhood map
What this means for you Summary
Snapshot
- This is a 4-bed/2.0-bath manufactured listed at $190k.
Deal economics
- At list price, monthly cash flow is $2k ($26k/yr) — positive.
- The deal already cash-flows at list — no discount required.
- Meets the 1% rule at list price ($4k rent vs $190k).
- Recommended offer: $179k (6.0% below list) — sets the bar for market timing.
- Cap rate 20.1% vs local median 2.1% in Anaheim — top-decile yield for the area; either an underpriced asset or a hidden risk that comps aren't pricing in. Stress-test before assuming the spread holds.
Location & tenants
- Location reads 70/100 on livability (#240 in CA) — a middle-class / working-renter tenant base. Strengths: amenities A+, commute A+, employment A+; Watch: health & safety C-, crime F, cost of living F.
- Anaheim Elementary (urban): math 25% / reading 25% proficiency, ranked #386 of 517 in CA (top 75%) — low school quality limits family demand, transient renter base, plan for 1-2y turnover; 73% free/reduced lunch — lower-income household profile, screen leases tightly.
- Market conditions: Rents rising fast (+5.1%/yr); 72 active listings in the ZIP; 23 comparable units currently listed for rent nearby; rentals leasing fast (median 0d on market — plan ~1-2 weeks tenant-placement turnaround); solid renter incomes; 6,974 units permitted in Orange County in 2024 (3,839 in 5+ unit buildings).
- At $4,418/mo this rent would consume 63% of the median local household income ($84k/yr) (locally 3604% of renters already pay >50% of income on rent) — very limited rent-growth headroom before tenants either downsize or default.
Forward outlook
- Local home prices are declining (-3.0%/yr); year-one equity from $1k of loan paydown is wiped out by about $6k of value loss. Plan a longer hold.
- Orange County population projected at +14% by 2050 — modest demand growth; plan on rents tracking national, not racing it.
- At projected returns (-3.0% appreciation + 5.1% rent growth), your $53k cash investment doubles in ~3 years — after that, you're playing with house money.
Negotiation context
- It's been on market 62 days — a 6% lower offer ($179k) is reasonable based on typical stale-listing flexibility.
- 3 sale attempts; this cycle's ask has dropped $10k (5%) from the opening price — seller is motivated, your offer sets the floor, not the list.
Risks & watch-outs
- Climate carrying-cost: extreme-heat days projected 7→23/yr by 2055 (HVAC capex compounding) — expect insurance premiums to compound above CPI over the hold.
Questions for the listing agent
- It's been on market 62 days. Have you received any prior offers? Is the seller open to a 6% concession, seller financing, or rate buy-down credit?
- Why hasn't it sold? Are there any deal-killer items the seller is aware of (foundation, flood, title, zoning, code violations)?
- Is there a deadline driving the sale (1031 exchange, divorce, estate, relocation)? That informs how much negotiation room exists.
- Crime grade is F in this area — have there been break-ins, vandalism, or insurance claims at this property in the last 3 years? What carrier currently insures it and at what premium?
- What's the average days-on-market for RENTAL listings here right now (not sales)? A rising rental-DOM trend means longer vacancies and softer asking-rent achievability than the comps imply.
- What's the recent tenant-quality profile in this submarket — average credit score on applications, eviction rate, late-payment / NSF rate, and stable-employment percentage? A property-management company in the area should have these aggregated.
- How much new for-sale + rental construction is in the pipeline within 1–3 miles? Heavy new supply typically softens prices + rents 12–24 months out; constrained supply supports both.
Investment metrics
- 1% rule
- 2.33% ✓
- Cap rate
- 20.06%
- Cash-on-cash
- 49.16%
- DSCR
- 3.19
- GRM
- 3.6
CMA / ARV
- ARV (on-the-fly)
- $274,944
- Comps found
- 2
Show comp detail 2 sales within ~0.75 mi
| Address | Dist | Beds/Ba | Sqft | Sold | Price | $/sf | Match |
|---|---|---|---|---|---|---|---|
| 624 W Romneya Dr | 0.06mi | 3/2.0 (-1) | 1,344 (-12%) | 13mo | $240,000 | $179 | 60 |
| 622 W Romneya Dr #622 | 0.07mi | 3/2.0 (-1) | 1,728 (+12%) | 18mo | $220,000 | $127 | 56 |
Match score weights: distance 35% · size 25% · config 20% · recency 20%. Top-matched comps best support the ARV.
Projected returns pro-forma
-3.0% appreciation · 5.13% rent growth · sell at horizon
- IRR
- 49.2%
- Equity multiple
- 3.21×
- Total profit
- $117,692
- Equity at exit
- $28,315
- IRR
- 55.6%
- Equity multiple
- 7.07×
- Total profit
- $322,837
- Equity at exit
- $16,419
Cash invested: $53,172 (down + closing). Projections, not guarantees.
Landlord ↔ Tenant lean methodology
- Overall (STATE)
- 18 Strongly Tenant-Friendly
- State California
- 18 Strongly Tenant-Friendly · D+13
- County
- — inherits STATE
- City
- — inherits STATE
ZIP-level market 92801
- Rents YoY
- 5.1%
- Active inventory
- 72
- Price-to-rent
- 3.6×
Monthly cashflow live
- Estimated rent
- $4,418 high interval (Pro) →
- Mortgage (P&I)
- −$996
- Tax est. 1.5%
- −$237 /mo · $2,848/yr
- Insurance
- −$79
- HOA
- −$0
- Vacancy / Maint / Mgmt
- −$928
- Net cashflow
- $2,178
Break-even live
Sensitivity live
| Price | -10% $2,309 | -5% $2,244 | +0% $2,178 | +5% $2,113 | +10% $2,047 |
|---|---|---|---|---|---|
| Rent | -10% $1,829 | -5% $2,004 | +0% $2,178 | +5% $2,353 | +10% $2,527 |
| Rate | -1.0pp $2,274 | -0.5pp $2,226 | base $2,178 | +0.5pp $2,129 | +1.0pp $2,079 |
UW: 25.0% down · 7.5% · 30yr · 1.5% tax · 5.0% vac · 8.0% maint · 8.0% mgmt
Financing live
Cash to close
- Down payment
- $47,475
- Closing costs
- $5,697
- Reserves months
- —
- Total cash needed
- —
Loan-product check · same deal, 3 products live
Conventional
25% down · 7.5% · 30yr
- Down + closing
- —
- Monthly P&I
- —
- Monthly cashflow
- —
- DSCR
- —
- Eligible?
- —
Personal DTI + credit; lowest rate.
DSCR
20% down · 8.5% · 30yr
- Down + closing
- —
- Monthly P&I
- —
- Monthly cashflow
- —
- DSCR
- —
- Eligible?
- —
No personal income docs; deal must DSCR.
Hard money
10% down · 12.0% · 12mo
- Down + closing
- —
- Monthly P&I
- —
- Monthly cashflow
- —
- DSCR
- —
- Eligible?
- —
Short-term bridge; refi at stabilization.
Rent comps 23 comps
| Address | Beds | Baths | Sqft | Rent | $/sqft | DOM | Units | Dist |
|---|---|---|---|---|---|---|---|---|
| 1096 N Ivory Palm Ln Anaheim, CA | 3.0 | 2.5 | 1406 | $4,200 | $2.99 | 0d | 1 | 0.11mi |
| 527 W Victor Ave Anaheim, CA | 3.0 | 3.0 | 1420 | $13,200 | $9.30 | 0d | 1 | 0.14mi |
| 1024 W Romneya Dr Anaheim, CA | 2.0–3.0 | 2.0 | 1241 | $4,795 | $3.86 | 0d | 10 | 0.26mi |
| 155 W La Palma Ave #4 Anaheim, CA | 3.0 | 2.5 | 1673 | $4,300 | $2.57 | 0d | 1 | 0.52mi |
| 800 N Janss St Anaheim, CA | 4.0 | 2.0 | 1450 | $4,500 | $3.10 | 0d | 1 | 0.59mi |
| 820 N Justin Pl Anaheim, CA | 5.0 | 3.5 | 2150 | $5,700 | $2.65 | 5d | 1 | 0.76mi |
| 1138 N Euclid St Anaheim, CA | 3.0 | 2.5 | 1492 | $3,750 | $2.51 | 25d | 1 | 0.84mi |
| 1419 W Janeen Way Anaheim, CA | 4.0 | 2.0 | 1932 | $4,760 | $2.46 | 20d | 1 | 0.87mi |
| 1507 S Roosevelt Ave Fullerton, CA | 5.0 | 2.0 | 1600 | $8,500 | $5.31 | 23d | 1 | 0.88mi |
| 604 N Zeyn St Anaheim, CA | 3.0 | 2.0 | 1169 | $3,100 | $2.65 | 0d | 1 | 0.92mi |
| 912 W Hill Ave Fullerton, CA | 4.0 | 3.0 | 1644 | $4,500 | $2.74 | 18d | 1 | 1.04mi |
| 125 W Valencia Dr Unit A Fullerton, CA | 3.0 | 1.0 | 1100 | $3,400 | $3.09 | 0d | 1 | 1.07mi |
| 1124 W Woodcrest Ave Fullerton, CA | 3.0 | 2.0 | 1476 | $4,500 | $3.05 | 0d | 1 | 1.14mi |
| 410 S Lemon St Unit B Fullerton, CA | 4.0 | 1.0 | 1800 | $2,200 | $1.22 | 7d | 1 | 1.20mi |
| 686 S Euclid St Fullerton, CA | 4.0 | 3.5 | 1855 | $4,295 | $2.32 | 0d | 1 | 1.22mi |
| 686 S Euclid St Fullerton, CA | 4.0 | 3.5 | 1855 | $4,295 | $2.32 | 2d | 1 | 1.22mi |
| 465 E Afton Ln Anaheim, CA | 3.0 | 2.5 | 1454 | $3,600 | $2.48 | 5d | 1 | 1.26mi |
| 1406 W Roberta Ave Fullerton, CA | 3.0 | 2.5 | 1750 | $8,250 | $4.71 | 23d | 1 | 1.38mi |
| 600 W Commonwealth Ave Fullerton, CA | 3.0 | 1.0–2.0 | 1002 | $4,562 | $4.55 | 0d | 21 | 1.38mi |
| 1119 W Broadway Anaheim, CA | 3.0 | 2.5 | 1395 | $3,700 | $2.65 | 0d | 1 | 1.42mi |
| 229 E Commonwealth Ave Fullerton, CA | 3.0 | 1.0–3.0 | 1126 | $4,409 | $3.91 | 0d | 9 | 1.42mi |
| 1600 W Lincoln Ave Anaheim, CA | 3.0 | 1.0–2.0 | 1181 | $4,907 | $4.15 | 0d | 21 | 1.44mi |
| 1964 Glenoaks Ave Anaheim, CA | 4.0 | 2.5 | 1440 | $3,575 | $2.48 | 16d | 1 | 1.46mi |
Listing history 20 events
-
2026-06-21days on market $189,900 Active 62 DOM
-
2026-06-18days on market $189,900 Active 59 DOM
-
2026-06-17days on market $189,900 Active 58 DOM
-
2026-06-16days on market $189,900 Active 57 DOM
-
2026-06-15days on market $189,900 Active 56 DOM
-
2026-06-13days on market $189,900 Active 54 DOM
-
2026-06-13days on market $189,900 Active 53 DOM
-
2026-06-09days on market $189,900 Active 50 DOM
-
2026-06-08days on market $189,900 Active 49 DOM
-
2026-06-07remarks 699-char remark
-
2026-06-07pricedays on market $189,900 Active 48 DOM
-
2026-06-04days on market $228,888 Active 45 DOM
-
2026-06-03days on market $228,888 Active 44 DOM
-
2026-06-02days on market $228,888 Active 43 DOM
-
2026-06-01days on market $228,888 Active 42 DOM
-
2026-05-31days on market $228,888 Active 41 DOM
-
2026-05-08status Active
-
2026-03-24price $228,888
-
2026-03-21status Active
-
2026-03-05$200,000 Active
ⓘ Source: listings_history table (triggers on properties + properties_extension) + one-shot
backfill from property_details.listing_events for pre-trigger history.
Climate risk First Street
- Flood 1/10 Low FEMA zone X (shaded) · 0% chance over 30 yrs
- Wildfire 1/10 Low
- Heat 6/10 Major 7 d/yr ≥92°F today · 23 d/yr by 30 yrs out
- Wind 1/10 Low
- Air quality 5/10 Major 7 unhealthy d/yr today · 9 by 30 yrs out
Nearby sold comps map
Loading sold comps map…
Walkable amenities ~0.75 mi
Loading nearby amenities…
Taxation est. · year 1
- Rental income
- $53,020
- − Mortgage interest
- −$10,637
- − Property taxes
- −$2,848
- − Insurance
- −$950
- − Repairs & maintenance
- −$4,242
- − Management
- −$4,242
- − Depreciation
- −$5,524
- Taxable income
- $24,577
- Est. tax owed @ 24.0%
- −$5,899
- After-tax cash flow
- $20,239/yr
For passive investors: Depreciation is non-cash, so a rental often shows a tax loss while cash-flowing — sheltering income. Rental losses are passive: they offset passive income freely, and up to $25,000/yr can offset ordinary (W-2) income if you actively participate and your MAGI is under $100k (phasing out to $0 by $150k); unused losses carry forward. On sale, claimed depreciation is recaptured at up to 25%, and gains may owe capital-gains tax (a 1031 exchange can defer both). Figures are a year-1 estimate at your 24.0% rate — not tax advice; consult a CPA.
Schools (NCES district)
- District
- Anaheim Elementary
- NCES district ID
- 0602610
- Math proficiency
- 25% ▼ -3.00%
- Reading proficiency
- 25% ▼ -9.00%
- Median HH income
- $55,235
- Composite
- 22.56/100
- National rank
- #8078
- State rank
- #386 of 517 in CA
Livability — Anaheim
- Score
- 70/100
- State rank
- #240
- US rank
- #7861
Category grades
Schools grade is shown separately in the Schools card above.
Census & demographics
- Census place
- Anaheim, CA
- County
- Orange County · 3,096,323 people
- City population
- 361,715
- Metro
- Los Angeles-Long Beach-Anaheim, CA
- Population (ZIP)
- 60,547
- Household income
- $83,725
- Rent vs Own
- Severe rent burden
- 3604.0
Population outlook (Orange County) Hauer SSP2
- Today (2025)
- 3,477,456 people
- By 2030
- 3,613,117 · +3.9%
- By 2040
- 3,835,945 · +10.3%
- By 2050
- 3,968,736 · +14.1%
- By 2075
- 4,097,053 · +17.8%
- By 2100
- 3,903,633 · +12.3%
Race, ethnicity, and origin ACS 2023
- Neighborhood character
- Diverse neighborhood (Simpson 0.59)
- Race & ethnicity
- Hispanic / Latino 59% Two or more races 19% Asian 19% White 16% Black 4%
- Hispanic origin (detail)
- Mexican 50%
- Common ancestry
- Russian 1% Lithuanian 1%
- Foreign-born
- 41% · Canada, Vietnam, South Korea
- Languages at home
- 30% English-only · Spanish 48% Tagalog/Filipino 5% Vietnamese 5%
Political lean MEDSL · Orange
- 2024 margin
- Toss-up / Even · D 49.7% · R 47.1% · Other 3.2%
- 2008→2024 swing
- +5.2pp toward D · 2008: -2.6pp · 2024: 2.6pp
- All cycles
- 2024: D+2.6 2020: D+9.0 2016: D+7.7 2012: R+8.3 2008: R+2.6
Not yet ingested
- Civics
- —
Market trends
- HPI YoY
- ▼ -723.92%
- Current HPI
- 446.9118
- Rent YoY
- ▲ 5.13%
- Metro
- Los Angeles-Long Beach-Anaheim, CA
- State GDP YoY
- ▲ 3.21%
- F500 in state
- 116
Industry mix (Fortune 500 HQ in CA)
| Industry | F500 HQs | Revenue |
|---|---|---|
| Technology | 27 | $1,492B |
|
||
| Financial Services | 3 | $174B |
|
||
| Retail | 3 | $44B |
|
||
| Insurance | 3 | $26B |
|
||
| Media / Entertainment | 2 | $115B |
|
||
| Pharmaceuticals / Biotech | 2 | $62B |
|
||
Price history
+14.4% since first listed4 events — show timeline
- 2026-05-08 Relisted — CRMLS
- 2026-03-24 Price Changed $228,888 CRMLS
- 2026-03-21 Relisted — CRMLS
- 2026-03-05 Listed $200,000 CRMLS
Property tax history
-12.7%/yrLatest (2025): $22 · +3.4% YoY. Source: county tax records.
Cash-flow waterfall
monthlySold comps — $/sqft
last 12 mo · ≤1 miLoading sold comps…