 Multi-family
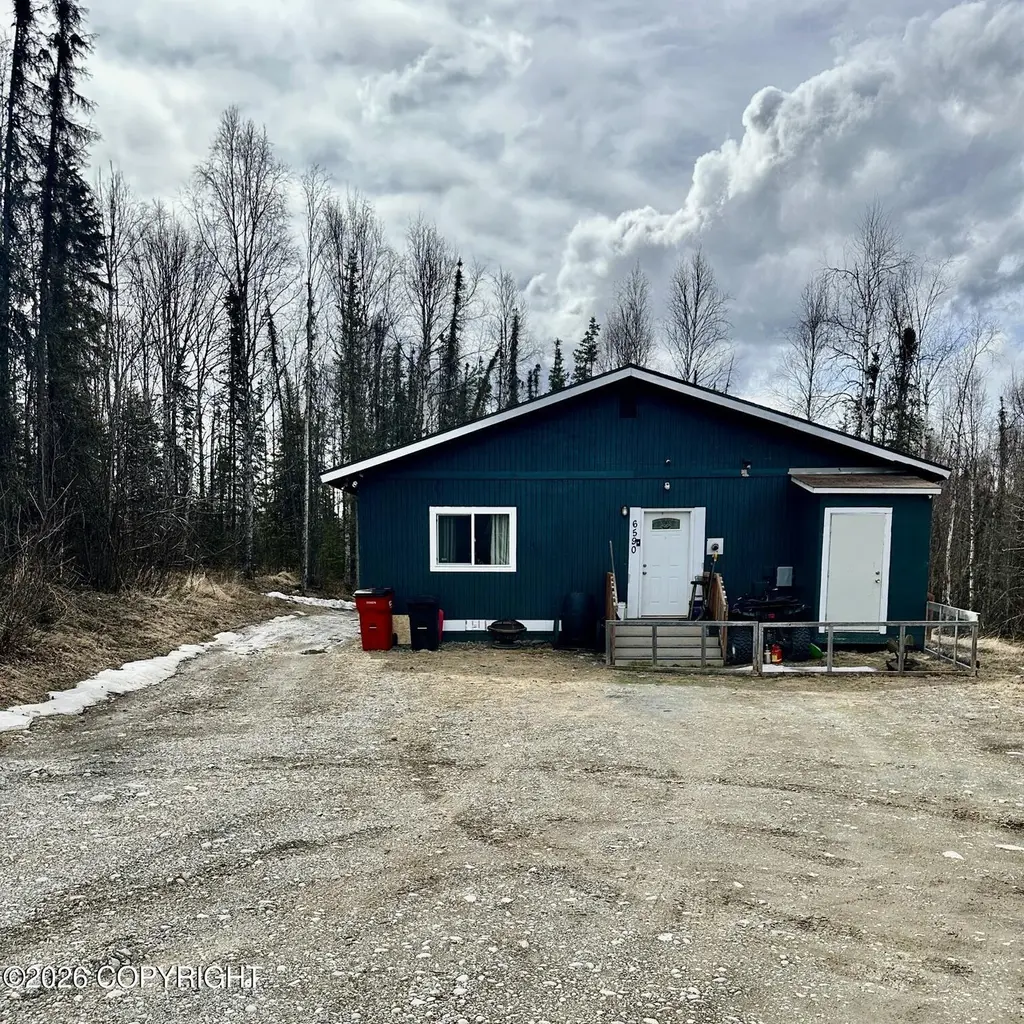
6590 W Yeomen Dr · Meadow Lakes, AK
Flood risk 1/10 · Minimal
- FEMA flood zone
- X (unshaded)
- Chance of flooding over 30 yrs
- 0.0%
- Est. flood insurance / yr
- $473 – $860
Fire risk No data
- Est. fire insurance / yr
- —
Heat risk No data
- Hot days now (above threshold)
- —
- Hot days in 30 yrs
- —
Wind risk No data
- Chance of severe wind over 30 yrs
- —
Air-quality risk 1/10 · Minimal
- Unhealthy air days now
- —
- Unhealthy air days in 30 yrs
- —
Risk factors via First Street. Map © Google.
Why this score? — see what drove the B grade
The composite is a weighted blend of 9 inputs, each scored 0–100. Each bar is that input's sub-score; the figure is the points it added to the 100-point composite (weight × sub-score).
- Cash flow +29.2/30.0
- ARV discount +15.0/15.0
- DSCR +10.0/10.0
- 1% rule +8.0/10.0
- Schools +4.1/10.0
- Rent growth +3.3/5.0
- Livability +2.7/5.0
- Condition / age +2.5/5.0
- Appreciation +0.0/10.0
$259,000
🖨 Deal sheet 📄 Offer letter ✓ Due diligence
Multi-family units
County records classify this as Multi-Family (2-4 Unit). Listing-text estimate: 1 unit. estimate disagrees with records
Listing remarks
Investment property- put your sweat equity in! Live and rent, or rent both sides. Only one meter for both units. 2 bed 1 bath each unit. Front unit has been updated, back unit needs work. Cash or possible rehab loan. Buyer to verify. End of road, private lot, plenty of parking for toys, boat, RV. New roof last year.
Key facts
- Private lot
- Plenty of parking
- New roof
Tags
Property features AI
Exterior
- Parking: 10 open parking spaces; No garage or carport
- Utilities: Septic tank sewer
- Home design: Multi-Family property; Built in 1993
- Construction: Wood frame (2x6) construction; Foundation: Unknown - BTV
- Exterior features: Shingle (asphalt) roof; 1.0-acre lot
Interior
- Bedrooms: 4 bedrooms
- Bathrooms: 2 full bathrooms
- Interior features: Multi-family layout
Neighborhood map
What this means for you Summary
Snapshot
- This is a 4-bed/2.0-bath multifamily listed at $259k.
Deal economics
- At list price, monthly cash flow is $906 ($11k/yr) — positive.
- The deal already cash-flows at list — no discount required.
- Meets the 1% rule at list price ($3k rent vs $259k).
- Recommended offer: $251k (3.0% below list) — sets the bar for market timing.
- Cap rate 10.5% vs local median 3.2% in Meadow Lakes — top-decile yield for the area; either an underpriced asset or a hidden risk that comps aren't pricing in. Stress-test before assuming the spread holds.
Location & tenants
- Location reads 53/100 on livability (#187 in AK) — a working-class tenant base; expect higher turnover. Strengths: housing A+; Watch: health & safety C-, schools F, crime F.
- Matanuska-Susitna Borough School District (town): math 42% / reading 50% proficiency, ranked #5 of 21 in AK (top 24%) — families likely to look elsewhere, expect single-tenant / working-renter base with shorter leases.
- Market conditions: Rents rising (+3.2%/yr); 414 active listings in the ZIP; solid renter incomes; 91 units permitted in Matanuska-Susitna Borough in 2024 (25 in 5+ unit buildings).
- At $3,357/mo this rent would consume 45% of the median local household income ($89k/yr) (locally 285% of renters already pay >50% of income on rent) — very limited rent-growth headroom before tenants either downsize or default.
Forward outlook
- Local home prices are declining (-3.0%/yr); year-one equity from $2k of loan paydown is wiped out by about $8k of value loss. Plan a longer hold.
- Matanuska-Susitna County population projected at +50% by 2050 — long-run rental-demand tailwind backs the buy-and-hold thesis.
- At projected returns (-3.0% appreciation + 3.2% rent growth), your $73k cash investment doubles in ~8 years — after that, you're playing with house money.
Negotiation context
- It's been on market 31 days — a 3% lower offer ($251k) is reasonable based on typical stale-listing flexibility.
- 4 sale attempts since 12y ago with the ask held roughly flat each time — persistent listings suggest the price (not the market) is what's stuck; bring a comps-based counter.
Questions for the listing agent
- It's been on market 31 days. Have you received any prior offers? Is the seller open to a 3% concession, seller financing, or rate buy-down credit?
- Is there a deadline driving the sale (1031 exchange, divorce, estate, relocation)? That informs how much negotiation room exists.
- Schools are F-rated, which usually means shorter tenancies and higher turnover. Who's the typical renter profile here, and what's been the actual vacancy rate?
- Crime grade is F in this area — have there been break-ins, vandalism, or insurance claims at this property in the last 3 years? What carrier currently insures it and at what premium?
- What's the average days-on-market for RENTAL listings here right now (not sales)? A rising rental-DOM trend means longer vacancies and softer asking-rent achievability than the comps imply.
- What's the recent tenant-quality profile in this submarket — average credit score on applications, eviction rate, late-payment / NSF rate, and stable-employment percentage? A property-management company in the area should have these aggregated.
- How much new apartment / multifamily construction is in the pipeline within 1–3 miles? Heavy new supply (>2% of stock underway) typically softens rents 12–24 months out; light construction supports rent growth.
Investment metrics
- 1% rule
- 1.30% ✓
- Cap rate
- 10.49%
- Cash-on-cash
- 14.98%
- DSCR
- 1.67
- GRM
- 6.4
CMA / ARV
- ARV (on-the-fly)
- $448,800
- Comps found
- 1
Show comp detail 1 sale within ~0.75 mi
| Address | Dist | Beds/Ba | Sqft | Sold | Price | $/sf | Match |
|---|---|---|---|---|---|---|---|
| 6380 W Locksley Loop | 0.21mi | 4/2.0 | 1,700 (+4%) | 1mo | $466,900 | $275 | 83 |
Match score weights: distance 35% · size 25% · config 20% · recency 20%. Top-matched comps best support the ARV.
Projected returns pro-forma
-3.0% appreciation · 3.17% rent growth · sell at horizon
- IRR
- 5.8%
- Equity multiple
- 1.22×
- Total profit
- $16,305
- Equity at exit
- $38,618
- IRR
- 15.3%
- Equity multiple
- 2.25×
- Total profit
- $90,929
- Equity at exit
- $22,394
Cash invested: $72,520 (down + closing). Projections, not guarantees.
Landlord ↔ Tenant lean methodology
- Overall (STATE)
- 80 Strongly Landlord-Friendly
- State Alaska
- 80 Strongly Landlord-Friendly · R+8
- County
- — inherits STATE
- City
- — inherits STATE
ZIP-level market 99623
- Home prices YoY
- -19.6%
- Rents YoY
- 3.2%
- Active inventory
- 414
- Price-to-rent
- 12.9×
Monthly cashflow live
- Estimated rent
- $3,357 medium interval (Pro) →
- Mortgage (P&I)
- −$1,358
- Tax from tax record
- −$280 /mo · $3,364/yr
- Insurance
- −$108
- HOA
- −$0
- Vacancy / Maint / Mgmt
- −$705
- Net cashflow
- $906
Break-even live
2-unit breakdown (identical units grouped — click to expand)
| Units | Beds | Baths | Est. rent |
|---|---|---|---|
| 2× units | 2 | 1 | $3,356 |
| #1 | 2 | 1 | $1,678 |
| #2 | 2 | 1 | $1,678 |
| Total (2 units) | $3,357 | ||
UW: 25.0% down · 7.5% · 30yr · 1.5% tax · 5.0% vac · 8.0% maint · 8.0% mgmt
Financing live
Cash to close
- Down payment
- $64,750
- Closing costs
- $7,770
- Reserves months
- —
- Total cash needed
- —
Loan-product check · same deal, 3 products live
Conventional
25% down · 7.5% · 30yr
- Down + closing
- —
- Monthly P&I
- —
- Monthly cashflow
- —
- DSCR
- —
- Eligible?
- —
Personal DTI + credit; lowest rate.
DSCR
20% down · 8.5% · 30yr
- Down + closing
- —
- Monthly P&I
- —
- Monthly cashflow
- —
- DSCR
- —
- Eligible?
- —
No personal income docs; deal must DSCR.
Hard money
10% down · 12.0% · 12mo
- Down + closing
- —
- Monthly P&I
- —
- Monthly cashflow
- —
- DSCR
- —
- Eligible?
- —
Short-term bridge; refi at stabilization.
Listing history 21 events
-
2026-06-18days on market $259,000 Active 31 DOM
-
2026-06-17days on market $259,000 Active 30 DOM
-
2026-06-16days on market $259,000 Active 29 DOM
-
2026-06-15days on market $259,000 Active 28 DOM
-
2026-06-14days on market $259,000 Active 26 DOM
-
2026-06-13days on market $259,000 Active 25 DOM
-
2026-06-10days on market $259,000 Active 23 DOM
-
2026-06-09days on market $259,000 Active 22 DOM
-
2026-06-08days on market $259,000 Active 21 DOM
-
2026-06-07days on market $259,000 Active 20 DOM
-
2026-06-03days on market $259,000 Active 16 DOM
-
2026-06-02days on market $259,000 Active 15 DOM
-
2026-06-01days on market $259,000 Active 14 DOM
-
2026-05-31days on market $259,000 Active 13 DOM
-
2026-05-30days on market $259,000 Active 12 DOM
-
2026-05-18$259,000 Active
-
2018-08-31soldstatus
-
2018-05-20$165,000
-
2017-09-27soldstatus
-
2016-06-03$35,000
-
2014-06-12$35,000
ⓘ Source: listings_history table (triggers on properties + properties_extension) + one-shot
backfill from property_details.listing_events for pre-trigger history.
Tax reassessment forecast AK · Partial reset (capped growth)
- Current annual tax
- $3,364 · $280/mo
- Projected year-2 tax
- $3,364 · $280/mo
- Expected delta
- $0/yr ($0/mo · 0.0%)
ⓘ Screening estimate from a state-policy table — verify with the county assessor before closing.
Climate risk First Street
- Flood 1/10 Low FEMA zone X (unshaded) · 0% chance over 30 yrs
- Air quality 1/10 Low
Nearby sold comps map
Loading sold comps map…
Walkable amenities ~0.75 mi
Loading nearby amenities…
Taxation est. · year 1
- Rental income
- $40,284
- − Mortgage interest
- −$14,508
- − Property taxes
- −$3,364
- − Insurance
- −$1,295
- − Repairs & maintenance
- −$3,223
- − Management
- −$3,223
- − Depreciation
- −$7,535
- Taxable income
- $7,137
- Est. tax owed @ 24.0%
- −$1,713
- After-tax cash flow
- $9,154/yr
For passive investors: Depreciation is non-cash, so a rental often shows a tax loss while cash-flowing — sheltering income. Rental losses are passive: they offset passive income freely, and up to $25,000/yr can offset ordinary (W-2) income if you actively participate and your MAGI is under $100k (phasing out to $0 by $150k); unused losses carry forward. On sale, claimed depreciation is recaptured at up to 25%, and gains may owe capital-gains tax (a 1031 exchange can defer both). Figures are a year-1 estimate at your 24.0% rate — not tax advice; consult a CPA.
Schools (NCES district)
- District
- Matanuska-Susitna Borough School District
- NCES district ID
- 0200510
- Math proficiency
- 42% ▲ 1.00%
- Reading proficiency
- 50% ▲ 5.00%
- Median HH income
- $70,325
- Composite
- 41.38/100
- National rank
- #3484
- State rank
- #5 of 21 in AK
Livability — Meadow Lakes
- Score
- 53/100
- State rank
- #187
- US rank
- #24629
Category grades
Schools grade is shown separately in the Schools card above.
Census & demographics
- Census place
- Meadow Lakes, AK
- County
- Matanuska Susitna Borough · 100,174 people
- City population
- 23,424
- Metro
- Anchorage, AK
- Population (ZIP)
- 23,424
- Household income
- $88,799
- Rent vs Own
- Severe rent burden
- 285.0
Population outlook (Matanuska-Susitna County) Hauer SSP2
- Today (2025)
- 126,730 people
- By 2030
- 139,641 · +10.2%
- By 2040
- 165,122 · +30.3%
- By 2050
- 189,697 · +49.7%
- By 2075
- 249,959 · +97.2%
- By 2100
- 288,077 · +127.3%
Race, ethnicity, and origin ACS 2023
- Neighborhood character
- Predominantly White (75%)
- Race & ethnicity
- White 75% Two or more races 10% Native American 8% Hispanic / Latino 4% Asian 3% Black 2%
- Common ancestry
- Portuguese 3% Romanian 2% Italian 2%
- Foreign-born
- 3% · Canada
- Languages at home
- 94% English-only · Spanish 2% Russian/Polish/Slavic 2% Other Asian/Pacific 1%
Political lean MEDSL · Matanuska-Susitna
- 2016 margin
- R (+15.2) · D 37.7% · R 52.9% · Other 9.4%
- All cycles
- 2016: R+15.2
Not yet ingested
- Civics
- —
Market trends
- HPI YoY
- ▼ -48.82%
- Current HPI
- 200.2242
- Rent YoY
- ▲ 3.17%
- Metro
- Anchorage, AK
- State GDP YoY
- —
- F500 in state
- 0
Price history
+640.0% since first listed6 events — show timeline
- 2026-05-18 Listed $259,000 AKMLS
- 2018-08-31 Sold (Public Records) — Public Records
- 2018-05-20 Listed $165,000 AKMLS
- 2017-09-27 Sold (Public Records) — Public Records
- 2016-06-03 Listed $35,000 AKMLS
- 2014-06-12 Listed $35,000 AKMLS
Property tax history
+21.8%/yrLatest (2025): $3,364 · +0.7% YoY. Source: county tax records.
Cash-flow waterfall
monthlySold comps — $/sqft
last 12 mo · ≤1 miLoading sold comps…