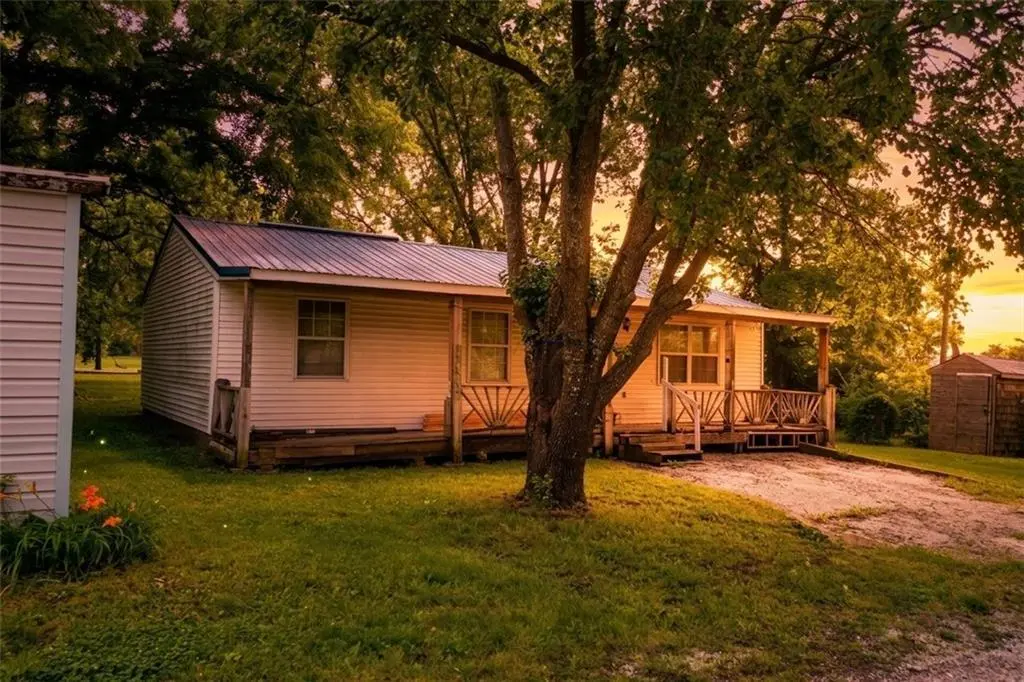
33466 W 160th St · Vibbard, MO
Flood risk 1/10 · Minimal
- FEMA flood zone
- X (unshaded)
- Chance of flooding over 30 yrs
- 0.0%
- Est. flood insurance / yr
- $507 – $1,088
Fire risk 3/10 · Minor
- Est. fire insurance / yr
- $1,054 – $1,958
Heat risk 4/10 · Minor
- Hot days now (above 107°F)
- 7 days/yr
- Hot days in 30 yrs
- 16 days/yr
Wind risk 2/10 · Minimal
- Chance of severe wind over 30 yrs
- —
Air-quality risk 3/10 · Minor
- Unhealthy air days now
- 2 days/yr
- Unhealthy air days in 30 yrs
- 3 days/yr
Risk factors via First Street. Map © Google.
Why this score? — see what drove the C- grade
The composite is a weighted blend of 9 inputs, each scored 0–100. Each bar is that input's sub-score; the figure is the points it added to the 100-point composite (weight × sub-score).
- Cash flow +18.9/30.0
- ARV discount +15.0/15.0
- DSCR +6.0/10.0
- 1% rule +4.2/10.0
- Schools +2.9/10.0
- Rent growth +2.5/5.0
- Livability +2.5/5.0
- Condition / age +2.5/5.0
- Appreciation +0.0/10.0
$130,000
🖨 Deal sheet (PDF) 📄 Offer letter ✓ Due diligence
Listing remarks
Welcome to Lawson, MO—a fantastic, tight-knit community known for its small town feel. Lawson Address and Excelsior Springs Schools. This 3-bedroom, 1-bathroom property is hitting the market for the very first time. As a one-owner home, it has great bones and a solid history, and is just waiting for its next owner to bring their vision and give it a little TLC. * BUYER'S AGENT TO VERIFY AND DEEM INFORMATION ACCURATE. * Offered at an unbeatable listing price, this is the absolute perfect opportunity for a first-time homebuyer looking to build sweat equity, or an investor wanting a solid project in a highly desirable town. Bring your creativity and transform this loved property into
Key facts
- 0.9 acre lot
- 2 garage spots
- Built 1965
Property features AI
Finance
- HOA & community: No association fees
Exterior
- Parking: Detached 2-car garage
- Utilities: Public water; Septic tank
- Home design: Single family residence; Ranch floor plan; Residential property
- Construction: Board & batten siding; Composition roof; Built approximately 51–75 years ago
- Exterior features: Covered patio; Acreage lot with level terrain and wooded areas; Public road maintenance
Interior
- Kitchen: Kitchen integrated with dining area
- Bedrooms: 3 bedrooms
- Flooring: Carpet; Vinyl
- Bathrooms: 1 full bathroom
- Heating & cooling: Electric cooling; Other heating
- Interior features: Kitchen and dining combined (kit/dining combo); Crawl space basement
- Laundry & utility: Laundry located on the main level in the bathroom
Neighborhood map
What this means for you Summary
Snapshot
- This is a 3-bed/1.0-bath single-family listed at $130k.
Deal economics
- At list price, monthly cash flow is $134 ($2k/yr) — positive.
- The deal already cash-flows at list — no discount required.
- To meet the 1% rule (rent ≥ 1% of price), the offer needs to be $119k (8.3% below list).
- Recommended offer: $119k (8.3% below list) — sets the bar for 1% rule.
Location & tenants
- Location reads: area grade C — affects rentability + tenant quality, not the cash-flow math above.
- Excelsior Springs 40 (town): math 27% / reading 40% proficiency, ranked #225 of 324 in MO (top 69%) — families likely to look elsewhere, expect single-tenant / working-renter base with shorter leases.
- Zoned schools: Elkhorn Elementary (math 47% / reading 52%, grade D, #284 of 1,115 statewide, top 30%, 207 students, 47% FRL); Excelsior Springs Middle (math 21% / reading 33%, grade F, #306 of 391 statewide, top 80%, 576 students, 51% FRL); Excelsior Springs High (math 12% / reading 62%, grade F, #291 of 521 statewide, top 60%, 787 students, 37% FRL).
- Market conditions: 63 active listings in the ZIP; 56 units permitted in Ray County in 2024 (0 in 5+ unit buildings).
Forward outlook
- Local home prices are declining (-3.0%/yr); year-one equity from $899 of loan paydown is wiped out by about $4k of value loss. Plan a longer hold.
- Ray County population projected at -23% by 2050 — secular population decline; favor cash flow + early exit over multi-decade hold.
Negotiation context
- Only 5 days on market — expect competitive offers; lowballing is unlikely to land.
Questions for the listing agent
- Built in 1965 — when were the roof, HVAC, electrical panel, plumbing, and water heater last replaced?
- Is there a deadline driving the sale (1031 exchange, divorce, estate, relocation)? That informs how much negotiation room exists.
- What's the average days-on-market for RENTAL listings here right now (not sales)? A rising rental-DOM trend means longer vacancies and softer asking-rent achievability than the comps imply.
- What's the recent tenant-quality profile in this submarket — average credit score on applications, eviction rate, late-payment / NSF rate, and stable-employment percentage? A property-management company in the area should have these aggregated.
- How much new for-sale + rental construction is in the pipeline within 1–3 miles? Heavy new supply typically softens prices + rents 12–24 months out; constrained supply supports both.
Investment metrics
- 1% rule
- 0.92% ✗
- Cap rate
- 7.53%
- Cash-on-cash
- 4.43%
- DSCR
- 1.20
- GRM
- 9.1
CMA / ARV
- ARV (on-the-fly)
- $172,692
- Comps found
- 2
Show comp detail 2 sales within ~0.75 mi
| Address | Dist | Beds/Ba | Sqft | Sold | Price | $/sf | Match |
|---|---|---|---|---|---|---|---|
| 16204 W 162nd St | 0.37mi | 2/1.0 (-1) | 1,141 (+7%) | 4mo | $185,000 | $162 | 62 |
| 33868 W 160th St | 0.56mi | 2/1.0 (-1) | 960 (-10%) | 14mo | $80,000 | $83 | 40 |
Match score weights: distance 35% · size 25% · config 20% · recency 20%. Top-matched comps best support the ARV.
Projected returns pro-forma
-3.0% appreciation · 3.0% rent growth · sell at horizon
- IRR
- -9.4%
- Equity multiple
- 0.66×
- Total profit
- $-12,545
- Equity at exit
- $19,383
- IRR
- -0.0%
- Equity multiple
- 1.00×
- Total profit
- $-57
- Equity at exit
- $11,240
Cash invested: $36,400 (down + closing). Projections, not guarantees.
Landlord ↔ Tenant lean methodology
- Overall (STATE)
- 81 Strongly Landlord-Friendly
- State Missouri
- 81 Strongly Landlord-Friendly · R+10
- County
- — inherits STATE
- City
- — inherits STATE
ZIP-level market 64062
- Home prices YoY
- -6.1%
- Active inventory
- 63
- Price-to-rent
- 9.1×
Monthly cashflow live
- Estimated rent
- $1,192 medium interval (Pro) →
- Mortgage (P&I)
- −$682
- Tax from tax record
- −$71 /mo · $857/yr
- Insurance
- −$54
- HOA
- −$0
- Vacancy / Maint / Mgmt
- −$250
- Net cashflow
- $134
Break-even live
Sensitivity live
| Price | -10% $208 | -5% $171 | +0% $134 | +5% $98 | +10% $61 |
|---|---|---|---|---|---|
| Rent | -10% $40 | -5% $87 | +0% $134 | +5% $181 | +10% $229 |
| Rate | -1.0pp $200 | -0.5pp $167 | base $134 | +0.5pp $101 | +1.0pp $66 |
UW: 25.0% down · 7.5% · 30yr · 1.5% tax · 5.0% vac · 8.0% maint · 8.0% mgmt
Financing live
Cash to close
- Down payment
- $32,500
- Closing costs
- $3,900
- Reserves months
- —
- Total cash needed
- —
Loan-product check · same deal, 3 products live
Conventional
25% down · 7.5% · 30yr
- Down + closing
- —
- Monthly P&I
- —
- Monthly cashflow
- —
- DSCR
- —
- Eligible?
- —
Personal DTI + credit; lowest rate.
DSCR
20% down · 8.5% · 30yr
- Down + closing
- —
- Monthly P&I
- —
- Monthly cashflow
- —
- DSCR
- —
- Eligible?
- —
No personal income docs; deal must DSCR.
Hard money
10% down · 12.0% · 12mo
- Down + closing
- —
- Monthly P&I
- —
- Monthly cashflow
- —
- DSCR
- —
- Eligible?
- —
Short-term bridge; refi at stabilization.
Listing history 4 events
-
2026-06-21days on market $130,000 Active 5 DOM
-
2026-06-18days on market $130,000 Active 2 DOM
-
2026-06-17remarks 693-char remark
-
2026-06-17$130,000 Active 1 DOM
ⓘ Source: listings_history table (triggers on properties + properties_extension) + one-shot
backfill from property_details.listing_events for pre-trigger history.
Tax reassessment forecast MO · Resets to sale price
- Current annual tax
- $857 · $71/mo
- Projected year-2 tax
- $1,261 · $105/mo
- Expected delta
- +$404/yr (+$34/mo · 47.1%)
ⓘ Screening estimate from a state-policy table — verify with the county assessor before closing.
Climate risk First Street
- Flood 1/10 Low FEMA zone X (unshaded) · 0% chance over 30 yrs
- Wildfire 3/10 Moderate
- Heat 4/10 Moderate 7 d/yr ≥107°F today · 16 d/yr by 30 yrs out
- Wind 2/10 Low
- Air quality 3/10 Moderate 2 unhealthy d/yr today · 3 by 30 yrs out
Nearby sold comps map
Loading sold comps map…
Walkable amenities ~0.75 mi
Loading nearby amenities…
Taxation est. · year 1
- Rental income
- $14,305
- − Mortgage interest
- −$7,282
- − Property taxes
- −$857
- − Insurance
- −$650
- − Repairs & maintenance
- −$1,144
- − Management
- −$1,144
- − Depreciation
- −$3,782
- Taxable loss
- −$555
- Est. tax savings @ 24.0%
- +$133
- After-tax cash flow
- $1,746/yr
For passive investors: Depreciation is non-cash, so a rental often shows a tax loss while cash-flowing — sheltering income. Rental losses are passive: they offset passive income freely, and up to $25,000/yr can offset ordinary (W-2) income if you actively participate and your MAGI is under $100k (phasing out to $0 by $150k); unused losses carry forward. On sale, claimed depreciation is recaptured at up to 25%, and gains may owe capital-gains tax (a 1031 exchange can defer both). Figures are a year-1 estimate at your 24.0% rate — not tax advice; consult a CPA.
Schools (NCES district)
- District
- Excelsior Springs 40
- NCES district ID
- 2911650
- Math proficiency
- 27% ▼ -6.00%
- Reading proficiency
- 40% ▼ -1.00%
- Median HH income
- $52,747
- Composite
- 29.32/100
- National rank
- #6548
- State rank
- #225 of 324 in MO
Livability — Vibbard
No livability data for this city. (Only ~50 U.S. cities are tracked.)
Census & demographics
- Census place
- Vibbard, MO
- Population (ZIP)
- 6,752
Population outlook (Ray County) Hauer SSP2
- Today (2025)
- 21,420 people
- By 2030
- 20,507 · -4.3%
- By 2040
- 18,550 · -13.4%
- By 2050
- 16,516 · -22.9%
- By 2075
- 12,899 · -39.8%
- By 2100
- 10,413 · -51.4%
Race, ethnicity, and origin ACS 2023
- Neighborhood character
- Predominantly White (96%)
- Race & ethnicity
- White 96% Two or more races 3% Hispanic / Latino 2%
- Common ancestry
- Lithuanian 3% Slovak 3% Portuguese 2%
- Foreign-born
- 0%
- Languages at home
- 99% English-only · Spanish 1%
Political lean MEDSL · Ray
- 2024 margin
- Solid R (+48.7) · D 25.1% · R 73.8% · Other 1.1%
- 2008→2024 swing
- -45.5pp toward R · 2008: -3.2pp · 2024: -48.7pp
- All cycles
- 2024: R+48.7 2020: R+45.0 2016: R+37.1 2012: R+14.9 2008: R+3.2
Not yet ingested
- Civics
- —
Market trends
- HPI YoY
- ▼ -21.03%
- Current HPI
- 323.5321
- Rent YoY
- —
- Metro
- —
- State GDP YoY
- ▲ 1.84%
- F500 in state
- 20
Industry mix (Fortune 500 HQ in MO)
| Industry | F500 HQs | Revenue |
|---|---|---|
| Healthcare | 1 | $163B |
|
||
| Insurance | 1 | $21B |
|
||
| Industrial Technology | 1 | $17B |
|
||
| Retail | 1 | $16B |
|
||
| Industrial Distribution | 1 | $10B |
|
||
| Utilities | 1 | $9B |
|
||
Price history
1 event — show timeline
- 2026-06-16 Listed $130,000 Heartland MLS as Distributed by MLS Grid
Property tax history
+2.8%/yrLatest (2025): $857 · +4.3% YoY. Source: county tax records.
Cash-flow waterfall
monthlySold comps — $/sqft
last 12 mo · ≤1 miLoading sold comps…