 Multi-family
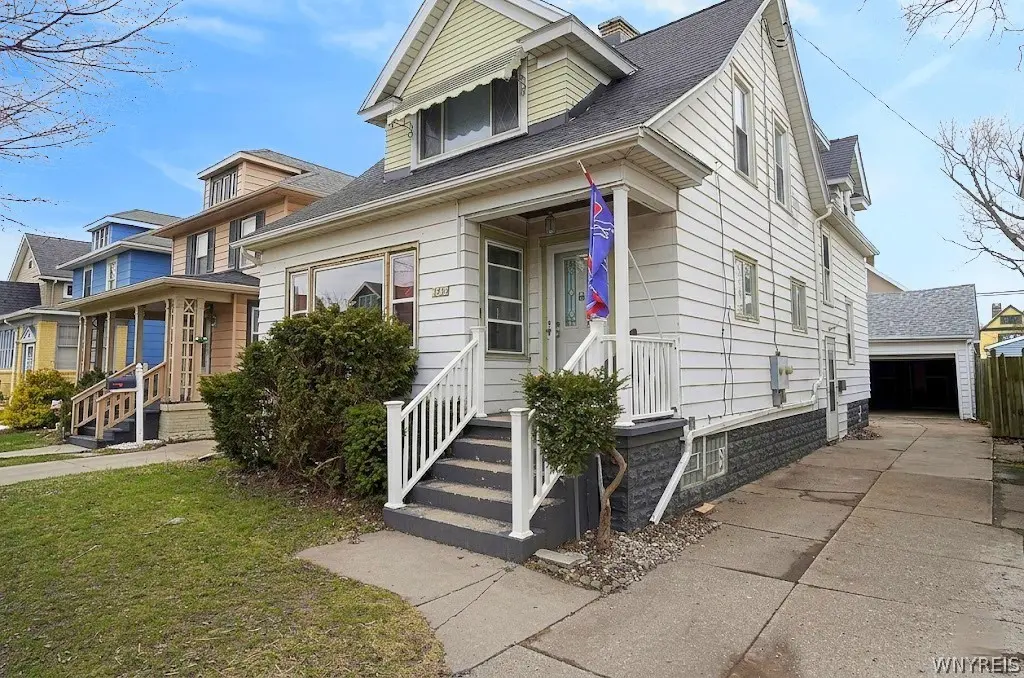
138 E Hazeltine Ave · Kenmore, NY
Flood risk 1/10 · Minimal
- FEMA flood zone
- X (unshaded)
- Chance of flooding over 30 yrs
- 0.0%
- Est. flood insurance / yr
- $473 – $860
Fire risk 1/10 · Minimal
- Est. fire insurance / yr
- $691 – $1,283
Heat risk 3/10 · Minor
- Hot days now (above 92°F)
- 7 days/yr
- Hot days in 30 yrs
- 15 days/yr
Wind risk 1/10 · Minimal
- Chance of severe wind over 30 yrs
- —
Air-quality risk 3/10 · Minor
- Unhealthy air days now
- 3 days/yr
- Unhealthy air days in 30 yrs
- 4 days/yr
Risk factors via First Street. Map © Google.
Why this score? — see what drove the D grade
The composite is a weighted blend of 9 inputs, each scored 0–100. Each bar is that input's sub-score; the figure is the points it added to the 100-point composite (weight × sub-score).
- ARV discount +15.0/15.0
- Cash flow +8.3/30.0
- Rent growth +4.9/5.0
- Livability +4.0/5.0
- Schools +3.9/10.0
- 1% rule +3.7/10.0
- Condition / age +2.5/5.0
- DSCR +2.2/10.0
- Appreciation +0.0/10.0
$305,000
🖨 Deal sheet (PDF) 📄 Offer letter ✓ Due diligence
Multi-family units
County records classify this as Multi-Family (2-4 Unit). Listing-text estimate: 1 unit. estimate disagrees with records
Listing remarks MLS
Looking for a great owner-occupied opportunity or to expand your investment portfolio? 138 E Hazeltine may be for you! As you enter you will see some updates and fresh painted room waiting for you. This gem in the heart of the village gives you a great local to everything you would need. Each apartment has 2 generously sized rooms with 1 bath. The house high lights include a 2-car garage, an updates roof in 26, hard wood floors and ample kitchen counter space. The home does have laundry hookups in the basement.
Key facts
- Hard wood floors
- Updates roof
- 2 car garage
Tags
Neighborhood map
What this means for you Summary
Snapshot
- This is a 4-bed/2.0-bath multifamily listed at $305k.
Deal economics
- At list price, monthly cash flow is $-280 ($-3k/yr) — negative.
- To cash-flow at today's rent, offer at most $255k (16.2% below list).
- To meet the 1% rule (rent ≥ 1% of price), the offer needs to be $265k (13.2% below list).
- Recommended offer: $255k (16.2% below list) — sets the bar for cash-flow.
- Cap rate 5.2% vs local median 3.0% in Kenmore — top-decile yield for the area; either an underpriced asset or a hidden risk that comps aren't pricing in. Stress-test before assuming the spread holds.
Location & tenants
- Location reads 80/100 on livability (#114 in NY, #1,843 nationally) — a professional / high-income tenant draw. Strengths: amenities A+, housing A+, health & safety A+; Watch: crime D-, commute F.
- Kenmore-Tonawanda Union Free School District (suburban): math 44% / reading 47% proficiency, ranked #453 of 590 in NY (top 77%) — families likely to look elsewhere, expect single-tenant / working-renter base with shorter leases.
- Zoned schools: Charles A Lindbergh Elementary School (math 47% / reading 62%, grade C, #908 of 2,108 statewide, top 46%, 480 students, 38% FRL); Kenmore West Senior High School (math 74% / reading 57%, grade B, #773 of 1,100 statewide, top 70%, 1,358 students, 51% FRL).
- Zoned-school proficiency averages 60% at this address vs 46% district-wide (+14 pts) — the actual schools serving this property are materially stronger than the Kenmore-Tonawanda Union Free School District average implies; a family-tenant draw the district grade alone would hide.
- Market conditions: Rents rising fast (+9.8%/yr); 102 active listings in the ZIP; 15 comparable units currently listed for rent nearby; rentals at typical pace (median 19d on market — plan ~3-4 weeks tenant-placement turnaround); 1,244 units permitted in Erie County in 2024 (563 in 5+ unit buildings).
- This rent runs 43% of the median local income ($74k/yr) — at the standard rent-burdened threshold; future hikes will face affordability resistance.
Forward outlook
- Local home prices are declining (-3.0%/yr); year-one equity from $2k of loan paydown is wiped out by about $9k of value loss. Plan a longer hold.
Negotiation context
- It's been on market 60 days — a 3% lower offer ($296k) is reasonable based on typical stale-listing flexibility.
- 2 sale attempts since 14y ago with the ask held roughly flat each time — persistent listings suggest the price (not the market) is what's stuck; bring a comps-based counter.
- Current owner paid $117k; list at $305k implies a 161% gain — meaningful room to come down on a strong offer.
Risks & watch-outs
- Watch-outs: property tax is 2.5% of price; built in 1928 — expect roof / HVAC / electrical / plumbing capex.
Questions for the listing agent
- What do current leases actually rent for vs. the listed asking? Can we see a recent rent roll and the last 12 months of T-12 income?
- It's been on market 60 days. Have you received any prior offers? Is the seller open to a 16% concession, seller financing, or rate buy-down credit?
- Built in 1928 — when were the roof, HVAC, electrical panel, plumbing, and water heater last replaced?
- Property tax is high relative to price — has the assessment been appealed recently, and will the sale trigger a re-assessment?
- Is there a deadline driving the sale (1031 exchange, divorce, estate, relocation)? That informs how much negotiation room exists.
- Crime grade is D in this area — have there been break-ins, vandalism, or insurance claims at this property in the last 3 years? What carrier currently insures it and at what premium?
- The area grade is low — what's the realistic commute time and amenity access for the typical tenant pool here? Any planned neighborhood developments (good or bad) we should know about?
- What's the average days-on-market for RENTAL listings here right now (not sales)? A rising rental-DOM trend means longer vacancies and softer asking-rent achievability than the comps imply.
- What's the recent tenant-quality profile in this submarket — average credit score on applications, eviction rate, late-payment / NSF rate, and stable-employment percentage? A property-management company in the area should have these aggregated.
- How much new apartment / multifamily construction is in the pipeline within 1–3 miles? Heavy new supply (>2% of stock underway) typically softens rents 12–24 months out; light construction supports rent growth.
Investment metrics
- 1% rule
- 0.87% ✗
- Cap rate
- 5.19%
- Cash-on-cash
- -3.94%
- DSCR
- 0.82
- GRM
- 9.6
CMA / ARV
- ARV (median comp)
- $451,529
- List price
- $305,000
- Delta
- -32.45%
- Verdict
- UNDERPRICED
- Comps
- 20 within 1.0 mi
Show comp detail 12 sales within ~0.75 mi
| Address | Dist | Beds/Ba | Sqft | Sold | Price | $/sf | Match |
|---|---|---|---|---|---|---|---|
| 180 Euclid Ave | 0.12mi | 5/2.0 (+1) | 1,836 (-2%) | 7mo | $230,000 | $125 | 80 |
| 204 E Hazeltine Ave | 0.12mi | 4/2.0 | 1,733 (-7%) | 9mo | $270,000 | $156 | 75 |
| 130 W Hazeltine Ave | 0.52mi | 4/2.0 | 1,806 (-3%) | 4mo | $246,000 | $136 | 66 |
| 79 Lincoln Blvd | 0.51mi | 4/2.0 | 1,968 (+5%) | 2mo | $260,000 | $132 | 66 |
| 397 Sanders Rd | 0.53mi | 4/2.0 | 1,804 (-4%) | 5mo | $270,000 | $150 | 65 |
| 146 Ramsdell Ave | 0.57mi | 4/2.0 | 1,936 (+4%) | 6mo | $281,000 | $145 | 63 |
| 301 Crestwood Ave | 0.48mi | 4/2.0 | 2,024 (+8%) | 3mo | $359,000 | $177 | 61 |
| 19 Avery Ave | 0.39mi | 4/2.0 | 2,107 (+13%) | 2mo | $275,000 | $131 | 59 |
| 41 Hartwell Rd | 0.67mi | 4/2.0 | 2,013 (+8%) | 8mo | $285,000 | $142 | 49 |
| 219 Nassau Ave | 0.57mi | 4/2.0 | 2,136 (+14%) | 1mo | $230,000 | $108 | 49 |
| 27 Hobmoor Ave | 0.55mi | 5/2.0 (+1) | 2,140 (+14%) | 3mo | $321,600 | $150 | 42 |
| 120 Victoria Blvd | 0.59mi | 4/2.0 | 1,592 (-15%) | 8mo | $300,000 | $188 | 41 |
Match score weights: distance 35% · size 25% · config 20% · recency 20%. Top-matched comps best support the ARV.
Projected returns pro-forma
-3.0% appreciation · 8.0% rent growth · sell at horizon
- IRR
- -16.7%
- Equity multiple
- 0.38×
- Total profit
- $-53,082
- Equity at exit
- $45,476
- IRR
- -0.6%
- Equity multiple
- 0.94×
- Total profit
- $-4,717
- Equity at exit
- $26,371
Cash invested: $85,400 (down + closing). Projections, not guarantees.
Landlord ↔ Tenant lean methodology
- Overall (STATE)
- 15 Strongly Tenant-Friendly
- State New York
- 15 Strongly Tenant-Friendly · D+10
- County
- — inherits STATE
- City
- — inherits STATE
ZIP-level market 14217
- Home prices YoY
- -34.3%
- Rents YoY
- 9.8%
- Active inventory
- 102
- Price-to-rent
- 19.2×
Monthly cashflow live
- Estimated rent
- $2,647 high interval (Pro) →
- Mortgage (P&I)
- −$1,599
- Tax from tax record
- −$645 /mo · $7,738/yr
- Insurance
- −$127
- HOA
- −$0
- Vacancy / Maint / Mgmt
- −$556
- Net cashflow
- $-280
Break-even live
Sensitivity live
| Price | -10% $-108 | -5% $-194 | +0% $-280 | +5% $-367 | +10% $-453 |
|---|---|---|---|---|---|
| Rent | -10% $-489 | -5% $-385 | +0% $-280 | +5% $-176 | +10% $-71 |
| Rate | -1.0pp $-127 | -0.5pp $-203 | base $-280 | +0.5pp $-359 | +1.0pp $-440 |
2-unit breakdown (identical units grouped — click to expand)
| Units | Beds | Baths | Est. rent |
|---|---|---|---|
| 2× units | 2 | 1 | $2,648 |
| #1 | 2 | 1 | $1,324 |
| #2 | 2 | 1 | $1,324 |
| Total (2 units) | $2,647 | ||
UW: 25.0% down · 7.5% · 30yr · 1.5% tax · 5.0% vac · 8.0% maint · 8.0% mgmt
Financing live
Cash to close
- Down payment
- $76,250
- Closing costs
- $9,150
- Reserves months
- —
- Total cash needed
- —
Loan-product check · same deal, 3 products live
Conventional
25% down · 7.5% · 30yr
- Down + closing
- —
- Monthly P&I
- —
- Monthly cashflow
- —
- DSCR
- —
- Eligible?
- —
Personal DTI + credit; lowest rate.
DSCR
20% down · 8.5% · 30yr
- Down + closing
- —
- Monthly P&I
- —
- Monthly cashflow
- —
- DSCR
- —
- Eligible?
- —
No personal income docs; deal must DSCR.
Hard money
10% down · 12.0% · 12mo
- Down + closing
- —
- Monthly P&I
- —
- Monthly cashflow
- —
- DSCR
- —
- Eligible?
- —
Short-term bridge; refi at stabilization.
Rent comps 15 comps
| Address | Beds | Baths | Sqft | Rent | $/sqft | DOM | Units | Dist |
|---|---|---|---|---|---|---|---|---|
| 244 Hartwell Rd Buffalo, NY | 3.0 | 1.0 | 1250 | $1,500 | $1.20 | 5d | 1 | 0.49mi |
| 2514 Delaware Ave Unit 1 Buffalo, NY | 3.0 | 1.0 | 1620 | $1,650 | $1.02 | 3d | 1 | 0.58mi |
| 309 N Park Ave Buffalo, NY | 3.0 | 1.0 | 2560 | $1,750 | $0.68 | 16d | 1 | 0.64mi |
| 77 Lovering Ave #2 Buffalo, NY | 3.0 | 1.0 | 1450 | $1,895 | $1.31 | 45d | 1 | 0.69mi |
| 359 Colvin Ave Buffalo, NY | 3.0 | 1.0 | 2010 | $2,100 | $1.04 | 25d | 1 | 0.70mi |
| 351 Stillwell Ave Buffalo, NY | 3.0 | 1.0 | 2586 | $1,800 | $0.70 | 25d | 1 | 0.71mi |
| 307 Sterling Ave Buffalo, NY | 3.0 | 1.0 | 1632 | $1,800 | $1.10 | 5d | 1 | 0.74mi |
| 140 Commonwealth Ave Unit 1 Buffalo, NY | 3.0 | 1.0 | 1250 | $3,500 | $2.80 | 45d | 1 | 0.77mi |
| 172 Tremont Ave Kenmore, NY | 3.0 | 1.5 | 1569 | $2,500 | $1.59 | 12d | 1 | 0.77mi |
| 414 Taunton Pl Unit Lowet Buffalo, NY | 3.0 | 1.0 | 1232 | $1,700 | $1.38 | 16d | 1 | 0.84mi |
| 88 Commonwealth Ave Buffalo, NY | 3.0 | 1.0 | 1355 | $1,695 | $1.25 | 21d | 1 | 0.89mi |
| 79 Commonwealth Ave Buffalo, NY | 3.0 | 1.0 | 1450 | $1,600 | $1.10 | 25d | 1 | 0.91mi |
| 237 W Girard Blvd Buffalo, NY | 4.0 | 1.5 | 1329 | $4,000 | $3.01 | 25d | 1 | 1.10mi |
| 151 Lamson Rd Buffalo, NY | 4.0 | 2.0 | 1382 | $2,350 | $1.70 | 19d | 1 | 1.42mi |
| 163 Carmel Rd Buffalo, NY | 3.0 | 1.0 | 1400 | $1,800 | $1.29 | 5d | 1 | 1.45mi |
Listing history 11 events
-
2026-06-03days on market $305,000 Active 60 DOM
-
2026-06-02days on market $305,000 Active 59 DOM
-
2026-06-01days on market $305,000 Active 58 DOM
-
2026-05-31days on market $305,000 Active 57 DOM
-
2026-05-06price $305,000 516-char remark
Show marketing remark (516 chars)
Looking for a great owner-occupied opportunity or to expand your investment portfolio? 138 E Hazeltine may be for you! As you enter you will see some updates and fresh painted room waiting for you. This gem in the heart of the village gives you a great local to everything you would need. Each apartment has 2 generously sized rooms with 1 bath. The house high lights include a 2-car garage, an updates roof in 26, hard wood floors and ample kitchen counter space. The home does have laundry hookups in the basement.
-
2026-04-03$310,000 Active 516-char remark
Show marketing remark (516 chars)
Looking for a great owner-occupied opportunity or to expand your investment portfolio? 138 E Hazeltine may be for you! As you enter you will see some updates and fresh painted room waiting for you. This gem in the heart of the village gives you a great local to everything you would need. Each apartment has 2 generously sized rooms with 1 bath. The house high lights include a 2-car garage, an updates roof in 26, hard wood floors and ample kitchen counter space. The home does have laundry hookups in the basement.
-
2015-11-18soldstatus $117,000
-
2012-08-03soldstatus $95,000 408-char remark
Show marketing remark (408 chars)
LOVELY MF 2 UNIT ON A GREAT STREET. WELL TAKEN CARE OF INSIDE AND OUT. CUTE UPPER WITH LOTS OF LIGHT, FDR AND EAT IN KIT, UPDATED BATH-1YR. ,W-W - 1YR, OPEN PORCH OFF SIDE OF HOUSE AND SMALL BALCONY OFF 11X11 BDRM. UPPER TENANT ON LEASE UNTIL AUG. 2012. LOWER FEATURES INCLUDE ART. FP. ,7X7 BRKFST RM W. BLT IN SEATING, FDR, KTCHN W/ BUILT INS, AND FLORIDA RM OFF BEDROOM. lOWER TENAT ON LEASE UNTIL MAY 2013
-
2012-08-03soldstatus $95,000
Show marketing remark (408 chars)
LOVELY MF 2 UNIT ON A GREAT STREET. WELL TAKEN CARE OF INSIDE AND OUT. CUTE UPPER WITH LOTS OF LIGHT, FDR AND EAT IN KIT, UPDATED BATH-1YR. ,W-W - 1YR, OPEN PORCH OFF SIDE OF HOUSE AND SMALL BALCONY OFF 11X11 BDRM. UPPER TENANT ON LEASE UNTIL AUG. 2012. LOWER FEATURES INCLUDE ART. FP. ,7X7 BRKFST RM W. BLT IN SEATING, FDR, KTCHN W/ BUILT INS, AND FLORIDA RM OFF BEDROOM. lOWER TENAT ON LEASE UNTIL MAY 2013
-
2012-04-19$94,900 408-char remark
Show marketing remark (408 chars)
LOVELY MF 2 UNIT ON A GREAT STREET. WELL TAKEN CARE OF INSIDE AND OUT. CUTE UPPER WITH LOTS OF LIGHT, FDR AND EAT IN KIT, UPDATED BATH-1YR. ,W-W - 1YR, OPEN PORCH OFF SIDE OF HOUSE AND SMALL BALCONY OFF 11X11 BDRM. UPPER TENANT ON LEASE UNTIL AUG. 2012. LOWER FEATURES INCLUDE ART. FP. ,7X7 BRKFST RM W. BLT IN SEATING, FDR, KTCHN W/ BUILT INS, AND FLORIDA RM OFF BEDROOM. lOWER TENAT ON LEASE UNTIL MAY 2013
-
2006-10-19soldstatus $89,000
ⓘ Source: listings_history table (triggers on properties + properties_extension) + one-shot
backfill from property_details.listing_events for pre-trigger history.
Tax reassessment forecast NY · Partial reset (capped growth)
- Current annual tax
- $7,738 · $645/mo
- Projected year-2 tax
- $7,738 · $645/mo
- Expected delta
- $0/yr ($0/mo · 0.0%)
ⓘ Screening estimate from a state-policy table — verify with the county assessor before closing.
Climate risk First Street
- Flood 1/10 Low FEMA zone X (unshaded) · 0% chance over 30 yrs
- Wildfire 1/10 Low
- Heat 3/10 Moderate 7 d/yr ≥92°F today · 15 d/yr by 30 yrs out
- Wind 1/10 Low
- Air quality 3/10 Moderate 3 unhealthy d/yr today · 4 by 30 yrs out
Nearby sold comps map
Loading sold comps map…
Walkable amenities ~0.75 mi
Loading nearby amenities…
Taxation est. · year 1
- Rental income
- $31,764
- − Mortgage interest
- −$17,085
- − Property taxes
- −$7,738
- − Insurance
- −$1,525
- − Repairs & maintenance
- −$2,541
- − Management
- −$2,541
- − Depreciation
- −$8,873
- Taxable loss
- −$8,539
- Est. tax savings @ 24.0%
- +$2,049
- After-tax cash flow
- $-1,314/yr
For passive investors: Depreciation is non-cash, so a rental often shows a tax loss while cash-flowing — sheltering income. Rental losses are passive: they offset passive income freely, and up to $25,000/yr can offset ordinary (W-2) income if you actively participate and your MAGI is under $100k (phasing out to $0 by $150k); unused losses carry forward. On sale, claimed depreciation is recaptured at up to 25%, and gains may owe capital-gains tax (a 1031 exchange can defer both). Figures are a year-1 estimate at your 24.0% rate — not tax advice; consult a CPA.
Schools (NCES district)
- District
- Kenmore-Tonawanda Union Free School District
- NCES district ID
- 3616230
- Math proficiency
- 44% ▼ -12.00%
- Reading proficiency
- 47% ▼ -1.00%
- Median HH income
- $51,433
- Composite
- 39.18/100
- National rank
- #4024
- State rank
- #453 of 590 in NY
Livability — Kenmore
- Score
- 80/100
- State rank
- #114
- US rank
- #1843
Category grades
Schools grade is shown separately in the Schools card above.
Census & demographics
- Census place
- Kenmore, NY
- County
- Erie County · 714,559 people
- City population
- 22,566
- Metro
- Buffalo-Cheektowaga, NY
- Population (ZIP)
- 22,471
- Household income
- $73,800
- Rent vs Own
- Severe rent burden
- 727.0
Population outlook (Erie County) Hauer SSP2
- Today (2025)
- 933,037 people
- By 2030
- 935,181 · +0.2%
- By 2040
- 928,531 · -0.5%
- By 2050
- 905,725 · -2.9%
- By 2075
- 834,037 · -10.6%
- By 2100
- 708,033 · -24.1%
Race, ethnicity, and origin ACS 2023
- Neighborhood character
- Predominantly White (82%)
- Race & ethnicity
- White 82% Two or more races 8% Hispanic / Latino 6% Black 5%
- Hispanic origin (detail)
- Puerto Rican 4%
- Common ancestry
- Romanian 13% Italian 2% Slovak 2%
- Foreign-born
- 4% · Canada
- Languages at home
- 94% English-only · Spanish 3% Arabic 1% Russian/Polish/Slavic 1%
Political lean MEDSL · Erie
- 2024 margin
- Lean D (+9.7) · D 54.8% · R 45.2%
- 2008→2024 swing
- -7.9pp toward R · 2008: 17.5pp · 2024: 9.7pp
- All cycles
- 2024: D+9.7 2020: D+14.7 2016: D+4.8 2012: D+15.6 2008: D+17.5
Not yet ingested
- Civics
- —
Market trends
- HPI YoY
- ▼ -172.52%
- Current HPI
- 330.7596
- Rent YoY
- ▲ 9.76%
- Metro
- Buffalo-Cheektowaga, NY
- State GDP YoY
- ▲ 2.60%
- F500 in state
- 92
Industry mix (Fortune 500 HQ in NY)
| Industry | F500 HQs | Revenue |
|---|---|---|
| Financial Services | 10 | $950B |
|
||
| Consumer Goods | 9 | $162B |
|
||
| Insurance | 4 | $225B |
|
||
| Telecommunications | 2 | $144B |
|
||
| Pharmaceuticals | 2 | $112B |
|
||
| Media / Entertainment | 2 | $69B |
|
||
Price history
+242.7% since first listed7 events — show timeline
- 2026-05-06 Price Changed $305,000 WNYREIS
- 2026-04-03 Listed $310,000 WNYREIS
- 2015-11-18 Sold (Public Records) $117,000 Public Records
- 2012-08-03 Sold (Public Records) $95,000 Public Records
- 2012-08-03 Sold (MLS) $95,000 WNYREIS
- 2012-04-19 Listed $94,900 WNYREIS
- 2006-10-19 Sold (Public Records) $89,000 Public Records
Property tax history
+6.3%/yrLatest (2025): $7,738 · +1.3% YoY. Source: county tax records.
Cash-flow waterfall
monthlySold comps — $/sqft
last 12 mo · ≤1 miLoading sold comps…