2811 Englewood Ter · Independence, MO
Flood risk 1/10 · Minimal
- FEMA flood zone
- X (unshaded)
- Chance of flooding over 30 yrs
- 0.0%
- Est. flood insurance / yr
- $473 – $860
Fire risk 1/10 · Minimal
- Est. fire insurance / yr
- $1,054 – $1,958
Heat risk 4/10 · Minor
- Hot days now (above 106°F)
- 7 days/yr
- Hot days in 30 yrs
- 17 days/yr
Wind risk 2/10 · Minimal
- Chance of severe wind over 30 yrs
- —
Air-quality risk 3/10 · Minor
- Unhealthy air days now
- 3 days/yr
- Unhealthy air days in 30 yrs
- 3 days/yr
Risk factors via First Street. Map © Google.
Why this score? — see what drove the D- grade
The composite is a weighted blend of 9 inputs, each scored 0–100. Each bar is that input's sub-score; the figure is the points it added to the 100-point composite (weight × sub-score).
- Cash flow +12.3/30.0
- ARV discount +7.4/15.0
- Livability +4.1/5.0
- Rent growth +3.9/5.0
- DSCR +3.6/10.0
- 1% rule +3.0/10.0
- Schools +2.7/10.0
- Condition / age +2.5/5.0
- Appreciation +0.0/10.0
$175,000
🖨 Deal sheet (PDF) 📄 Offer letter ✓ Due diligence
Listing remarks MLS
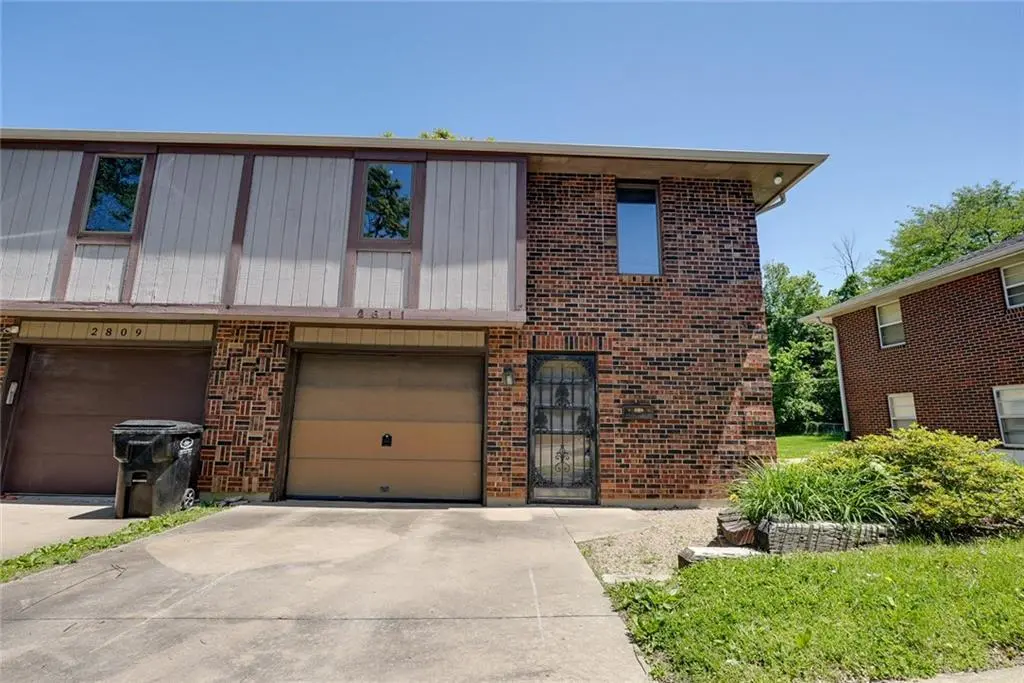
Custom Built -Anderson Thermo Casement Windows!deck'02,a/c'01,DW'01,comp roof, fenced yard (backs to the east) w/ storage barn, garage is very deep, could be tandem, remodeled baths, good sized rooms. Seller repainting/carpeting back bedroom. Otherside 1/2 duplex available mls#1241508 2809 Englewood TERR. Buy one side or whole duplex! Call agent for information/details.
Key facts
- One car garage
- Laundry room
- Fenced in backyard
Tags
Property features AI
Finance
- HOA & community: No association fees
Exterior
- Parking: Attached garage with garage door opener (1-car)
- Security: Smoke detector(s)
- Utilities: Public water; Public sewer
- Home design: Residential half-duplex (attached); Raised ranch floor plan
- Construction: Board & batten siding with brick trim; Composition roof
- Exterior features: Deck; Shed(s); City lot; Paved road access; Fencing (other)
Interior
- Kitchen: Dishwasher; Disposal; Microwave; Refrigerator; Electric range
- Bedrooms: 3 bedrooms total — two bedrooms on the first floor; one bedroom in the basement
- Flooring: Carpet in primary living areas and bedrooms; Vinyl in kitchen
- Bathrooms: 2 full bathrooms
- Heating & cooling: Natural gas heating; Attic fan; Electric cooling
- Interior features: Walk-in closet(s); Storm door(s); Finished basement; Country kitchen (dining area)
- Laundry & utility: Laundry in basement
Neighborhood map
What this means for you Summary
Snapshot
- This is a 2-bed/1.5-bath townhouse listed at $175k.
Deal economics
- At list price, monthly cash flow is $-32 ($-386/yr) — negative.
- To cash-flow at today's rent, offer at most $169k (3.2% below list).
- To meet the 1% rule (rent ≥ 1% of price), the offer needs to be $140k (20.1% below list).
- Recommended offer: $140k (20.1% below list) — sets the bar for 1% rule.
- Cap rate 6.1% vs local median 5.0% in Independence — meaningfully above typical; check what's discounted (condition, days-on-market, listing class) to confirm the premium yield is real.
Location & tenants
- Location reads 82/100 on livability (#10 in MO, #1,296 nationally) — a professional / high-income tenant draw. Strengths: amenities A+, commute A+, cost of living A+; Watch: employment D+, crime F.
- Independence 30 (suburban): math 26% / reading 38% proficiency, ranked #252 of 324 in MO (top 78%) — families likely to look elsewhere, expect single-tenant / working-renter base with shorter leases.
- Zoned schools: Three Trails Elem. (math 37% / reading 32%, grade F, #676 of 1,115 statewide, top 66%, 317 students, 75% FRL); Clifford H. Nowlin Middle (math 13% / reading 29%, grade F, #342 of 391 statewide, top 88%, 875 students, 80% FRL); Van Horn High (math 13% / reading 27%, grade F, #472 of 521 statewide, top 91%, 1,047 students, 72% FRL) — zoned schools average 76% FRL vs 58% district-wide (17 pts higher); higher-poverty schools than district average — tighter screening recommended.
- Market conditions: Rents rising fast (+5.4%/yr); 135 active listings in the ZIP; 8 comparable units currently listed for rent nearby; rentals at typical pace (median 19d on market — plan ~3-4 weeks tenant-placement turnaround); 4,002 units permitted in Jackson County in 2024 (2,271 in 5+ unit buildings).
Forward outlook
- Local home prices are declining (-3.0%/yr); year-one equity from $1k of loan paydown is wiped out by about $5k of value loss. Plan a longer hold.
- Jackson County population projected at +4% by 2050 — modest demand growth; plan on rents tracking national, not racing it.
Negotiation context
- Only 8 days on market — expect competitive offers; lowballing is unlikely to land.
- 2 sale attempts since 21y ago with the ask held roughly flat each time — persistent listings suggest the price (not the market) is what's stuck; bring a comps-based counter.
Questions for the listing agent
- What do current leases actually rent for vs. the listed asking? Can we see a recent rent roll and the last 12 months of T-12 income?
- Is there a deadline driving the sale (1031 exchange, divorce, estate, relocation)? That informs how much negotiation room exists.
- Crime grade is F in this area — have there been break-ins, vandalism, or insurance claims at this property in the last 3 years? What carrier currently insures it and at what premium?
- The area grade is low — what's the realistic commute time and amenity access for the typical tenant pool here? Any planned neighborhood developments (good or bad) we should know about?
- What's the average days-on-market for RENTAL listings here right now (not sales)? A rising rental-DOM trend means longer vacancies and softer asking-rent achievability than the comps imply.
- What's the recent tenant-quality profile in this submarket — average credit score on applications, eviction rate, late-payment / NSF rate, and stable-employment percentage? A property-management company in the area should have these aggregated.
- How much new for-sale + rental construction is in the pipeline within 1–3 miles? Heavy new supply typically softens prices + rents 12–24 months out; constrained supply supports both.
Investment metrics
- 1% rule
- 0.80% ✗
- Cap rate
- 6.07%
- Cash-on-cash
- -0.79%
- DSCR
- 0.96
- GRM
- 10.4
CMA / ARV
- ARV (median comp)
- $174,503
- List price
- $175,000
- Delta
- 0.28%
- Verdict
- FAIR
- Comps
- 5 within 1.0 mi
Projected returns pro-forma
-3.0% appreciation · 5.43% rent growth · sell at horizon
- IRR
- -15.1%
- Equity multiple
- 0.45×
- Total profit
- $-26,931
- Equity at exit
- $26,093
- IRR
- -3.1%
- Equity multiple
- 0.77×
- Total profit
- $-11,094
- Equity at exit
- $15,131
Cash invested: $49,000 (down + closing). Projections, not guarantees.
Landlord ↔ Tenant lean methodology
- Overall (STATE)
- 81 Strongly Landlord-Friendly
- State Missouri
- 81 Strongly Landlord-Friendly · R+10
- County
- — inherits STATE
- City
- — inherits STATE
ZIP-level market 64052
- Home prices YoY
- -34.6%
- Rents YoY
- 5.4%
- Active inventory
- 135
- Price-to-rent
- 10.4×
Monthly cashflow live
- Estimated rent
- $1,397 high interval (Pro) →
- Mortgage (P&I)
- −$918
- Tax from tax record
- −$145 /mo · $1,746/yr
- Insurance
- −$73
- HOA
- −$0
- Vacancy / Maint / Mgmt
- −$293
- Net cashflow
- $-32
Break-even live
Sensitivity live
| Price | -10% $67 | -5% $17 | +0% $-32 | +5% $-82 | +10% $-131 |
|---|---|---|---|---|---|
| Rent | -10% $-143 | -5% $-87 | +0% $-32 | +5% $23 | +10% $78 |
| Rate | -1.0pp $56 | -0.5pp $12 | base $-32 | +0.5pp $-78 | +1.0pp $-124 |
UW: 25.0% down · 7.5% · 30yr · 1.5% tax · 5.0% vac · 8.0% maint · 8.0% mgmt
Financing live
Cash to close
- Down payment
- $43,750
- Closing costs
- $5,250
- Reserves months
- —
- Total cash needed
- —
Loan-product check · same deal, 3 products live
Conventional
25% down · 7.5% · 30yr
- Down + closing
- —
- Monthly P&I
- —
- Monthly cashflow
- —
- DSCR
- —
- Eligible?
- —
Personal DTI + credit; lowest rate.
DSCR
20% down · 8.5% · 30yr
- Down + closing
- —
- Monthly P&I
- —
- Monthly cashflow
- —
- DSCR
- —
- Eligible?
- —
No personal income docs; deal must DSCR.
Hard money
10% down · 12.0% · 12mo
- Down + closing
- —
- Monthly P&I
- —
- Monthly cashflow
- —
- DSCR
- —
- Eligible?
- —
Short-term bridge; refi at stabilization.
Rent comps 8 comps
| Address | Beds | Baths | Sqft | Rent | $/sqft | DOM | Units | Dist |
|---|---|---|---|---|---|---|---|---|
| 2256 S Sterling Ave Independence, MO | 3.0 | 1.5 | 1284 | $1,399 | $1.09 | 18d | 1 | 0.71mi |
| 2356 S Crysler Ave Independence, MO | 3.0 | 2.0 | 1881 | $1,653 | $0.88 | 25d | 1 | 0.80mi |
| 2110 S Sterling Ave Independence, MO | 3.0 | 2.0 | 1722 | $1,849 | $1.07 | 18d | 1 | 0.81mi |
| 2342 S Crysler Ave Independence, MO | 3.0 | 2.0 | 1400 | $1,395 | $1.00 | 0d | 1 | 0.82mi |
| 10817 E 19th Ter S Independence, MO | 3.0 | 1.0 | 1428 | $1,801 | $1.26 | 18d | 1 | 0.96mi |
| 11709 E Winner Rd Independence, MO | 3.0 | 1.5 | 1300 | $1,195 | $0.92 | 18d | 1 | 1.13mi |
| 1425 S Northern Blvd Independence, MO | 3.0 | 1.5 | 1275 | $1,200 | $0.94 | 9d | 1 | 1.46mi |
| 3927 Willow Ave Kansas City, MO | 1.0–3.0 | 1.0–2.0 | 997 | $1,152 | $1.15 | 0d | 10 | 1.47mi |
Listing history 6 events
-
2026-05-13$175,000 Active 753-char remark
-
2005-07-01soldstatus
-
2005-06-30soldstatus 372-char remark
Show marketing remark (372 chars)
Custom Built -Anderson Thermo Casement Windows!deck'02,a/c'01,DW'01,comp roof, fenced yard (backs to the east) w/ storage barn, garage is very deep, could be tandem, remodeled baths, good sized rooms. Seller repainting/carpeting back bedroom. Otherside 1/2 duplex available mls#1241508 2809 Englewood TERR. Buy one side or whole duplex! Call agent for information/details.
-
2005-04-06$89,500 372-char remark
Show marketing remark (372 chars)
Custom Built -Anderson Thermo Casement Windows!deck'02,a/c'01,DW'01,comp roof, fenced yard (backs to the east) w/ storage barn, garage is very deep, could be tandem, remodeled baths, good sized rooms. Seller repainting/carpeting back bedroom. Otherside 1/2 duplex available mls#1241508 2809 Englewood TERR. Buy one side or whole duplex! Call agent for information/details.
-
1997-11-20soldstatus
-
1984-05-01soldstatus
ⓘ Source: listings_history table (triggers on properties + properties_extension) + one-shot
backfill from property_details.listing_events for pre-trigger history.
Tax reassessment forecast MO · Resets to sale price
- Current annual tax
- $1,746 · $145/mo
- Projected year-2 tax
- $1,746 · $145/mo
- Expected delta
- $0/yr ($0/mo · -0.0%)
ⓘ Screening estimate from a state-policy table — verify with the county assessor before closing.
Climate risk First Street
- Flood 1/10 Low FEMA zone X (unshaded) · 0% chance over 30 yrs
- Wildfire 1/10 Low
- Heat 4/10 Moderate 7 d/yr ≥106°F today · 17 d/yr by 30 yrs out
- Wind 2/10 Low
- Air quality 3/10 Moderate 3 unhealthy d/yr today · 3 by 30 yrs out
Nearby sold comps map
Loading sold comps map…
Walkable amenities ~0.75 mi
Loading nearby amenities…
Taxation est. · year 1
- Rental income
- $16,769
- − Mortgage interest
- −$9,803
- − Property taxes
- −$1,746
- − Insurance
- −$875
- − Repairs & maintenance
- −$1,341
- − Management
- −$1,341
- − Depreciation
- −$5,091
- Taxable loss
- −$3,429
- Est. tax savings @ 24.0%
- +$823
- After-tax cash flow
- $437/yr
For passive investors: Depreciation is non-cash, so a rental often shows a tax loss while cash-flowing — sheltering income. Rental losses are passive: they offset passive income freely, and up to $25,000/yr can offset ordinary (W-2) income if you actively participate and your MAGI is under $100k (phasing out to $0 by $150k); unused losses carry forward. On sale, claimed depreciation is recaptured at up to 25%, and gains may owe capital-gains tax (a 1031 exchange can defer both). Figures are a year-1 estimate at your 24.0% rate — not tax advice; consult a CPA.
Schools (NCES district)
- District
- Independence 30
- NCES district ID
- 2915480
- Math proficiency
- 26% ▼ -8.00%
- Reading proficiency
- 38% ▼ -5.00%
- Median HH income
- $41,843
- Composite
- 27.04/100
- National rank
- #7054
- State rank
- #252 of 324 in MO
Livability — Independence
- Score
- 82/100
- State rank
- #10
- US rank
- #1296
Category grades
Schools grade is shown separately in the Schools card above.
Census & demographics
- Census place
- Independence, MO
- County
- Jackson County · 687,798 people
- City population
- 117,675
- Metro
- Kansas City, MO-KS
- Population (ZIP)
- 22,138
- Household income
- $59,007
- Rent vs Own
- Severe rent burden
- 965.0
Population outlook (Jackson County) Hauer SSP2
- Today (2025)
- 719,589 people
- By 2030
- 731,456 · +1.6%
- By 2040
- 746,689 · +3.8%
- By 2050
- 749,289 · +4.1%
- By 2075
- 736,227 · +2.3%
- By 2100
- 668,210 · -7.1%
Race, ethnicity, and origin ACS 2023
- Neighborhood character
- Diverse neighborhood (Simpson 0.56)
- Race & ethnicity
- White 62% Hispanic / Latino 23% Two or more races 15% Black 7% Asian 2%
- Hispanic origin (detail)
- Mexican 15%
- Common ancestry
- Italian 12% Slovak 2% Lithuanian 2%
- Foreign-born
- 11% · Canada, China
- Languages at home
- 85% English-only · Spanish 13% Other Asian/Pacific 1%
Political lean MEDSL · Jackson
- 2024 margin
- D (+19.3) · D 58.9% · R 39.5% · Other 1.6%
- 2008→2024 swing
- -6.1pp toward R · 2008: 25.4pp · 2024: 19.3pp
- All cycles
- 2024: D+19.3 2020: D+22.0 2016: D+16.6 2012: D+19.0 2008: D+25.4
Not yet ingested
- Civics
- —
Market trends
- HPI YoY
- ▼ -160.06%
- Current HPI
- 302.1124
- Rent YoY
- ▲ 5.43%
- Metro
- Kansas City, MO-KS
- State GDP YoY
- ▲ 1.84%
- F500 in state
- 20
Industry mix (Fortune 500 HQ in MO)
| Industry | F500 HQs | Revenue |
|---|---|---|
| Healthcare | 1 | $163B |
|
||
| Insurance | 1 | $21B |
|
||
| Industrial Technology | 1 | $17B |
|
||
| Retail | 1 | $16B |
|
||
| Industrial Distribution | 1 | $10B |
|
||
| Utilities | 1 | $9B |
|
||
Price history
+95.5% since first listed7 events — show timeline
- 2026-05-21 Pending — Heartland MLS as Distributed by MLS Grid
- 2026-05-13 Listed $175,000 Heartland MLS as Distributed by MLS Grid
- 2005-07-01 Sold (Public Records) — Public Records
- 2005-06-30 Sold (MLS) — Heartland MLS as Distributed by MLS Grid
- 2005-04-06 Listed $89,500 Heartland MLS as Distributed by MLS Grid
- 1997-11-20 Sold (Public Records) — Public Records
- 1984-05-01 Sold (Public Records) — Public Records
Property tax history
+4.6%/yrLatest (2025): $1,746 · -23.2% YoY. Source: county tax records.
Cash-flow waterfall
monthlySold comps — $/sqft
last 12 mo · ≤1 miLoading sold comps…