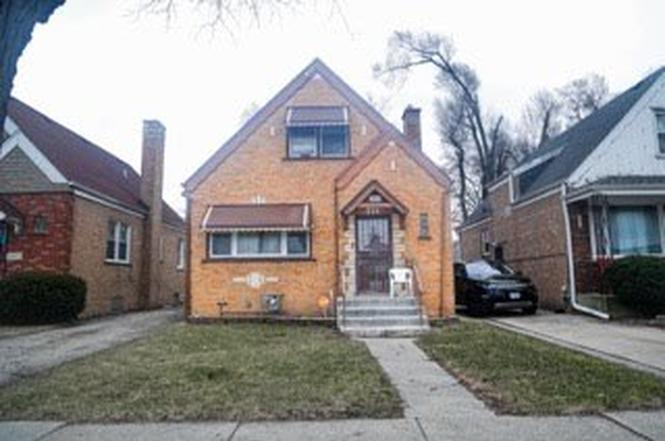
1107 24th Ave · Bellwood, IL
Flood risk 1/10 · Minimal
- FEMA flood zone
- X (shaded)
- Chance of flooding over 30 yrs
- 0.0%
- Est. flood insurance / yr
- $507 – $1,088
Fire risk 1/10 · Minimal
- Est. fire insurance / yr
- $804 – $1,492
Heat risk 3/10 · Minor
- Hot days now (above 101°F)
- 7 days/yr
- Hot days in 30 yrs
- 14 days/yr
Wind risk 2/10 · Minimal
- Chance of severe wind over 30 yrs
- —
Air-quality risk 4/10 · Minor
- Unhealthy air days now
- 6 days/yr
- Unhealthy air days in 30 yrs
- 7 days/yr
Risk factors via First Street. Map © Google.
Why this score? — see what drove the D+ grade
The composite is a weighted blend of 9 inputs, each scored 0–100. Each bar is that input's sub-score; the figure is the points it added to the 100-point composite (weight × sub-score).
- ARV discount +15.0/15.0
- Cash flow +14.5/30.0
- 1% rule +5.5/10.0
- DSCR +4.4/10.0
- Livability +3.9/5.0
- Rent growth +2.5/5.0
- Condition / age +2.5/5.0
- Schools +1.4/10.0
- Appreciation +0.0/10.0
$220,000
🖨 Deal sheet (PDF) 📄 Offer letter ✓ Due diligence
Listing remarks
Charming 3-bedroom, 1.5-bathroom 1.5-story brick home with a rich history - same owner for nearly 40 years! This well-maintained home boasts hardwood floors beneath the carpet, offering potential for a beautiful upgrade. The spacious full semi-finished basement is ready for your creative touch, providing endless possibilities for additional living space. Conveniently located near shopping and dining options, this home offers a fantastic blend of comfort, potential, and prime location. Don't miss out on this wonderful opportunity!
Key facts
- Prime location
- Hardwood floors
- 4,617 sq ft lot
Tags
Property features AI
Finance
- Other: Not currently leased; Possession at closing
- HOA & community: No master association fees required
Exterior
- Parking: Detached garage (owned) with concrete surface; Two garage spaces, two total parking spaces
- Utilities: Public water; Public sewer
- Home design: Detached single-family home; 1.5-story design; Fee simple ownership
- Construction: Brick construction; Asphalt roof; Concrete perimeter foundation; Built approximately 71–80 years ago; Property built before 1978
- Exterior features: Fenced yard; Lot dimensions approximately 134 x 35; Lot is less than 0.25 acre; Interstate access nearby
Interior
- Kitchen: Kitchen with eating area/table space (11 x 9)
- Bedrooms: Three bedrooms total; Primary bedroom on second floor (13 x 15); Second bedroom on second floor (13 x 12); Third bedroom on main level (11 x 10)
- Bathrooms: One full bath; One half bath; Basement contains a bathroom
- Heating & cooling: Forced air heating; Central air conditioning
- Interior features: Seven total rooms; Partially finished full basement
- Laundry & utility: Laundry room
Neighborhood map
What this means for you Summary
Snapshot
- This is a 3-bed/1.5-bath single-family listed at $220k.
Deal economics
- At list price, monthly cash flow is $48 ($577/yr) — positive.
- The deal already cash-flows at list — no discount required.
- Meets the 1% rule at list price ($2k rent vs $220k).
- Recommended offer: $194k (12.0% below list) — sets the bar for market timing.
- Cap rate 6.6% vs local median 5.3% in Bellwood — meaningfully above typical; check what's discounted (condition, days-on-market, listing class) to confirm the premium yield is real.
Location & tenants
- Location reads 77/100 on livability (#155 in IL, #2,847 nationally) — a middle-class / working-renter tenant base. Strengths: commute A+, cost of living A+, housing A+; Watch: health & safety D+, amenities F.
- Proviso Twp Hsd 209 (suburban): math 12% / reading 17% proficiency, ranked #507 of 620 in IL (top 82%) — low school quality limits family demand, transient renter base, plan for 1-2y turnover.
- Zoned schools: Thurgood Marshall Elem School (239 students, 0% FRL); Roosevelt Middle School (695 students, 0% FRL); Proviso West High School (math 6% / reading 11%, grade F, #584 of 693 statewide, top 85%, 1,868 students, 0% FRL).
- Market conditions: 43 active listings in the ZIP; 16 comparable units currently listed for rent nearby; rentals at typical pace (median 17d on market — plan ~3-4 weeks tenant-placement turnaround); 6,272 units permitted in Cook County in 2024 (4,658 in 5+ unit buildings).
Forward outlook
- Local home prices are declining (-3.0%/yr); year-one equity from $2k of loan paydown is wiped out by about $7k of value loss. Plan a longer hold.
Negotiation context
- It's been on market 142 days — a 12% lower offer ($194k) is reasonable based on typical stale-listing flexibility.
- 6 sale attempts; this cycle's ask is 7% above the opening price — seller raised mid-cycle; expect resistance to lowballs.
Risks & watch-outs
- Watch-outs: property tax is 2.9% of price; built in 1950 — expect roof / HVAC / electrical / plumbing capex.
Questions for the listing agent
- It's been on market 142 days. Have you received any prior offers? Is the seller open to a 12% concession, seller financing, or rate buy-down credit?
- Built in 1950 — when were the roof, HVAC, electrical panel, plumbing, and water heater last replaced?
- Property tax is high relative to price — has the assessment been appealed recently, and will the sale trigger a re-assessment?
- Why hasn't it sold? Are there any deal-killer items the seller is aware of (foundation, flood, title, zoning, code violations)?
- Is there a deadline driving the sale (1031 exchange, divorce, estate, relocation)? That informs how much negotiation room exists.
- Schools are F-rated, which usually means shorter tenancies and higher turnover. Who's the typical renter profile here, and what's been the actual vacancy rate?
- The area grade is low — what's the realistic commute time and amenity access for the typical tenant pool here? Any planned neighborhood developments (good or bad) we should know about?
- What's the average days-on-market for RENTAL listings here right now (not sales)? A rising rental-DOM trend means longer vacancies and softer asking-rent achievability than the comps imply.
- What's the recent tenant-quality profile in this submarket — average credit score on applications, eviction rate, late-payment / NSF rate, and stable-employment percentage? A property-management company in the area should have these aggregated.
- How much new for-sale + rental construction is in the pipeline within 1–3 miles? Heavy new supply typically softens prices + rents 12–24 months out; constrained supply supports both.
Investment metrics
- 1% rule
- 1.05% ✓
- Cap rate
- 6.56%
- Cash-on-cash
- 0.94%
- DSCR
- 1.04
- GRM
- 8.0
CMA / ARV
- ARV (on-the-fly)
- $296,376
- Comps found
- 12
Show comp detail 12 sales within ~0.75 mi
| Address | Dist | Beds/Ba | Sqft | Sold | Price | $/sf | Match |
|---|---|---|---|---|---|---|---|
| 1433 S 21st Ave | 0.20mi | 3/2.0 | 1,226 (-4%) | 1mo | $290,000 | $237 | 82 |
| 1925 S 22nd Ave | 0.33mi | 3/2.0 | 1,260 (-1%) | 2mo | $345,000 | $274 | 79 |
| 1615 S 20th Ave | 0.26mi | 2/2.0 (-1) | 1,260 (-1%) | 3mo | $263,000 | $209 | 77 |
| 2111 S 24th Ave | 0.52mi | 3/2.0 | 1,286 (+1%) | 2mo | $300,000 | $233 | 70 |
| 1037 24th Ave | 0.06mi | 2/1.0 (-1) | 1,106 (-13%) | 2mo | $215,000 | $194 | 67 |
| 1124 31st Ave | 0.48mi | 4/1.0 (+1) | 1,224 (-4%) | 2mo | $255,000 | $208 | 62 |
| 1911 S 18th Ave | 0.47mi | 4/1.0 (+1) | 1,340 (+5%) | 1mo | $130,000 | $97 | 61 |
| 2023 S 23rd Ave | 0.44mi | 3/2.5 | 1,396 (+10%) | 3mo | $324,900 | $233 | 56 |
| 2247 S 21st Ave | 0.74mi | 3/1.5 | 1,176 (-8%) | 1mo | $295,000 | $251 | 52 |
| 745 Manchester Ave | 0.52mi | 3/2.0 | 1,100 (-14%) | 0mo | $339,000 | $308 | 51 |
| 1844 S 13th Ave | 0.70mi | 3/1.5 | 1,404 (+10%) | 1mo | $177,000 | $126 | 49 |
| 2036 S 15th Ave | 0.70mi | 3/1.0 | 1,153 (-9%) | 1mo | $257,500 | $223 | 49 |
Match score weights: distance 35% · size 25% · config 20% · recency 20%. Top-matched comps best support the ARV.
Projected returns pro-forma
-3.0% appreciation · 3.0% rent growth · sell at horizon
- IRR
- -14.7%
- Equity multiple
- 0.47×
- Total profit
- $-32,398
- Equity at exit
- $32,803
- IRR
- -5.9%
- Equity multiple
- 0.62×
- Total profit
- $-23,497
- Equity at exit
- $19,022
Cash invested: $61,600 (down + closing). Projections, not guarantees.
Landlord ↔ Tenant lean methodology
- Overall (STATE)
- 43 Moderately Tenant-Leaning
- State Illinois
- 43 Moderately Tenant-Leaning · D+7
- County
- — inherits STATE
- City
- — inherits STATE
ZIP-level market 60104
- Active inventory
- 43
- Price-to-rent
- 8.0×
Monthly cashflow live
- Estimated rent
- $2,306 high interval (Pro) →
- Mortgage (P&I)
- −$1,154
- Tax from tax record
- −$528 /mo · $6,335/yr
- Insurance
- −$92
- HOA
- −$0
- Vacancy / Maint / Mgmt
- −$484
- Net cashflow
- $48
Break-even live
Sensitivity live
| Price | -10% $173 | -5% $110 | +0% $48 | +5% $-14 | +10% $-76 |
|---|---|---|---|---|---|
| Rent | -10% $-134 | -5% $-43 | +0% $48 | +5% $139 | +10% $230 |
| Rate | -1.0pp $159 | -0.5pp $104 | base $48 | +0.5pp $-9 | +1.0pp $-67 |
UW: 25.0% down · 7.5% · 30yr · 1.5% tax · 5.0% vac · 8.0% maint · 8.0% mgmt
Financing live
Cash to close
- Down payment
- $55,000
- Closing costs
- $6,600
- Reserves months
- —
- Total cash needed
- —
Loan-product check · same deal, 3 products live
Conventional
25% down · 7.5% · 30yr
- Down + closing
- —
- Monthly P&I
- —
- Monthly cashflow
- —
- DSCR
- —
- Eligible?
- —
Personal DTI + credit; lowest rate.
DSCR
20% down · 8.5% · 30yr
- Down + closing
- —
- Monthly P&I
- —
- Monthly cashflow
- —
- DSCR
- —
- Eligible?
- —
No personal income docs; deal must DSCR.
Hard money
10% down · 12.0% · 12mo
- Down + closing
- —
- Monthly P&I
- —
- Monthly cashflow
- —
- DSCR
- —
- Eligible?
- —
Short-term bridge; refi at stabilization.
Rent comps 16 comps
| Address | Beds | Baths | Sqft | Rent | $/sqft | DOM | Units | Dist |
|---|---|---|---|---|---|---|---|---|
| 723 Manchester Ave Westchester, IL | 3.0 | 2.0 | 1151 | $2,721 | $2.36 | 26d | 1 | 0.49mi |
| 624 Norfolk Ave Unit 1237891P Westchester, IL | 3.0 | 2.0 | 1646 | $12,991 | $7.89 | 23d | 1 | 0.55mi |
| 1814 Warren St Maywood, IL | 3.0 | 1.0 | 1200 | $2,500 | $2.08 | 12d | 1 | 0.59mi |
| 1814 Warren St Unit 2W Maywood, IL | 3.0 | 1.0 | 1200 | $2,500 | $2.08 | 0d | 1 | 0.59mi |
| 2416 W Roosevelt Rd Apt 1S Broadview, IL | 2.0 | 1.0 | 884 | $1,475 | $1.67 | 26d | 1 | 0.65mi |
| 1104 Rice Ave Bellwood, IL | 2.0 | 1.0 | 995 | $1,725 | $1.73 | 24d | 1 | 0.65mi |
| 2040 16th Ave Unit 2C Broadview, IL | 2.0 | 1.0 | 900 | $1,595 | $1.77 | 15d | 1 | 0.71mi |
| 1013 Bellwood Ave Unit 2W Bellwood, IL | 2.0 | 1.0 | 925 | $1,850 | $2.00 | 22d | 1 | 0.81mi |
| 631 Balmoral Ave Westchester, IL | 2.0 | 1.0 | 903 | $2,100 | $2.33 | 26d | 1 | 0.92mi |
| 218 S 13th Ave Unit 2 Maywood, IL | 2.0 | 1.0 | 1050 | $1,650 | $1.57 | 7d | 1 | 1.07mi |
| 1215 Balmoral Ave Unit 1 Westchester, IL | 3.0 | 1.5 | 1500 | $2,750 | $1.83 | 26d | 1 | 1.12mi |
| 1215 Balmoral Ave Unit 2 Westchester, IL | 3.0 | 1.5 | 1500 | $2,950 | $1.97 | 17d | 1 | 1.12mi |
| 1610 S 4th Ave Maywood, IL | 3.0 | 2.5 | 1754 | $4,500 | $2.57 | 0d | 1 | 1.25mi |
| 903 S 5th Ave Unit 2D Maywood, IL | 3.0 | 2.0 | 1008 | $2,100 | $2.08 | 0d | 1 | 1.29mi |
| 410 School St Unit 1B Maywood, IL | 3.0 | 2.0 | 1218 | $2,200 | $1.81 | 0d | 1 | 1.30mi |
| 422 Granville Ave Hillside, IL | 3.0 | 1.0 | 1194 | $2,441 | $2.04 | 0d | 1 | 1.35mi |
Listing history 29 events
-
2026-06-21days on market $220,000 Active 142 DOM
-
2026-06-18days on market $220,000 Active 139 DOM
-
2026-06-17days on market $220,000 Active 138 DOM
-
2026-06-16days on market $220,000 Active 137 DOM
-
2026-06-15days on market $220,000 Active 136 DOM
-
2026-06-13days on market $220,000 Active 134 DOM
-
2026-06-13statusdays on market $220,000 Active 133 DOM
-
2026-06-10status $220,000 Contingent - Continue to Show 130 DOM
-
2026-06-09days on market $220,000 Active 130 DOM
-
2026-06-08days on market $220,000 Active 129 DOM
-
2026-06-07days on market $220,000 Active 128 DOM
-
2026-06-04days on market $220,000 Active 125 DOM
-
2026-06-03days on market $220,000 Active 124 DOM
-
2026-06-02days on market $220,000 Active 123 DOM
-
2026-06-01days on market $220,000 Active 122 DOM
-
2026-05-31days on market $220,000 Active 121 DOM
-
2026-03-13status Active
-
2026-03-10historical Contingent - Continue to Show
-
2026-03-04status Active
-
2026-03-04price $220,000
-
2026-02-28historical Contingent - Continue to Show
-
2026-01-30$205,000 Active
-
2025-10-31historical
-
2025-10-07price
-
2025-06-04status Active
-
2025-04-10historical
-
2025-04-10status Temporarily No Showings
-
2025-04-08historical
-
2025-04-04Active
ⓘ Source: listings_history table (triggers on properties + properties_extension) + one-shot
backfill from property_details.listing_events for pre-trigger history.
Tax reassessment forecast IL · Partial reset (capped growth)
- Current annual tax
- $6,335 · $528/mo
- Projected year-2 tax
- $6,335 · $528/mo
- Expected delta
- $0/yr ($0/mo · 0.0%)
ⓘ Screening estimate from a state-policy table — verify with the county assessor before closing.
Climate risk First Street
- Flood 1/10 Low FEMA zone X (shaded) · 0% chance over 30 yrs
- Wildfire 1/10 Low
- Heat 3/10 Moderate 7 d/yr ≥101°F today · 14 d/yr by 30 yrs out
- Wind 2/10 Low
- Air quality 4/10 Moderate 6 unhealthy d/yr today · 7 by 30 yrs out
Nearby sold comps map
Loading sold comps map…
Walkable amenities ~0.75 mi
Loading nearby amenities…
Taxation est. · year 1
- Rental income
- $27,666
- − Mortgage interest
- −$12,323
- − Property taxes
- −$6,335
- − Insurance
- −$1,100
- − Repairs & maintenance
- −$2,213
- − Management
- −$2,213
- − Depreciation
- −$6,400
- Taxable loss
- −$2,919
- Est. tax savings @ 24.0%
- +$701
- After-tax cash flow
- $1,277/yr
For passive investors: Depreciation is non-cash, so a rental often shows a tax loss while cash-flowing — sheltering income. Rental losses are passive: they offset passive income freely, and up to $25,000/yr can offset ordinary (W-2) income if you actively participate and your MAGI is under $100k (phasing out to $0 by $150k); unused losses carry forward. On sale, claimed depreciation is recaptured at up to 25%, and gains may owe capital-gains tax (a 1031 exchange can defer both). Figures are a year-1 estimate at your 24.0% rate — not tax advice; consult a CPA.
Schools (NCES district)
- District
- Proviso Twp Hsd 209
- NCES district ID
- 1732910
- Math proficiency
- 12% ▼ -4.00%
- Reading proficiency
- 17% ▼ -3.00%
- Median HH income
- $51,744
- Composite
- 13.5/100
- National rank
- #9518
- State rank
- #507 of 620 in IL
Livability — Bellwood
- Score
- 77/100
- State rank
- #155
- US rank
- #2847
Category grades
Schools grade is shown separately in the Schools card above.
Census & demographics
- Census place
- Bellwood, IL
- City population
- 18,390
- Population (ZIP)
- 18,390
Population outlook (Cook County) Hauer SSP2
- Today (2025)
- 5,347,519 people
- By 2030
- 5,357,703 · +0.2%
- By 2040
- 5,324,924 · -0.4%
- By 2050
- 5,230,762 · -2.2%
- By 2075
- 4,785,735 · -10.5%
- By 2100
- 4,188,836 · -21.7%
Race, ethnicity, and origin ACS 2023
- Neighborhood character
- Predominantly Black (70%)
- Race & ethnicity
- Black 70% Hispanic / Latino 23% Two or more races 7% White 4% Asian 1%
- Hispanic origin (detail)
- Mexican 18% Puerto Rican 4%
- Common ancestry
- Romanian 1%
- Foreign-born
- 10% · Canada
- Languages at home
- 78% English-only · Spanish 20% Other Indo-European 1%
Political lean MEDSL · Cook
- 2024 margin
- Solid D (+42.0) · D 70.4% · R 28.4% · Other 1.2%
- 2008→2024 swing
- -11.4pp toward R · 2008: 53.4pp · 2024: 42.0pp
- All cycles
- 2024: D+42.0 2020: D+50.3 2016: D+53.0 2012: D+49.4 2008: D+53.4
Not yet ingested
- Civics
- —
Market trends
- HPI YoY
- ▼ -212.49%
- Current HPI
- 290.8215
- Rent YoY
- —
- Metro
- —
- State GDP YoY
- ▲ 1.59%
- F500 in state
- 60
Industry mix (Fortune 500 HQ in IL)
| Industry | F500 HQs | Revenue |
|---|---|---|
| Insurance | 4 | $201B |
|
||
| Consumer Goods | 4 | $87B |
|
||
| Industrial Machinery | 3 | $64B |
|
||
| Healthcare | 2 | $55B |
|
||
| Retail / Pharmacy | 1 | $148B |
|
||
| Agriculture / Food | 1 | $86B |
|
||
Price history
+7.3% since first listed13 events — show timeline
- 2026-03-13 Relisted — MRED as Distributed by MLS Grid
- 2026-03-10 Contingent — MRED as Distributed by MLS Grid
- 2026-03-04 Relisted — MRED as Distributed by MLS Grid
- 2026-03-04 Price Changed $220,000 MRED as Distributed by MLS Grid
- 2026-02-28 Contingent — MRED as Distributed by MLS Grid
- 2026-01-30 Listed $205,000 MRED as Distributed by MLS Grid
- 2025-10-31 Listing Removed — MRED as Distributed by MLS Grid
- 2025-10-07 Price Changed — MRED as Distributed by MLS Grid
- 2025-06-04 Relisted — MRED as Distributed by MLS Grid
- 2025-04-10 Listing Removed — MRED as Distributed by MLS Grid
- 2025-04-10 Relisted — MRED as Distributed by MLS Grid
- 2025-04-08 Listing Removed — MRED as Distributed by MLS Grid
- 2025-04-04 Listed — MRED as Distributed by MLS Grid
Property tax history
+3.0%/yrLatest (2023): $6,335 · +29.2% YoY. Source: county tax records.
Cash-flow waterfall
monthlySold comps — $/sqft
last 12 mo · ≤1 miLoading sold comps…