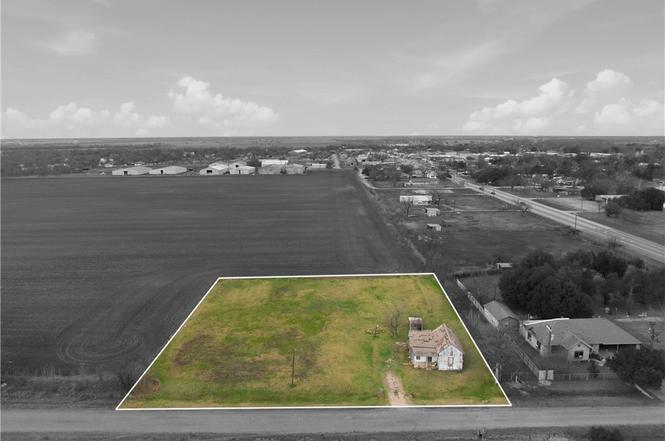
243 CR 350 · Rosebud, TX
Flood risk 1/10 · Minimal
- FEMA flood zone
- —
- Chance of flooding over 30 yrs
- 0.0%
- Est. flood insurance / yr
- —
Fire risk 3/10 · Minor
- Est. fire insurance / yr
- $1,222 – $2,270
Heat risk 8/10 · Major
- Hot days now (above 109°F)
- 7 days/yr
- Hot days in 30 yrs
- 24 days/yr
Wind risk 8/10 · Major
- Chance of severe wind over 30 yrs
- 80.0%
Air-quality risk 1/10 · Minimal
- Unhealthy air days now
- 0 days/yr
- Unhealthy air days in 30 yrs
- 0 days/yr
Risk factors via First Street. Map © Google.
Why this score? — see what drove the C+ grade
The composite is a weighted blend of 9 inputs, each scored 0–100. Each bar is that input's sub-score; the figure is the points it added to the 100-point composite (weight × sub-score).
- Cash flow +22.8/30.0
- ARV discount +7.5/15.0
- DSCR +7.3/10.0
- 1% rule +5.8/10.0
- Appreciation +5.8/10.0
- Livability +3.2/5.0
- Schools +2.7/10.0
- Rent growth +2.5/5.0
- Condition / age +2.5/5.0
$57,500
🖨 Deal sheet 📄 Offer letter ✓ Due diligence
Listing remarks
THIS ONE ACRE TRACT COMES READY WITH A CITY OF ROSEBUD WATER METER AND ELECTRICITY. SITTING ON THE OUTSKIRTS OF TOWN THIS PROPERTY IS TAILORED FOR THOSE SEEKING SIMPLICITY AND NATURAL BEAUTY. CURRENTLY THERE IS A ONE BEDROOM ONE BATH HOME ON THE PROPERTY THAT IS READY FOR YOUR VISION TO BECOME A REALITY. POSSIBILITES VARY FROM INVESTMENT TO WEEKEND GETAWAY OR YOUR FULL TIME RESIDENCE. IMMERSE YOURSELF IN THE UNIQUE CHARM OF YOUR NEXT PROPERTY TODAY.
Key facts
- One acre tract
- Electricity
- Outskirts of town
Tags
Neighborhood map
What this means for you Summary
Snapshot
- This is a 1-bed/1.0-bath single-family listed at $58k.
Deal economics
- At list price, monthly cash flow is $99 ($1k/yr) — positive.
- The deal already cash-flows at list — no discount required.
- Meets the 1% rule at list price ($622 rent vs $58k).
- Recommended offer: $57k (1.5% below list) — sets the bar for market timing.
Location & tenants
- Location reads 64/100 on livability (#732 in TX) — a middle-class / working-renter tenant base. Strengths: crime A+, cost of living A+, housing A+; Watch: employment D, schools F, amenities F.
- Rosebud-Lott ISD (rural): math 29% / reading 35% proficiency, ranked #592 of 826 in TX (top 72%) — families likely to look elsewhere, expect single-tenant / working-renter base with shorter leases; 61% free/reduced lunch — lower-income household profile, screen leases tightly.
- Market conditions: 27 active listings in the ZIP; 1 comparable units currently listed for rent nearby; 4 units permitted in Falls County in 2024 (0 in 5+ unit buildings).
Forward outlook
- In year one you build about $1k of equity ($398 loan paydown + $954 appreciation (1.7% local appreciation)).
- Falls County population projected at -14% by 2050 — secular population decline; favor cash flow + early exit over multi-decade hold.
- At projected returns (1.7% appreciation + 3.0% rent growth), your $16k cash investment doubles in ~6 years — after that, you're playing with house money.
Negotiation context
- It's been on market 19 days — a 2% lower offer ($57k) is reasonable based on typical stale-listing flexibility.
- 2 sale attempts with the ask held roughly flat each time — persistent listings suggest the price (not the market) is what's stuck; bring a comps-based counter.
Risks & watch-outs
- Climate carrying-cost: severe wind risk, 80% chance of damaging wind over 30y; extreme-heat days projected 7→24/yr by 2055 (HVAC capex compounding) — expect insurance premiums to compound above CPI over the hold.
Questions for the listing agent
- Is there a deadline driving the sale (1031 exchange, divorce, estate, relocation)? That informs how much negotiation room exists.
- Schools are F-rated, which usually means shorter tenancies and higher turnover. Who's the typical renter profile here, and what's been the actual vacancy rate?
- What's the average days-on-market for RENTAL listings here right now (not sales)? A rising rental-DOM trend means longer vacancies and softer asking-rent achievability than the comps imply.
- What's the recent tenant-quality profile in this submarket — average credit score on applications, eviction rate, late-payment / NSF rate, and stable-employment percentage? A property-management company in the area should have these aggregated.
- How much new for-sale + rental construction is in the pipeline within 1–3 miles? Heavy new supply typically softens prices + rents 12–24 months out; constrained supply supports both.
Investment metrics
- 1% rule
- 1.08% ✓
- Cap rate
- 8.37%
- Cash-on-cash
- 7.41%
- DSCR
- 1.33
- GRM
- 7.7
CMA / ARV
- ARV (on-the-fly)
- $135,590
- Comps found
- 1
Show comp detail 1 sale within ~0.75 mi
| Address | Dist | Beds/Ba | Sqft | Sold | Price | $/sf | Match |
|---|---|---|---|---|---|---|---|
| 111 S Oak St | 0.63mi | 1/1.0 | 660 (-11%) | 10mo | $120,000 | $182 | 43 |
Match score weights: distance 35% · size 25% · config 20% · recency 20%. Top-matched comps best support the ARV.
Projected returns pro-forma
1.66% appreciation · 3.0% rent growth · sell at horizon
- IRR
- 10.9%
- Equity multiple
- 1.58×
- Total profit
- $9,297
- Equity at exit
- $21,629
- IRR
- 14.1%
- Equity multiple
- 2.83×
- Total profit
- $29,455
- Equity at exit
- $30,358
Cash invested: $16,100 (down + closing). Projections, not guarantees.
Landlord ↔ Tenant lean methodology
- Overall (STATE)
- 87 Strongly Landlord-Friendly
- State Texas
- 87 Strongly Landlord-Friendly · R+5
- County
- — inherits STATE
- City
- — inherits STATE
ZIP-level market 76570
- Home prices YoY
- 1.0%
- Active inventory
- 27
- Price-to-rent
- 7.7×
Monthly cashflow live
- Estimated rent
- $622 medium interval (Pro) →
- Mortgage (P&I)
- −$302
- Tax from tax record
- −$66 /mo · $797/yr
- Insurance
- −$24
- HOA
- −$0
- Vacancy / Maint / Mgmt
- −$131
- Net cashflow
- $99
Break-even live
UW: 25.0% down · 7.5% · 30yr · 1.5% tax · 5.0% vac · 8.0% maint · 8.0% mgmt
Financing live
Cash to close
- Down payment
- $14,375
- Closing costs
- $1,725
- Reserves months
- —
- Total cash needed
- —
Loan-product check · same deal, 3 products live
Conventional
25% down · 7.5% · 30yr
- Down + closing
- —
- Monthly P&I
- —
- Monthly cashflow
- —
- DSCR
- —
- Eligible?
- —
Personal DTI + credit; lowest rate.
DSCR
20% down · 8.5% · 30yr
- Down + closing
- —
- Monthly P&I
- —
- Monthly cashflow
- —
- DSCR
- —
- Eligible?
- —
No personal income docs; deal must DSCR.
Hard money
10% down · 12.0% · 12mo
- Down + closing
- —
- Monthly P&I
- —
- Monthly cashflow
- —
- DSCR
- —
- Eligible?
- —
Short-term bridge; refi at stabilization.
Rent comps 1 comps
| Address | Beds | Baths | Sqft | Rent | $/sqft | DOM | Units | Dist |
|---|---|---|---|---|---|---|---|---|
| 306 West Avenue D Unit D Rosebud, TX | 1.0 | 1.0 | 700 | $622 | $0.89 | 44d | 1 | 0.55mi |
Listing history 4 events
-
2026-03-15status Pending
-
2026-03-13historical Active Under Contract
-
2026-02-24$57,500 Active
-
2026-02-24$57,500 Active
ⓘ Source: listings_history table (triggers on properties + properties_extension) + one-shot
backfill from property_details.listing_events for pre-trigger history.
Tax reassessment forecast TX · Resets to sale price
- Current annual tax
- $797 · $66/mo
- Projected year-2 tax
- $1,052 · $88/mo
- Expected delta
- +$255/yr (+$21/mo · 32.0%)
ⓘ Screening estimate from a state-policy table — verify with the county assessor before closing.
Climate risk First Street
- Flood 1/10 Low 0% chance over 30 yrs
- Wildfire 3/10 Moderate
- Heat 8/10 Severe 7 d/yr ≥109°F today · 24 d/yr by 30 yrs out
- Wind 8/10 Severe 80% chance of damaging wind over 30 yrs
- Air quality 1/10 Low 0 unhealthy d/yr today · 0 by 30 yrs out
Nearby sold comps map
Loading sold comps map…
Walkable amenities ~0.75 mi
Loading nearby amenities…
Taxation est. · year 1
- Rental income
- $7,464
- − Mortgage interest
- −$3,221
- − Property taxes
- −$797
- − Insurance
- −$288
- − Repairs & maintenance
- −$597
- − Management
- −$597
- − Depreciation
- −$1,673
- Taxable income
- $292
- Est. tax owed @ 24.0%
- −$70
- After-tax cash flow
- $1,124/yr
For passive investors: Depreciation is non-cash, so a rental often shows a tax loss while cash-flowing — sheltering income. Rental losses are passive: they offset passive income freely, and up to $25,000/yr can offset ordinary (W-2) income if you actively participate and your MAGI is under $100k (phasing out to $0 by $150k); unused losses carry forward. On sale, claimed depreciation is recaptured at up to 25%, and gains may owe capital-gains tax (a 1031 exchange can defer both). Figures are a year-1 estimate at your 24.0% rate — not tax advice; consult a CPA.
Schools (NCES district)
- District
- Rosebud-Lott ISD
- NCES district ID
- 4837900
- Math proficiency
- 29% ▼ -2.00%
- Reading proficiency
- 35% ▼ -4.00%
- Median HH income
- $37,597
- Composite
- 26.66/100
- National rank
- #7167
- State rank
- #592 of 826 in TX
Livability — Rosebud
- Score
- 64/100
- State rank
- #732
- US rank
- #13643
Category grades
Schools grade is shown separately in the Schools card above.
Census & demographics
- Population (ZIP)
- 2,506
Population outlook (Falls County) Hauer SSP2
- Today (2025)
- 15,782 people
- By 2030
- 15,209 · -3.6%
- By 2040
- 14,276 · -9.5%
- By 2050
- 13,645 · -13.5%
- By 2075
- 13,724 · -13.0%
- By 2100
- 13,005 · -17.6%
Race, ethnicity, and origin ACS 2023
- Neighborhood character
- Diverse neighborhood (Simpson 0.68)
- Race & ethnicity
- White 43% Hispanic / Latino 33% Black 16% Two or more races 14%
- Hispanic origin (detail)
- Mexican 31% Puerto Rican 1%
- Common ancestry
- Serbian 10% Lithuanian 2% Slovak 1%
- Foreign-born
- 4% · Canada
- Languages at home
- 78% English-only · Spanish 21%
Political lean MEDSL · Falls
- 2024 margin
- Solid R (+44.7) · D 27.3% · R 72.0%
- 2008→2024 swing
- -25.0pp toward R · 2008: -19.7pp · 2024: -44.7pp
- All cycles
- 2024: R+44.7 2020: R+37.1 2016: R+33.6 2012: R+24.4 2008: R+19.7
Not yet ingested
- Civics
- —
Market trends
- HPI YoY
- ▲ 1.66%
- Current HPI
- 164.6726
- Rent YoY
- —
- Metro
- —
- State GDP YoY
- ▲ 3.95%
- F500 in state
- 110
Industry mix (Fortune 500 HQ in TX)
| Industry | F500 HQs | Revenue |
|---|---|---|
| Energy | 16 | $1,198B |
|
||
| Technology | 5 | $198B |
|
||
| Engineering / Construction | 4 | $72B |
|
||
| Energy Services | 3 | $60B |
|
||
| Utilities | 3 | $41B |
|
||
| Healthcare | 2 | $330B |
|
||
Price history
+0.0% since first listed4 events — show timeline
- 2026-03-15 Pending — BCSRMLS
- 2026-03-13 Contingent — BCSRMLS
- 2026-02-24 Listed $57,500 BCSRMLS
- 2026-02-24 Listed $57,500 NTREIS
Property tax history
+14.4%/yrLatest (2025): $797 · +150.6% YoY. Source: county tax records.
Cash-flow waterfall
monthlySold comps — $/sqft
last 12 mo · ≤1 miLoading sold comps…