15219 Cliff St · Hamshire, TX
Flood risk 6/10 · Moderate
- FEMA flood zone
- X (shaded)
- Chance of flooding over 30 yrs
- 0.72%
- Est. flood insurance / yr
- $507 – $1,088
Fire risk 6/10 · Moderate
- Est. fire insurance / yr
- $1,222 – $2,270
Heat risk 9/10 · Severe
- Hot days now (above 111°F)
- 7 days/yr
- Hot days in 30 yrs
- 25 days/yr
Wind risk 9/10 · Severe
- Chance of severe wind over 30 yrs
- 99.0%
Air-quality risk 2/10 · Minimal
- Unhealthy air days now
- 1 days/yr
- Unhealthy air days in 30 yrs
- 1 days/yr
Risk factors via First Street. Map © Google.
Why this score? — see what drove the D grade
The composite is a weighted blend of 9 inputs, each scored 0–100. Each bar is that input's sub-score; the figure is the points it added to the 100-point composite (weight × sub-score).
- Cash flow +10.6/30.0
- ARV discount +7.5/15.0
- Appreciation +6.0/10.0
- Schools +3.5/10.0
- 1% rule +3.3/10.0
- DSCR +3.0/10.0
- Rent growth +2.5/5.0
- Livability +2.5/5.0
- Condition / age +2.5/5.0
$259,900
🖨 Deal sheet 📄 Offer letter ✓ Due diligence
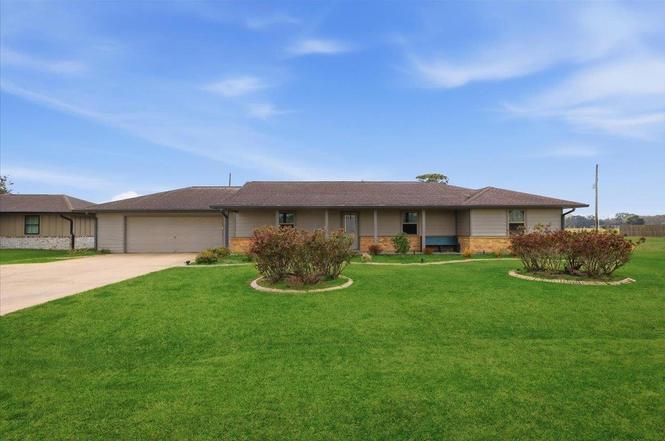
Listing remarks
Beautifully updated 3/2/2 located in Hamshire - Fannett ISD. This home offers an open concept w/ wood-like tile throughout, stainless appliance, gas range, beautiful counter tops & backsplash, custom cabinets, on-demand hot water heater, and good closet space! Spacious primary bedroom has walk-in shower, soaking tub, w/ convenient access to the utility room. Outside enjoy the large covered back patio and yard with privacy fence. Call today!
Key facts
- Custom cabinets
- Open concept
- Walk-in shower
Tags
Neighborhood map
What this means for you Summary
Snapshot
- This is a 3-bed/2.0-bath single-family listed at $260k.
Deal economics
- At list price, monthly cash flow is $-130 ($-2k/yr) — negative.
- To cash-flow at today's rent, offer at most $237k (8.9% below list).
- To meet the 1% rule (rent ≥ 1% of price), the offer needs to be $215k (17.1% below list).
- Recommended offer: $215k (17.1% below list) — sets the bar for 1% rule.
Location & tenants
- Location reads: area grade D — affects rentability + tenant quality, not the cash-flow math above.
- Hamshire-Fannett ISD (rural): math 31% / reading 46% proficiency, ranked #398 of 826 in TX (top 48%) — families likely to look elsewhere, expect single-tenant / working-renter base with shorter leases.
- Market conditions: 17 active listings in the ZIP; 343 units permitted in Jefferson County in 2024 (0 in 5+ unit buildings).
Forward outlook
- In year one you build about $7k of equity ($2k loan paydown + $5k appreciation (2.0% local appreciation)).
- By year 5, paydown + projected appreciation supports a ~$31k cash-out refi (75% LTV) — recoverable capital for the next deal without selling this one.
Negotiation context
- It's been on market 40 days — a 3% lower offer ($252k) is reasonable based on typical stale-listing flexibility.
- 6 sale attempts since 7y ago with the ask held roughly flat each time — persistent listings suggest the price (not the market) is what's stuck; bring a comps-based counter.
Risks & watch-outs
- Climate carrying-cost: major flood risk; severe wind risk, 99% chance of damaging wind over 30y; major wildfire risk; extreme-heat days projected 7→25/yr by 2055 (HVAC capex compounding) — expect insurance premiums to compound above CPI over the hold.
Questions for the listing agent
- What do current leases actually rent for vs. the listed asking? Can we see a recent rent roll and the last 12 months of T-12 income?
- It's been on market 40 days. Have you received any prior offers? Is the seller open to a 17% concession, seller financing, or rate buy-down credit?
- Is there a deadline driving the sale (1031 exchange, divorce, estate, relocation)? That informs how much negotiation room exists.
- The area grade is low — what's the realistic commute time and amenity access for the typical tenant pool here? Any planned neighborhood developments (good or bad) we should know about?
- What's the average days-on-market for RENTAL listings here right now (not sales)? A rising rental-DOM trend means longer vacancies and softer asking-rent achievability than the comps imply.
- What's the recent tenant-quality profile in this submarket — average credit score on applications, eviction rate, late-payment / NSF rate, and stable-employment percentage? A property-management company in the area should have these aggregated.
- How much new for-sale + rental construction is in the pipeline within 1–3 miles? Heavy new supply typically softens prices + rents 12–24 months out; constrained supply supports both.
Investment metrics
- 1% rule
- 0.83% ✗
- Cap rate
- 5.69%
- Cash-on-cash
- -2.15%
- DSCR
- 0.90
- GRM
- 10.1
CMA / ARV
No comps found within radius.
Projected returns pro-forma
1.98% appreciation · 3.0% rent growth · sell at horizon
- IRR
- 2.4%
- Equity multiple
- 1.13×
- Total profit
- $9,313
- Equity at exit
- $102,242
- IRR
- 6.3%
- Equity multiple
- 1.86×
- Total profit
- $62,745
- Equity at exit
- $147,023
Cash invested: $72,772 (down + closing). Projections, not guarantees.
Landlord ↔ Tenant lean methodology
- Overall (STATE)
- 87 Strongly Landlord-Friendly
- State Texas
- 87 Strongly Landlord-Friendly · R+5
- County
- — inherits STATE
- City
- — inherits STATE
ZIP-level market 77622
- Home prices YoY
- 1.1%
- Active inventory
- 17
- Price-to-rent
- 10.1×
Monthly cashflow live
- Estimated rent
- $2,155 medium interval (Pro) →
- Mortgage (P&I)
- −$1,363
- Tax from tax record
- −$362 /mo · $4,338/yr
- Insurance
- −$108
- HOA
- −$0
- Vacancy / Maint / Mgmt
- −$453
- Net cashflow
- $-130
Break-even live
UW: 25.0% down · 7.5% · 30yr · 1.5% tax · 5.0% vac · 8.0% maint · 8.0% mgmt
Financing live
Cash to close
- Down payment
- $64,975
- Closing costs
- $7,797
- Reserves months
- —
- Total cash needed
- —
Loan-product check · same deal, 3 products live
Conventional
25% down · 7.5% · 30yr
- Down + closing
- —
- Monthly P&I
- —
- Monthly cashflow
- —
- DSCR
- —
- Eligible?
- —
Personal DTI + credit; lowest rate.
DSCR
20% down · 8.5% · 30yr
- Down + closing
- —
- Monthly P&I
- —
- Monthly cashflow
- —
- DSCR
- —
- Eligible?
- —
No personal income docs; deal must DSCR.
Hard money
10% down · 12.0% · 12mo
- Down + closing
- —
- Monthly P&I
- —
- Monthly cashflow
- —
- DSCR
- —
- Eligible?
- —
Short-term bridge; refi at stabilization.
Listing history 21 events
-
2026-04-11status Pending
-
2026-03-26price $259,900
-
2026-03-10price $265,000
-
2026-03-01$270,000 Active
-
2024-03-14price $259,900
-
2023-04-10historical
-
2023-02-20price $275,000
-
2023-02-20price $275,000
-
2022-10-07$289,000 Active
-
2022-07-18$289,000 Active
-
2021-06-25soldstatus Sold
-
2021-06-25soldstatus
-
2021-06-25soldstatus
-
2021-05-04status Pending
-
2021-04-23status Option Pending
-
2021-04-22$226,380
-
2021-04-12price $226,380
-
2021-03-29$231,000 Active
-
2019-11-01soldstatus
-
2019-10-31soldstatus
-
2019-10-21$85,000
ⓘ Source: listings_history table (triggers on properties + properties_extension) + one-shot
backfill from property_details.listing_events for pre-trigger history.
Tax reassessment forecast TX · Resets to sale price
- Current annual tax
- $4,338 · $362/mo
- Projected year-2 tax
- $4,756 · $396/mo
- Expected delta
- +$418/yr (+$35/mo · 9.6%)
ⓘ Screening estimate from a state-policy table — verify with the county assessor before closing.
Climate risk First Street
- Flood 6/10 Major FEMA zone X (shaded) · 72% chance over 30 yrs
- Wildfire 6/10 Major
- Heat 9/10 Extreme 7 d/yr ≥111°F today · 25 d/yr by 30 yrs out
- Wind 9/10 Extreme 99% chance of damaging wind over 30 yrs
- Air quality 2/10 Low 1 unhealthy d/yr today · 1 by 30 yrs out
Nearby sold comps map
Loading sold comps map…
Walkable amenities ~0.75 mi
Loading nearby amenities…
Taxation est. · year 1
- Rental income
- $25,858
- − Mortgage interest
- −$14,558
- − Property taxes
- −$4,338
- − Insurance
- −$1,300
- − Repairs & maintenance
- −$2,069
- − Management
- −$2,069
- − Depreciation
- −$7,561
- Taxable loss
- −$6,036
- Est. tax savings @ 24.0%
- +$1,449
- After-tax cash flow
- $-117/yr
For passive investors: Depreciation is non-cash, so a rental often shows a tax loss while cash-flowing — sheltering income. Rental losses are passive: they offset passive income freely, and up to $25,000/yr can offset ordinary (W-2) income if you actively participate and your MAGI is under $100k (phasing out to $0 by $150k); unused losses carry forward. On sale, claimed depreciation is recaptured at up to 25%, and gains may owe capital-gains tax (a 1031 exchange can defer both). Figures are a year-1 estimate at your 24.0% rate — not tax advice; consult a CPA.
Schools (NCES district)
- District
- Hamshire-Fannett ISD
- NCES district ID
- 4822320
- Math proficiency
- 31% ▼ -18.00%
- Reading proficiency
- 46% ▼ -5.00%
- Median HH income
- $64,626
- Composite
- 34.59/100
- National rank
- #5160
- State rank
- #398 of 826 in TX
Livability — Hamshire
No livability data for this city. (Only ~50 U.S. cities are tracked.)
Census & demographics
- Population (ZIP)
- 1,799
Population outlook (Jefferson County) Hauer SSP2
- Today (2025)
- 259,015 people
- By 2030
- 260,685 · +0.6%
- By 2040
- 263,309 · +1.7%
- By 2050
- 265,237 · +2.4%
- By 2075
- 270,193 · +4.3%
- By 2100
- 255,628 · -1.3%
Race, ethnicity, and origin ACS 2023
- Neighborhood character
- Predominantly White (89%)
- Race & ethnicity
- White 89% Two or more races 11% Hispanic / Latino 10%
- Hispanic origin (detail)
- Mexican 10%
- Common ancestry
- Lithuanian 18% Serbian 4% Subsaharan African 1%
- Foreign-born
- 3% · Canada
- Languages at home
- 95% English-only · Spanish 5%
Political lean MEDSL · Jefferson
- 2024 margin
- Lean R (+8.9) · D 45.1% · R 54.0%
- 2008→2024 swing
- -11.1pp toward R · 2008: 2.2pp · 2024: -8.9pp
- All cycles
- 2024: R+8.9 2020: R+1.6 2016: R+0.5 2012: D+1.6 2008: D+2.2
Not yet ingested
- Civics
- —
Market trends
- HPI YoY
- ▲ 1.98%
- Current HPI
- 179.7969
- Rent YoY
- —
- Metro
- —
- State GDP YoY
- ▲ 3.95%
- F500 in state
- 110
Industry mix (Fortune 500 HQ in TX)
| Industry | F500 HQs | Revenue |
|---|---|---|
| Energy | 16 | $1,198B |
|
||
| Technology | 5 | $198B |
|
||
| Engineering / Construction | 4 | $72B |
|
||
| Energy Services | 3 | $60B |
|
||
| Utilities | 3 | $41B |
|
||
| Healthcare | 2 | $330B |
|
||
Price history
+205.8% since first listed21 events — show timeline
- 2026-04-11 Pending — BBOR
- 2026-03-26 Price Changed $259,900 BBOR
- 2026-03-10 Price Changed $265,000 BBOR
- 2026-03-01 Listed $270,000 BBOR
- 2024-03-14 Price Changed $259,900 BBOR
- 2023-04-10 Listing Removed — HARMLS
- 2023-02-20 Price Changed $275,000 HARMLS
- 2023-02-20 Price Changed $275,000 BBOR
- 2022-10-07 Listed $289,000 BBOR
- 2022-07-18 Listed $289,000 HARMLS
- 2021-06-25 Sold (Public Records) — Public Records
- 2021-06-25 Sold (MLS) — BBOR
- 2021-06-25 Sold (MLS) — HARMLS
- 2021-05-04 Pending — HARMLS
- 2021-04-23 Pending — HARMLS
- 2021-04-22 Listed $226,380 BBOR
- 2021-04-12 Price Changed $226,380 HARMLS
- 2021-03-29 Listed $231,000 HARMLS
- 2019-11-01 Sold (Public Records) — Public Records
- 2019-10-31 Sold (MLS) — BBOR
- 2019-10-21 Listed $85,000 BBOR
Property tax history
+5.0%/yrLatest (2025): $4,338 · +4.4% YoY. Source: county tax records.
Cash-flow waterfall
monthlySold comps — $/sqft
last 12 mo · ≤1 miLoading sold comps…