1011 Shadwell · San Antonio, TX
Flood risk 1/10 · Minimal
- FEMA flood zone
- X (unshaded)
- Chance of flooding over 30 yrs
- 0.0%
- Est. flood insurance / yr
- $507 – $1,088
Fire risk 1/10 · Minimal
- Est. fire insurance / yr
- $1,222 – $2,270
Heat risk 8/10 · Major
- Hot days now (above 108°F)
- 7 days/yr
- Hot days in 30 yrs
- 21 days/yr
Wind risk 8/10 · Major
- Chance of severe wind over 30 yrs
- 80.0%
Air-quality risk 2/10 · Minimal
- Unhealthy air days now
- 1 days/yr
- Unhealthy air days in 30 yrs
- 1 days/yr
Risk factors via First Street. Map © Google.
Why this score? — see what drove the B- grade
The composite is a weighted blend of 9 inputs, each scored 0–100. Each bar is that input's sub-score; the figure is the points it added to the 100-point composite (weight × sub-score).
- Cash flow +30.0/30.0
- 1% rule +10.0/10.0
- DSCR +10.0/10.0
- ARV discount +7.5/15.0
- Livability +4.0/5.0
- Rent growth +3.7/5.0
- Condition / age +2.5/5.0
- Schools +1.4/10.0
- Appreciation +0.0/10.0
$72,000
🖨 Deal sheet 📄 Offer letter ✓ Due diligence
Listing remarks
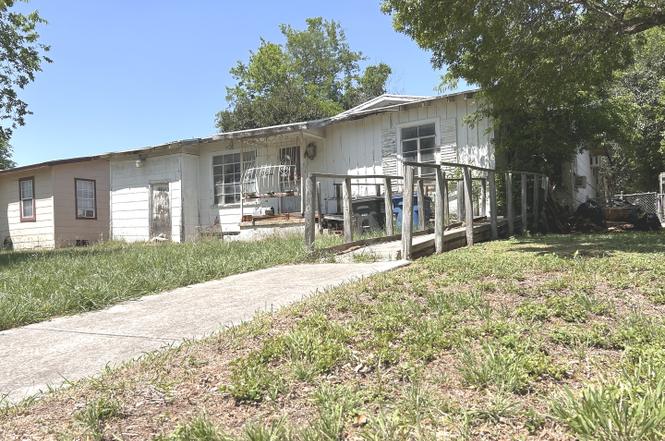
Unlock the Potential of this 1960 Contemporary Home! This 3/2 (three-bedroom, two-bathrooms) house is a sleeping gem awaiting a new owner to discover and restore it to its former glory. Built in 1960, it features 1282 square feet, a unique contemporary design, but needs full rehabilitation after standing vacant and ignored for years. The property has a spacious backyard. Imagine transforming the spacious rooms into your dream space in a friendly Donaldson neighborhood close to parks and amenities. This is a fantastic opportunity for investors or anyone looking to create their perfect home. Don't miss your chance to capitalize and breathe new life into this hidden gem. Schedule your showings
Key facts
- Close to parks
- Spacious backyard
- 8,232 sq ft lot
Tags
Property features AI
Finance
- Other: Possession at closing/funding; For sale (not a short sale)
- Financial info: Down payment resources available
- HOA & community: Subdivision: DONALDSON TERRACE
Exterior
- Parking: Converted garage
- Utilities: City water; City garbage service; Other utility supplier: unknown; No gas supplier listed; No electricity supplier listed; No sewer supplier listed
- Home design: Pre-owned single-family property; Approximate age: 64 years
- Construction: Asbestos shingle and wood exterior; Composition roof
- Exterior features: Wire fence; Level lot; Lot improvements include asphalt and city street access; Lot dimensions approx. 55 x 150; Front exposure faces east
Interior
- Kitchen: Stove/Range; Kitchen approx. 14 x 15
- Bedrooms: Master bedroom on lower level (approx. 12 x 12); Bedroom 2 (approx. 10 x 10); Bedroom 3 (approx. 10 x 10)
- Flooring: Carpeting; Wood floors; Other (see remarks)
- Bathrooms: Two full bathrooms; Master bath with tub/shower combination (approx. 12 x 12)
- Heating & cooling: Other heating (see remarks); Other heating fuel (see remarks); 3+ window air conditioning units
- Interior features: Eat-in kitchen; Converted garage (now living area)
Neighborhood map
What this means for you Summary
Snapshot
- This is a 3-bed/2.0-bath single-family listed at $72k.
Deal economics
- At list price, monthly cash flow is $555 ($7k/yr) — positive.
- The deal already cash-flows at list — no discount required.
- Meets the 1% rule at list price ($2k rent vs $72k).
- Recommended offer: $63k (12.0% below list) — sets the bar for market timing.
- Cap rate 15.5% vs local median 3.8% in San Antonio — top-decile yield for the area; either an underpriced asset or a hidden risk that comps aren't pricing in. Stress-test before assuming the spread holds.
Location & tenants
- Location reads 80/100 on livability (#31 in TX, #1,616 nationally) — a professional / high-income tenant draw. Strengths: amenities A+, commute A+, cost of living A+; Watch: crime F.
- San Antonio ISD (urban): math 12% / reading 22% proficiency, ranked #805 of 826 in TX (top 98%) — low school quality limits family demand, transient renter base, plan for 1-2y turnover; 80% free/reduced lunch — lower-income household profile, screen leases tightly.
- Zoned schools: Woodlawn Hills El (math 12% / reading 17%, grade F, #4,048 of 4,322 statewide, top 95%, 437 students, 91% FRL, charter); Jefferson H S (math 28% / reading 30%, grade F, #1,147 of 1,632 statewide, top 71%, 1,686 students, 87% FRL, charter).
- Market conditions: Rents rising fast (+4.9%/yr); 91 active listings in the ZIP; 40 comparable units currently listed for rent nearby; rentals at typical pace (median 24d on market — plan ~3-4 weeks tenant-placement turnaround); 8,308 units permitted in Bexar County in 2024 (2,506 in 5+ unit buildings).
- This rent runs 36% of the median local income ($53k/yr) — at the standard rent-burdened threshold; future hikes will face affordability resistance.
Forward outlook
- Local home prices are declining (-3.0%/yr); year-one equity from $498 of loan paydown is wiped out by about $2k of value loss. Plan a longer hold.
- Bexar County population projected at +50% by 2050 — long-run rental-demand tailwind backs the buy-and-hold thesis.
- At projected returns (-3.0% appreciation + 4.9% rent growth), your $20k cash investment doubles in ~4 years — after that, you're playing with house money.
Negotiation context
- It's been on market 358 days — a 12% lower offer ($63k) is reasonable based on typical stale-listing flexibility.
- 6 sale attempts since 2y ago; this cycle's ask has dropped $6k (8%) from the opening price — seller is motivated, your offer sets the floor, not the list.
Risks & watch-outs
- Watch-outs: property tax is 4.7% of price.
- Climate carrying-cost: severe wind risk, 80% chance of damaging wind over 30y; extreme-heat days projected 7→21/yr by 2055 (HVAC capex compounding) — expect insurance premiums to compound above CPI over the hold.
Questions for the listing agent
- It's been on market 358 days. Have you received any prior offers? Is the seller open to a 12% concession, seller financing, or rate buy-down credit?
- Built in 1962 — when were the roof, HVAC, electrical panel, plumbing, and water heater last replaced?
- Property tax is high relative to price — has the assessment been appealed recently, and will the sale trigger a re-assessment?
- Why hasn't it sold? Are there any deal-killer items the seller is aware of (foundation, flood, title, zoning, code violations)?
- Is there a deadline driving the sale (1031 exchange, divorce, estate, relocation)? That informs how much negotiation room exists.
- Crime grade is F in this area — have there been break-ins, vandalism, or insurance claims at this property in the last 3 years? What carrier currently insures it and at what premium?
- What's the average days-on-market for RENTAL listings here right now (not sales)? A rising rental-DOM trend means longer vacancies and softer asking-rent achievability than the comps imply.
- What's the recent tenant-quality profile in this submarket — average credit score on applications, eviction rate, late-payment / NSF rate, and stable-employment percentage? A property-management company in the area should have these aggregated.
- How much new for-sale + rental construction is in the pipeline within 1–3 miles? Heavy new supply typically softens prices + rents 12–24 months out; constrained supply supports both.
Investment metrics
- 1% rule
- 2.18% ✓
- Cap rate
- 15.54%
- Cash-on-cash
- 33.01%
- DSCR
- 2.47
- GRM
- 3.8
CMA / ARV
- ARV (on-the-fly)
- $205,120
- Comps found
- 12
Show comp detail 12 sales within ~0.75 mi
| Address | Dist | Beds/Ba | Sqft | Sold | Price | $/sf | Match |
|---|---|---|---|---|---|---|---|
| 1118 Shadwell | 0.17mi | 3/2.0 | 1,241 (-3%) | 6mo | $259,000 | $209 | 82 |
| 1109 Shadwell Dr | 0.15mi | 3/2.0 | 1,344 (+5%) | 4mo | $215,000 | $160 | 82 |
| 1039 Alexander Hamilton | 0.10mi | 3/2.0 | 1,227 (-4%) | 9mo | $179,999 | $147 | 81 |
| 1019 Alexander Hamilton | 0.07mi | 3/1.5 | 1,362 (+6%) | 5mo | $145,000 | $106 | 80 |
| 903 John Page | 0.19mi | 3/2.0 | 1,368 (+7%) | 6mo | $282,500 | $207 | 75 |
| 406 John Page | 0.43mi | 3/2.0 | 1,275 (-0%) | 9mo | $220,000 | $173 | 72 |
| 310 Montpelier | 0.34mi | 3/2.0 | 1,378 (+8%) | 9mo | $325,000 | $236 | 64 |
| 627 Bexar | 0.22mi | 2/1.0 (-1) | 1,366 (+7%) | 7mo | $99,900 | $73 | 64 |
| 628 Bexar | 0.25mi | 4/2.0 (+1) | 1,111 (-13%) | 7mo | $163,500 | $147 | 55 |
| 138 Palm Dr | 0.67mi | 3/2.0 | 1,382 (+8%) | 8mo | $177,900 | $129 | 49 |
| 1133 Donaldson Ave | 0.63mi | 3/1.0 | 1,408 (+10%) | 5mo | $199,500 | $142 | 46 |
| 358 Meredith | 0.75mi | 2/1.0 (-1) | 1,344 (+5%) | 6mo | $285,000 | $212 | 44 |
Match score weights: distance 35% · size 25% · config 20% · recency 20%. Top-matched comps best support the ARV.
Projected returns pro-forma
-3.0% appreciation · 4.92% rent growth · sell at horizon
- IRR
- 30.8%
- Equity multiple
- 2.33×
- Total profit
- $26,890
- Equity at exit
- $10,735
- IRR
- 39.3%
- Equity multiple
- 5.10×
- Total profit
- $82,677
- Equity at exit
- $6,225
Cash invested: $20,160 (down + closing). Projections, not guarantees.
Landlord ↔ Tenant lean methodology
- Overall (STATE)
- 87 Strongly Landlord-Friendly
- State Texas
- 87 Strongly Landlord-Friendly · R+5
- County
- — inherits STATE
- City
- — inherits STATE
ZIP-level market 78228
- Home prices YoY
- -22.1%
- Rents YoY
- 4.9%
- Active inventory
- 91
- Price-to-rent
- 3.8×
Monthly cashflow live
- Estimated rent
- $1,572 high interval (Pro) →
- Mortgage (P&I)
- −$378
- Tax from tax record
- −$280 /mo · $3,359/yr
- Insurance
- −$30
- HOA
- −$0
- Vacancy / Maint / Mgmt
- −$330
- Net cashflow
- $555
Break-even live
UW: 25.0% down · 7.5% · 30yr · 1.5% tax · 5.0% vac · 8.0% maint · 8.0% mgmt
Financing live
Cash to close
- Down payment
- $18,000
- Closing costs
- $2,160
- Reserves months
- —
- Total cash needed
- —
Loan-product check · same deal, 3 products live
Conventional
25% down · 7.5% · 30yr
- Down + closing
- —
- Monthly P&I
- —
- Monthly cashflow
- —
- DSCR
- —
- Eligible?
- —
Personal DTI + credit; lowest rate.
DSCR
20% down · 8.5% · 30yr
- Down + closing
- —
- Monthly P&I
- —
- Monthly cashflow
- —
- DSCR
- —
- Eligible?
- —
No personal income docs; deal must DSCR.
Hard money
10% down · 12.0% · 12mo
- Down + closing
- —
- Monthly P&I
- —
- Monthly cashflow
- —
- DSCR
- —
- Eligible?
- —
Short-term bridge; refi at stabilization.
Rent comps 40 comps
| Address | Beds | Baths | Sqft | Rent | $/sqft | DOM | Units | Dist |
|---|---|---|---|---|---|---|---|---|
| 874 E Sunshine Dr Unit 102 San Antonio, TX | 3.0 | 2.5 | 1401 | $1,750 | $1.25 | 44d | 1 | 0.25mi |
| 606 Bexar Dr San Antonio, TX | 3.0 | 2.0 | 909 | $1,210 | $1.33 | 4d | 1 | 0.27mi |
| 939 John Page Dr San Antonio, TX | 3.0 | 2.0 | 1286 | $1,650 | $1.28 | 44d | 1 | 0.29mi |
| 1735 Donaldson Ave San Antonio, TX | 3.0 | 2.0 | 1610 | $1,650 | $1.02 | 24d | 1 | 0.32mi |
| 1735 Donaldson Ave San Antonio, TX | 3.0 | 2.0 | 1610 | $1,650 | $1.02 | 18d | 1 | 0.32mi |
| 1025 Sutton Dr San Antonio, TX | 3.0 | 1.0 | 1000 | $1,250 | $1.25 | 44d | 1 | 0.42mi |
| 1214 Donaldson Ave San Antonio, TX | 2.0 | 1.0 | 1286 | $1,800 | $1.40 | 24d | 1 | 0.56mi |
| 4042 City View Dr San Antonio, TX | 3.0 | 2.0 | 1611 | $1,650 | $1.02 | 20d | 1 | 0.61mi |
| 4042 City View Dr San Antonio, TX | 3.0 | 2.0 | 1611 | $1,650 | $1.02 | 24d | 1 | 0.61mi |
| 414 Alexander Hamilton Dr San Antonio, TX | 2.0 | 1.0 | 1277 | $1,275 | $1.00 | 44d | 1 | 0.63mi |
| 1171 Bandera Rd San Antonio, TX | 1.0–2.0 | 1.0 | 750 | $1,375 | $1.83 | 24d | 5 | 0.65mi |
| 374 Meredith Dr San Antonio, TX | 4.0 | 3.0 | 1336 | $2,100 | $1.57 | 44d | 1 | 0.69mi |
| 3807 Longridge Dr San Antonio, TX | 3.0 | 2.0 | 1680 | $2,200 | $1.31 | 44d | 1 | 0.75mi |
| 250 Senisa Dr Unit 1 San Antonio, TX | 2.0 | 1.0 | 1160 | $999 | $0.86 | 44d | 1 | 0.83mi |
| 229 Alexander Hamilton Dr San Antonio, TX | 3.0 | 1.0 | 1568 | $1,250 | $0.80 | 20d | 1 | 0.83mi |
| 229 Alexander Hamilton Dr Unit 1 San Antonio, TX | 3.0 | 1.0 | 1568 | $1,250 | $0.80 | 3d | 1 | 0.83mi |
| 234 Danville Ave San Antonio, TX | 3.0 | 1.0 | 1129 | $1,600 | $1.42 | 20d | 1 | 0.84mi |
| 3301 W Woodlawn Ave San Antonio, TX | 1.0–2.0 | 1.0 | 825 | $881 | $1.07 | 24d | 3 | 0.86mi |
| 330 W Cheryl Dr San Antonio, TX | 1.0–3.0 | 1.0–2.0 | 975 | $1,300 | $1.33 | 44d | 1 | 0.86mi |
| 351 Overhill Dr Unit MH San Antonio, TX | 3.0 | 1.0 | 1647 | $1,550 | $0.94 | 24d | 1 | 0.97mi |
| 306 Overhill Dr San Antonio, TX | 2.0 | 1.0 | 1009 | $1,200 | $1.19 | 4d | 1 | 0.98mi |
| 126 Meredith Dr San Antonio, TX | 2.0 | 1.0 | 1278 | $1,400 | $1.10 | 22d | 1 | 1.00mi |
| 119 Meredith Dr San Antonio, TX | 3.0 | 1.0 | 1408 | $1,850 | $1.31 | 44d | 1 | 1.01mi |
| 224 Marquette Dr San Antonio, TX | 2.0 | 1.0 | 984 | $1,350 | $1.37 | 24d | 1 | 1.02mi |
| 312 Babcock Rd San Antonio, TX | 2.0 | 1.0 | 1044 | $995 | $0.95 | 44d | 1 | 1.03mi |
| 135 De Chantle Rd Unit 204 San Antonio, TX | 2.0 | 2.0 | 1100 | $1,300 | $1.18 | 44d | 1 | 1.07mi |
| 135 De Chantle Rd Unit 206 San Antonio, TX | 2.0 | 1.0 | 950 | $1,200 | $1.26 | 44d | 1 | 1.07mi |
| 2903 Hillcrest Dr San Antonio, TX | 1.0–3.0 | 1.0–2.0 | 962 | $1,400 | $1.45 | 2d | 16 | 1.12mi |
| 1046 Hillcrest Dr San Antonio, TX | 4.0 | 2.0 | 1546 | $1,650 | $1.07 | 44d | 1 | 1.12mi |
| 415 North Dr San Antonio, TX | 4.0 | 2.0 | 1795 | $1,600 | $0.89 | 20d | 1 | 1.14mi |
| 210 Laddie Pl San Antonio, TX | 3.0 | 1.0 | 1226 | $1,550 | $1.26 | 3d | 1 | 1.15mi |
| 210 Laddie Pl San Antonio, TX | 3.0 | 1.0 | 1226 | $1,575 | $1.28 | 24d | 1 | 1.15mi |
| 734 Donaldson Ave Unit B San Antonio, TX | 2.0 | 1.0 | 910 | $910 | $1.00 | 3d | 1 | 1.21mi |
| 734 Donaldson Ave Unit D San Antonio, TX | 2.0 | 1.0 | 910 | $915 | $1.01 | 12d | 1 | 1.22mi |
| 2443 W Huisache Ave Unit 1 San Antonio, TX | 2.0 | 1.0 | 1200 | $1,100 | $0.92 | 44d | 1 | 1.22mi |
| 520 Gentleman Rd Unit 4 Balcones Heights, TX | 2.0 | 1.0 | 1026 | $975 | $0.95 | 12d | 1 | 1.23mi |
| 520 Gentleman Rd Unit 20 Balcones Heights, TX | 2.0 | 2.5 | 1240 | $1,075 | $0.87 | 4d | 1 | 1.23mi |
| 4216 Fredericksburg Rd Balcones Heights, TX | 2.0 | 2.0 | 1025 | $1,300 | $1.27 | 24d | 1 | 1.24mi |
| 127 Riverdale Dr San Antonio, TX | 3.0 | 1.0 | 1032 | $1,100 | $1.07 | 12d | 1 | 1.24mi |
| 3156 W French Pl San Antonio, TX | 2.0 | 2.0 | 1100 | $1,150 | $1.05 | 44d | 1 | 1.24mi |
Listing history 25 events
-
2026-06-10status $72,000 Pending 358 DOM
-
2026-06-09days on market $72,000 Active 358 DOM
-
2026-06-08days on market $72,000 Active 357 DOM
-
2026-06-07days on market $72,000 Active 356 DOM
-
2026-06-04days on market $72,000 Active 353 DOM
-
2026-06-03days on market $72,000 Active 352 DOM
-
2026-06-02days on market $72,000 Active 351 DOM
-
2026-06-01days on market $72,000 Active 350 DOM
-
2026-05-31statusdays on market $72,000 Active 349 DOM
-
2026-05-20status Back on Market
-
2026-04-17status Pending SB
-
2025-11-25status Back on Market
-
2025-11-08status Pending
-
2025-10-18price $72,000
-
2025-10-18status Back on Market
-
2025-10-07historical
-
2025-04-17$78,000 New
-
2025-02-07status Pending
-
2025-02-07historical
-
2025-02-04price $78,999
-
2025-02-04status Back on Market
-
2024-11-27status Pending
-
2024-11-16price $89,000
-
2024-11-06$99,000 New
-
1984-05-01soldstatus
ⓘ Source: listings_history table (triggers on properties + properties_extension) + one-shot
backfill from property_details.listing_events for pre-trigger history.
Tax reassessment forecast TX · Resets to sale price
- Current annual tax
- $3,359 · $280/mo
- Projected year-2 tax
- $3,359 · $280/mo
- Expected delta
- $0/yr ($0/mo · 0.0%)
ⓘ Screening estimate from a state-policy table — verify with the county assessor before closing.
Climate risk First Street
- Flood 1/10 Low FEMA zone X (unshaded) · 0% chance over 30 yrs
- Wildfire 1/10 Low
- Heat 8/10 Severe 7 d/yr ≥108°F today · 21 d/yr by 30 yrs out
- Wind 8/10 Severe 80% chance of damaging wind over 30 yrs
- Air quality 2/10 Low 1 unhealthy d/yr today · 1 by 30 yrs out
Nearby sold comps map
Loading sold comps map…
Walkable amenities ~0.75 mi
Loading nearby amenities…
Taxation est. · year 1
- Rental income
- $18,867
- − Mortgage interest
- −$4,033
- − Property taxes
- −$3,359
- − Insurance
- −$360
- − Repairs & maintenance
- −$1,509
- − Management
- −$1,509
- − Depreciation
- −$2,095
- Taxable income
- $6,001
- Est. tax owed @ 24.0%
- −$1,440
- After-tax cash flow
- $5,215/yr
For passive investors: Depreciation is non-cash, so a rental often shows a tax loss while cash-flowing — sheltering income. Rental losses are passive: they offset passive income freely, and up to $25,000/yr can offset ordinary (W-2) income if you actively participate and your MAGI is under $100k (phasing out to $0 by $150k); unused losses carry forward. On sale, claimed depreciation is recaptured at up to 25%, and gains may owe capital-gains tax (a 1031 exchange can defer both). Figures are a year-1 estimate at your 24.0% rate — not tax advice; consult a CPA.
Schools (NCES district)
- District
- San Antonio ISD
- NCES district ID
- 4838730
- Math proficiency
- 12% ▼ -21.00%
- Reading proficiency
- 22% ▼ -7.00%
- Median HH income
- $30,952
- Composite
- 13.57/100
- National rank
- #9512
- State rank
- #805 of 826 in TX
Livability — San Antonio
- Score
- 80/100
- State rank
- #31
- US rank
- #1616
Category grades
Schools grade is shown separately in the Schools card above.
Census & demographics
- Census place
- San Antonio, TX
- County
- Bexar County · 1,990,555 people
- City population
- 1,806,925
- Metro
- San Antonio-New Braunfels, TX
- Population (ZIP)
- 56,165
- Household income
- $52,976
- Rent vs Own
- Severe rent burden
- 2709.0
Population outlook (Bexar County) Hauer SSP2
- Today (2025)
- 2,336,851 people
- By 2030
- 2,560,728 · +9.6%
- By 2040
- 3,020,569 · +29.3%
- By 2050
- 3,493,522 · +49.5%
- By 2075
- 4,668,459 · +99.8%
- By 2100
- 5,533,242 · +136.8%
Race, ethnicity, and origin ACS 2023
- Neighborhood character
- Predominantly Hispanic (88%)
- Race & ethnicity
- Hispanic / Latino 88% Two or more races 43% White 8% Black 2%
- Hispanic origin (detail)
- Mexican 80%
- Common ancestry
- Italian 1% Lithuanian 1%
- Foreign-born
- 15% · Canada
- Languages at home
- 46% English-only · Spanish 53% Other Indo-European 1%
Political lean MEDSL · Bexar
- 2024 margin
- Lean D (+9.8) · D 54.3% · R 44.6% · Other 1.1%
- 2008→2024 swing
- +4.2pp toward D · 2008: 5.6pp · 2024: 9.8pp
- All cycles
- 2024: D+9.8 2020: D+18.2 2016: D+13.5 2012: D+4.6 2008: D+5.6
Not yet ingested
- Civics
- —
Market trends
- HPI YoY
- ▼ -74.04%
- Current HPI
- 261.1558
- Rent YoY
- ▲ 4.92%
- Metro
- San Antonio-New Braunfels, TX
- State GDP YoY
- ▲ 3.95%
- F500 in state
- 110
Industry mix (Fortune 500 HQ in TX)
| Industry | F500 HQs | Revenue |
|---|---|---|
| Energy | 16 | $1,198B |
|
||
| Technology | 5 | $198B |
|
||
| Engineering / Construction | 4 | $72B |
|
||
| Energy Services | 3 | $60B |
|
||
| Utilities | 3 | $41B |
|
||
| Healthcare | 2 | $330B |
|
||
Price history
-27.3% since first listed16 events — show timeline
- 2026-05-20 Relisted — LERA
- 2026-04-17 Pending — LERA
- 2025-11-25 Relisted — LERA
- 2025-11-08 Pending — LERA
- 2025-10-18 Price Changed $72,000 LERA
- 2025-10-18 Relisted — LERA
- 2025-10-07 Listing Removed — LERA
- 2025-04-17 Listed $78,000 LERA
- 2025-02-07 Pending — LERA
- 2025-02-07 Listing Removed — LERA
- 2025-02-04 Price Changed $78,999 LERA
- 2025-02-04 Relisted — LERA
- 2024-11-27 Pending — LERA
- 2024-11-16 Price Changed $89,000 LERA
- 2024-11-06 Listed $99,000 LERA
- 1984-05-01 Sold (Public Records) — Public Records
Property tax history
+5.5%/yrLatest (2025): $3,359 · +1.1% YoY. Source: county tax records.
Cash-flow waterfall
monthlySold comps — $/sqft
last 12 mo · ≤1 miLoading sold comps…