1930 American Park Dr · West Valley City, UT
Flood risk 1/10 · Minimal
- FEMA flood zone
- X (unshaded)
- Chance of flooding over 30 yrs
- 0.0%
- Est. flood insurance / yr
- $507 – $1,088
Fire risk 1/10 · Minimal
- Est. fire insurance / yr
- $453 – $841
Heat risk 4/10 · Minor
- Hot days now (above 95°F)
- 6 days/yr
- Hot days in 30 yrs
- 15 days/yr
Wind risk 1/10 · Minimal
- Chance of severe wind over 30 yrs
- —
Air-quality risk 4/10 · Minor
- Unhealthy air days now
- 5 days/yr
- Unhealthy air days in 30 yrs
- 6 days/yr
Risk factors via First Street. Map © Google.
Why this score? — see what drove the D+ grade
The composite is a weighted blend of 9 inputs, each scored 0–100. Each bar is that input's sub-score; the figure is the points it added to the 100-point composite (weight × sub-score).
- Cash flow +15.7/30.0
- 1% rule +10.0/10.0
- ARV discount +7.5/15.0
- DSCR +4.8/10.0
- Livability +3.8/5.0
- Condition / age +2.8/5.0
- Rent growth +2.7/5.0
- Schools +2.6/10.0
- Appreciation +0.0/10.0
$65,000
🖨 Deal sheet 📄 Offer letter ✓ Due diligence
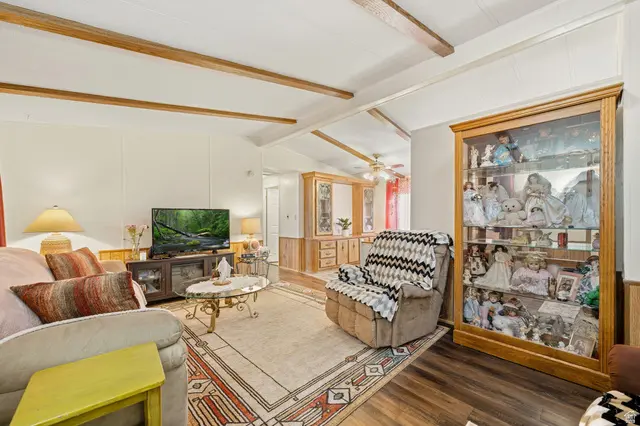
Listing remarks
Charming 3 bedroom, 2 bathroom home with a 2 car carport and a bright open concept floor plan connecting the living room, dining area, and kitchen under vaulted ceilings. The kitchen features a gas stove, and all kitchen appliances are included. Important updates include a 3 year old water heater, 1 year old furnace, A/C, and a 5 year old roof. A wood shed is also included for added storage. The yard is filled with beautiful, established landscaping including trumpet vine that draws hummingbirds, lilacs, and Rose of Sharon, offering a lovely outdoor setting to enjoy. 55+ community; 1 person needs to be over 55 to live here. Square footage figures are provided as a courtesy estimate only and
Key facts
- A/c
- Gas stove
- 1 year old furnace
Tags
Property features AI
Finance
- Other: Above-grade finished living area reported
- HOA & community: Homeowners association (Brisha) with monthly fee; Monthly association fee includes gas, sewer, trash, and water; Community clubhouse; Senior community; Pets permitted; Snow removal provided
Exterior
- Parking: Covered carport; Two covered parking spaces (two total)
- Utilities: Natural gas connected; Electricity connected; Public sewer connected; Culinary (domestic) water connected
- Home design: Manufactured home; Single story; Faces south; Residential use
- Construction: Aluminum siding; Asphalt roof; Built/standing condition
- Exterior features: Covered deck; Covered patio; Screened porch; Outbuildings; Storage shed(s); Partially fenced yard; Paved road access; Landscaped with mature trees; Flat terrain
Interior
- Kitchen: Gas range; Free-standing range/oven; Disposal; Refrigerator
- Bedrooms: Three bedrooms on the main level; Primary bedroom on the first floor
- Flooring: Carpet; Laminate; Vinyl
- Bathrooms: Two full bathrooms
- Heating & cooling: Forced air heating (gas central); Central air conditioning
- Interior features: Primary bathroom; Disposal; Gas range; Free-standing range/oven; Vaulted ceilings; Single-level living
- Laundry & utility: Washer; Dryer
Neighborhood map
What this means for you Summary
Snapshot
- This is a 3-bed/2.0-bath manufactured listed at $65k. Condition is rated average.
Deal economics
- At list price, monthly cash flow is $28 ($336/yr) — positive.
- The deal already cash-flows at list — no discount required.
- Meets the 1% rule at list price ($2k rent vs $65k).
- Recommended offer: $61k (6.0% below list) — sets the bar for market timing.
Location & tenants
- Location reads 76/100 on livability (#55 in UT, #3,285 nationally) — a middle-class / working-renter tenant base. Strengths: commute A+, housing A+, employment A-; Watch: crime D-, amenities F, health & safety D-.
- Granite District (suburban): math 26% / reading 32% proficiency, ranked #69 of 80 in UT (top 86%) — low school quality limits family demand, transient renter base, plan for 1-2y turnover.
- Zoned schools: Redwood School (math 6% / reading 8%, grade F, #583 of 585 statewide, top 100%, 486 students, 77% FRL); West Lake Jr High (math 14% / reading 22%, grade F, #132 of 138 statewide, top 96%, 701 students, 73% FRL); Granger High (math 7% / reading 22%, grade F, #167 of 171 statewide, top 98%, 3,481 students, 63% FRL) — zoned schools average 71% FRL vs 45% district-wide (26 pts higher); higher-poverty schools than district average — tighter screening recommended.
- Zoned-school proficiency averages 13% at this address vs 29% district-wide (-16 pts) — the specific schools serving this property underperform the Granite District average; the district grade overstates school quality for this exact location.
- Market conditions: Rents flat; 227 active listings in the ZIP; 19 comparable units currently listed for rent nearby; rentals leasing fast (median 5d on market — plan ~1-2 weeks tenant-placement turnaround); 4,970 units permitted in Salt Lake County in 2024 (1,963 in 5+ unit buildings).
Forward outlook
- Local home prices are declining (-3.0%/yr); year-one equity from $449 of loan paydown is wiped out by about $2k of value loss. Plan a longer hold.
- Salt Lake County population projected at +37% by 2050 — long-run rental-demand tailwind backs the buy-and-hold thesis.
Negotiation context
- It's been on market 70 days — a 6% lower offer ($61k) is reasonable based on typical stale-listing flexibility.
Risks & watch-outs
- Watch-outs: HOA is 51% of rent.
Questions for the listing agent
- It's been on market 70 days. Have you received any prior offers? Is the seller open to a 6% concession, seller financing, or rate buy-down credit?
- What does the HOA fee cover, when was the last increase, and are there any pending special assessments or reserve-fund shortfalls?
- Why hasn't it sold? Are there any deal-killer items the seller is aware of (foundation, flood, title, zoning, code violations)?
- Is there a deadline driving the sale (1031 exchange, divorce, estate, relocation)? That informs how much negotiation room exists.
- Schools are F-rated, which usually means shorter tenancies and higher turnover. Who's the typical renter profile here, and what's been the actual vacancy rate?
- Crime grade is D in this area — have there been break-ins, vandalism, or insurance claims at this property in the last 3 years? What carrier currently insures it and at what premium?
- The area grade is low — what's the realistic commute time and amenity access for the typical tenant pool here? Any planned neighborhood developments (good or bad) we should know about?
- What's the average days-on-market for RENTAL listings here right now (not sales)? A rising rental-DOM trend means longer vacancies and softer asking-rent achievability than the comps imply.
- What's the recent tenant-quality profile in this submarket — average credit score on applications, eviction rate, late-payment / NSF rate, and stable-employment percentage? A property-management company in the area should have these aggregated.
- How much new for-sale + rental construction is in the pipeline within 1–3 miles? Heavy new supply typically softens prices + rents 12–24 months out; constrained supply supports both.
Investment metrics
- 1% rule
- 2.61% ✓
- Cap rate
- 6.81%
- Cash-on-cash
- 1.85%
- DSCR
- 1.08
- GRM
- 3.2
CMA / ARV
No comps found within radius.
Projected returns pro-forma
-3.0% appreciation · 0.74% rent growth · sell at horizon
- IRR
- -19.9%
- Equity multiple
- 0.34×
- Total profit
- $-11,970
- Equity at exit
- $9,692
- IRR
- -44.2%
- Equity multiple
- -0.14×
- Total profit
- $-20,681
- Equity at exit
- $5,620
Cash invested: $18,200 (down + closing). Projections, not guarantees.
Landlord ↔ Tenant lean methodology
- Overall (STATE)
- 86 Strongly Landlord-Friendly
- State Utah
- 86 Strongly Landlord-Friendly · R+15
- County
- — inherits STATE
- City
- — inherits STATE
ZIP-level market 84119
- Rents YoY
- 0.7%
- Active inventory
- 227
- Price-to-rent
- 3.2×
Monthly cashflow live
- Estimated rent
- $1,699 high interval (Pro) →
- Mortgage (P&I)
- −$341
- Tax est. 1.5%
- −$81 /mo · $975/yr
- Insurance
- −$27
- HOA
- −$865
- Vacancy / Maint / Mgmt
- −$357
- Net cashflow
- $28
Break-even live
UW: 25.0% down · 7.5% · 30yr · 1.5% tax · 5.0% vac · 8.0% maint · 8.0% mgmt
Financing live
Cash to close
- Down payment
- $16,250
- Closing costs
- $1,950
- Reserves months
- —
- Total cash needed
- —
Loan-product check · same deal, 3 products live
Conventional
25% down · 7.5% · 30yr
- Down + closing
- —
- Monthly P&I
- —
- Monthly cashflow
- —
- DSCR
- —
- Eligible?
- —
Personal DTI + credit; lowest rate.
DSCR
20% down · 8.5% · 30yr
- Down + closing
- —
- Monthly P&I
- —
- Monthly cashflow
- —
- DSCR
- —
- Eligible?
- —
No personal income docs; deal must DSCR.
Hard money
10% down · 12.0% · 12mo
- Down + closing
- —
- Monthly P&I
- —
- Monthly cashflow
- —
- DSCR
- —
- Eligible?
- —
Short-term bridge; refi at stabilization.
Rent comps 19 comps
| Address | Beds | Baths | Sqft | Rent | $/sqft | DOM | Units | Dist |
|---|---|---|---|---|---|---|---|---|
| 1941 W Hyannis Ave Unit 1 West Valley City, UT | 2.0 | 1.5 | 1001 | $1,600 | $1.60 | 23d | 1 | 0.30mi |
| 1902 W 3395 S West Valley City, UT | 2.0 | 1.0 | 930 | $1,325 | $1.42 | 4d | 1 | 0.50mi |
| 1512 W 3395 S West Valley City, UT | 3.0 | 2.0 | 1685 | $1,745 | $1.04 | 23d | 1 | 0.67mi |
| 2553 S Lake Park Cir Apt 2 West Valley City, UT | 2.0 | 1.0 | 950 | $1,200 | $1.26 | 23d | 1 | 0.67mi |
| 2350 S Parkcrest Dr Unit 3 West Valley City, UT | 2.0 | 1.0 | 900 | $1,599 | $1.78 | 23d | 1 | 0.75mi |
| 3314 S Meadowlark Dr West Valley City, UT | 4.0 | 2.0 | 1232 | $2,350 | $1.91 | 3d | 1 | 0.87mi |
| 3600 S Orion Cir West Valley City, UT | 1.0–3.0 | 1.0–1.5 | 1075 | $2,009 | $1.87 | 23d | 1 | 0.90mi |
| 1251 W Village Main Dr West Valley City, UT | 1.0–3.0 | 1.0–2.0 | 957 | $1,700 | $1.78 | 1d | 5 | 1.01mi |
| 2930 Baty Drive 2745 S Unit 2930 West Valley City, UT | 2.0 | 1.5 | 1100 | $1,695 | $1.54 | 23d | 1 | 1.06mi |
| 1499 2320 S West Valley City, UT | 2.0 | 1.5 | 1052 | $1,512 | $1.44 | 4d | 4 | 1.07mi |
| 1538 W Kingsbury Ln West Valley City, UT | 3.0 | 3.0 | 1237 | $2,050 | $1.66 | 3d | 1 | 1.22mi |
| 3860 S Redwood Rd Salt Lake City, UT | 2.0 | 1.0–2.0 | 851 | $1,719 | $2.02 | 2d | 26 | 1.26mi |
| 2600 W 3800 S West Valley City, UT | 2.0 | 1.0–2.0 | 912 | $2,205 | $2.42 | 3d | 100 | 1.27mi |
| 3810 S Redwood Rd West Valley City, UT | 1.0–3.0 | 1.0–2.0 | 1110 | $2,149 | $1.94 | 2d | 46 | 1.28mi |
| 2835 S 3200 W Unit 2835 West Valley City, UT | 3.0 | 2.0 | 1130 | $1,600 | $1.42 | 4d | 1 | 1.29mi |
| 2640 W 3800 S Apt 3 Salt Lake City, UT | 2.0 | 1.0 | 965 | $1,125 | $1.17 | 4d | 1 | 1.34mi |
| 2640 W 3800 S West Valley City, UT | 2.0 | 1.0 | 965 | $1,125 | $1.17 | 4d | 1 | 1.34mi |
| 3043 W 3500 S West Valley City, UT | 2.0 | 1.0 | 950 | $1,149 | $1.21 | 23d | 1 | 1.34mi |
| 1580 W 3940 S Salt Lake City, UT | 1.0–2.0 | 1.0 | 921 | $1,495 | $1.62 | 2d | 7 | 1.42mi |
HOA detail
- Monthly dues
- $865 · $10,380/yr
- Likely covers
- watergaslandscaping
Listing history 17 events
-
2026-06-18days on market $65,000 Active 70 DOM
-
2026-06-17days on market $65,000 Active 69 DOM
-
2026-06-16days on market $65,000 Active 68 DOM
-
2026-06-15days on market $65,000 Active 67 DOM
-
2026-06-13days on market $65,000 Active 65 DOM
-
2026-06-09days on market $65,000 Active 61 DOM
-
2026-06-08days on market $65,000 Active 60 DOM
-
2026-06-07days on market $65,000 Active 59 DOM
-
2026-06-03days on market $65,000 Active 55 DOM
-
2026-06-02days on market $65,000 Active 54 DOM
-
2026-06-01days on market $65,000 Active 53 DOM
-
2026-05-31days on market $65,000 Active 52 DOM
-
2026-05-04price $65,000
-
2026-04-30price $69,900
-
2026-04-26price $89,900
-
2026-04-25price $94,800
-
2026-04-09$94,900 Active
ⓘ Source: listings_history table (triggers on properties + properties_extension) + one-shot
backfill from property_details.listing_events for pre-trigger history.
Climate risk First Street
- Flood 1/10 Low FEMA zone X (unshaded) · 0% chance over 30 yrs
- Wildfire 1/10 Low
- Heat 4/10 Moderate 6 d/yr ≥95°F today · 15 d/yr by 30 yrs out
- Wind 1/10 Low
- Air quality 4/10 Moderate 5 unhealthy d/yr today · 6 by 30 yrs out
Nearby sold comps map
Loading sold comps map…
Walkable amenities ~0.75 mi
Loading nearby amenities…
Taxation est. · year 1
- Rental income
- $20,388
- − Mortgage interest
- −$3,641
- − Property taxes
- −$975
- − Insurance
- −$325
- − Repairs & maintenance
- −$1,631
- − Management
- −$1,631
- − HOA
- −$10,380
- − Depreciation
- −$1,891
- Taxable loss
- −$86
- Est. tax savings @ 24.0%
- +$21
- After-tax cash flow
- $357/yr
For passive investors: Depreciation is non-cash, so a rental often shows a tax loss while cash-flowing — sheltering income. Rental losses are passive: they offset passive income freely, and up to $25,000/yr can offset ordinary (W-2) income if you actively participate and your MAGI is under $100k (phasing out to $0 by $150k); unused losses carry forward. On sale, claimed depreciation is recaptured at up to 25%, and gains may owe capital-gains tax (a 1031 exchange can defer both). Figures are a year-1 estimate at your 24.0% rate — not tax advice; consult a CPA.
Condition & rehab AI · 10 photos
This home is in average condition with cosmetic updates needed. It has a good roof and HVAC system, but dated kitchen and bathrooms. Landscaping and interior paint could also benefit from updates. The established landscaping and move-in-ready condition make it a good investment.
Repairs flagged
- Minor kitchen cabinets — Dated cabinetry needs updating.
- Minor bathroom clutter — Cluttered bathrooms need decluttering and organization.
- Minor landscaping — Overgrown areas need trimming and landscaping improvements.
Value-add opportunities
- Resale Paint interior walls — Fresh paint can make a significant difference in the home's appearance.
- Resale Replace kitchen cabinets — Modernizing the kitchen can attract more buyers.
- Rental Declutter and organize bathrooms — A clean and organized bathroom is essential for rental properties.
- Both Landscaping improvements — A well-maintained yard can increase both resale and rental value.
Renovation cost estimate screening
| Repair item | Severity | Est. cost |
|---|---|---|
| kitchen cabinets · Dated cabinetry needs updating. | Minor | $500–3,000 |
| bathroom clutter · Cluttered bathrooms need decluttering and organization. | Minor | $500–3,000 |
| landscaping · Overgrown areas need trimming and landscaping improvements. | Minor | $500–3,000 |
| Total estimated repair cost · 3 items | $1,500–9,000 |
Value-add ROI direction
- Resale Paint interior walls — Fresh paint can make a significant difference in the home's appearance. ↑
- Resale Replace kitchen cabinets — Modernizing the kitchen can attract more buyers. ↑
- Rental Declutter and organize bathrooms — A clean and organized bathroom is essential for rental properties. ↑
- Both Landscaping improvements — A well-maintained yard can increase both resale and rental value. ↑
ⓘ Cost ranges are severity-bucket heuristics (US national rule-of-thumb). Get contractor quotes + a written scope before underwriting a rehab budget.
Schools (NCES district)
- District
- Granite District
- NCES district ID
- 4900360
- Math proficiency
- 26% ▼ -8.00%
- Reading proficiency
- 32% ▼ -3.00%
- Median HH income
- $55,971
- Composite
- 25.93/100
- National rank
- #7336
- State rank
- #69 of 80 in UT
Livability — West Valley City
- Score
- 76/100
- State rank
- #55
- US rank
- #3285
Category grades
Schools grade is shown separately in the Schools card above.
Census & demographics
- Census place
- West Valley City, UT
- County
- Salt Lake County · 1,195,750 people
- City population
- 132,995
- Metro
- Salt Lake City, UT
- Population (ZIP)
- 50,070
- Household income
- $71,378
- Rent vs Own
- Severe rent burden
- 1635.0
Population outlook (Salt Lake County) Hauer SSP2
- Today (2025)
- 1,305,860 people
- By 2030
- 1,402,611 · +7.4%
- By 2040
- 1,594,533 · +22.1%
- By 2050
- 1,787,244 · +36.9%
- By 2075
- 2,224,138 · +70.3%
- By 2100
- 2,551,390 · +95.4%
Race, ethnicity, and origin ACS 2023
- Neighborhood character
- Diverse neighborhood (Simpson 0.66)
- Race & ethnicity
- Hispanic / Latino 45% White 36% Two or more races 12% Black 5% Pacific Islander 4% Asian 4% Native American 3%
- Hispanic origin (detail)
- Mexican 36%
- Common ancestry
- Slovak 3% Portuguese 2% Italian 1%
- Foreign-born
- 27% · Canada, Vietnam, Jamaica
- Languages at home
- 54% English-only · Spanish 34% Other Asian/Pacific 3% Vietnamese 1%
Political lean MEDSL · Salt Lake
- 2024 margin
- D (+10.2) · D 53.7% · R 43.5% · Other 2.8%
- 2008→2024 swing
- +10.1pp toward D · 2008: 0.1pp · 2024: 10.2pp
- All cycles
- 2024: D+10.2 2020: D+11.0 2016: D+10.2 2012: R+19.3 2008: D+0.1
Not yet ingested
- Civics
- —
Market trends
- HPI YoY
- ▼ -332.72%
- Current HPI
- 327.1858
- Rent YoY
- ▲ 0.74%
- Metro
- Salt Lake City, UT
- State GDP YoY
- ▲ 3.54%
- F500 in state
- 2
Industry mix (Fortune 500 HQ in UT)
| Industry | F500 HQs | Revenue |
|---|---|---|
| Financial Services | 1 | $3B |
|
||
Price history
-31.5% since first listed5 events — show timeline
- 2026-05-04 Price Changed $65,000 WFRMLS
- 2026-04-30 Price Changed $69,900 WFRMLS
- 2026-04-26 Price Changed $89,900 WFRMLS
- 2026-04-25 Price Changed $94,800 WFRMLS
- 2026-04-09 Listed $94,900 WFRMLS
Cash-flow waterfall
monthlySold comps — $/sqft
last 12 mo · ≤1 miLoading sold comps…