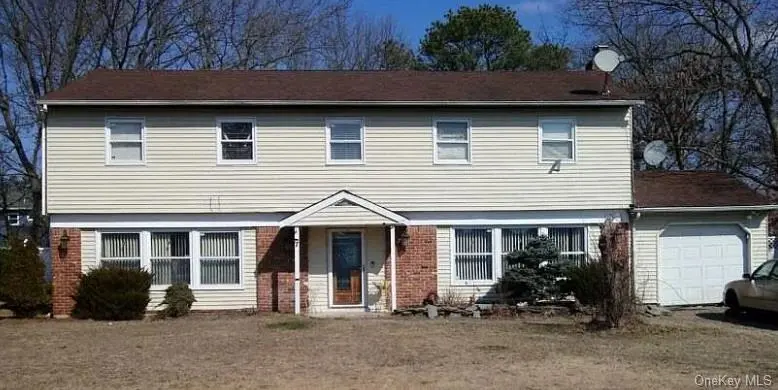
7 Groton Ln · Coram, NY
Flood risk 1/10 · Minimal
- FEMA flood zone
- X (unshaded)
- Chance of flooding over 30 yrs
- 0.0%
- Est. flood insurance / yr
- $507 – $1,088
Fire risk 1/10 · Minimal
- Est. fire insurance / yr
- $691 – $1,283
Heat risk 5/10 · Moderate
- Hot days now (above 93°F)
- 7 days/yr
- Hot days in 30 yrs
- 18 days/yr
Wind risk 6/10 · Moderate
- Chance of severe wind over 30 yrs
- 72.0%
Air-quality risk 4/10 · Minor
- Unhealthy air days now
- 3 days/yr
- Unhealthy air days in 30 yrs
- 5 days/yr
Risk factors via First Street. Map © Google.
Why this score? — see what drove the D grade
The composite is a weighted blend of 9 inputs, each scored 0–100. Each bar is that input's sub-score; the figure is the points it added to the 100-point composite (weight × sub-score).
- ARV discount +14.9/15.0
- Cash flow +7.8/30.0
- Schools +5.2/10.0
- Rent growth +3.7/5.0
- Livability +3.3/5.0
- Condition / age +2.5/5.0
- 1% rule +2.4/10.0
- DSCR +1.9/10.0
- Appreciation +0.0/10.0
$649,000
🖨 Deal sheet (PDF) 📄 Offer letter ✓ Due diligence
Listing remarks MLS
INVESTOR SPECIAL! Renovation ready fixer-upper, Great Investment Potential. Selling AS-IS
Key facts
- 0.34 acre lot
- Garage
- Built 1977
Neighborhood map
What this means for you Summary
Snapshot
- This is a 4-bed/2.5-bath single-family listed at $649k.
Deal economics
- At list price, monthly cash flow is $-714 ($-9k/yr) — negative.
- To cash-flow at today's rent, offer at most $546k (15.9% below list).
- To meet the 1% rule (rent ≥ 1% of price), the offer needs to be $477k (26.4% below list).
- Recommended offer: $477k (26.4% below list) — sets the bar for 1% rule.
- Cap rate 5.0% vs local median 3.5% in Coram — top-decile yield for the area; either an underpriced asset or a hidden risk that comps aren't pricing in. Stress-test before assuming the spread holds.
Location & tenants
- Location reads 66/100 on livability (#646 in NY) — a middle-class / working-renter tenant base. Strengths: employment A+, housing A+, health & safety B; Watch: amenities F, commute F, cost of living F.
- Longwood Central School District (rural): math 61% / reading 55% proficiency, ranked #235 of 590 in NY (top 40%) — acceptable for families but not a draw, mixed tenant base, ~2y average lease.
- Zoned schools: Longwood High School (math 90% / reading 77%, grade A, #409 of 1,100 statewide, top 39%, 2,977 students, 44% FRL).
- Zoned-school proficiency averages 84% at this address vs 58% district-wide (+26 pts) — the actual schools serving this property are materially stronger than the Longwood Central School District average implies; a family-tenant draw the district grade alone would hide.
- Market conditions: Rents rising fast (+4.7%/yr); 232 active listings in the ZIP; 3 comparable units currently listed for rent nearby; rentals leasing fast (median 1d on market — plan ~1-2 weeks tenant-placement turnaround); solid renter incomes; 1,366 units permitted in Suffolk County in 2024 (216 in 5+ unit buildings).
- At $4,774/mo this rent would consume 55% of the median local household income ($103k/yr) (locally 994% of renters already pay >50% of income on rent) — very limited rent-growth headroom before tenants either downsize or default.
Forward outlook
- Local home prices are declining (-3.0%/yr); year-one equity from $4k of loan paydown is wiped out by about $19k of value loss. Plan a longer hold.
- Suffolk County population projected to shrink 5% by 2050 — rents likely to lag national; underwrite the cash flow, not the appreciation.
Negotiation context
- It's been on market 76 days — a 6% lower offer ($610k) is reasonable based on typical stale-listing flexibility.
- 2 sale attempts since 2y ago with the ask held roughly flat each time — persistent listings suggest the price (not the market) is what's stuck; bring a comps-based counter.
Risks & watch-outs
- Climate carrying-cost: major wind risk, 72% chance of damaging wind over 30y; extreme-heat days projected 7→18/yr by 2055 (HVAC capex compounding) — expect insurance premiums to compound above CPI over the hold.
Questions for the listing agent
- What do current leases actually rent for vs. the listed asking? Can we see a recent rent roll and the last 12 months of T-12 income?
- It's been on market 76 days. Have you received any prior offers? Is the seller open to a 26% concession, seller financing, or rate buy-down credit?
- Built in 1977 — when were the roof, HVAC, electrical panel, plumbing, and water heater last replaced?
- Why hasn't it sold? Are there any deal-killer items the seller is aware of (foundation, flood, title, zoning, code violations)?
- Is there a deadline driving the sale (1031 exchange, divorce, estate, relocation)? That informs how much negotiation room exists.
- Schools are B-rated — typically a magnet for longer-tenancy family renters. What's the average tenant stay here, and is there a school-zone premium baked into asking?
- The area grade is low — what's the realistic commute time and amenity access for the typical tenant pool here? Any planned neighborhood developments (good or bad) we should know about?
- What's the average days-on-market for RENTAL listings here right now (not sales)? A rising rental-DOM trend means longer vacancies and softer asking-rent achievability than the comps imply.
- What's the recent tenant-quality profile in this submarket — average credit score on applications, eviction rate, late-payment / NSF rate, and stable-employment percentage? A property-management company in the area should have these aggregated.
- How much new for-sale + rental construction is in the pipeline within 1–3 miles? Heavy new supply typically softens prices + rents 12–24 months out; constrained supply supports both.
Investment metrics
- 1% rule
- 0.74% ✗
- Cap rate
- 4.97%
- Cash-on-cash
- -4.71%
- DSCR
- 0.79
- GRM
- 11.3
CMA / ARV
- ARV (median comp)
- $775,788
- List price
- $649,000
- Delta
- -16.34%
- Verdict
- UNDERPRICED
- Comps
- 20 within 1.0 mi
Show comp detail 12 sales within ~0.75 mi
| Address | Dist | Beds/Ba | Sqft | Sold | Price | $/sf | Match |
|---|---|---|---|---|---|---|---|
| 41 Glenmere Ln | 0.33mi | 5/3.0 (+1) | 2,559 (+2%) | 12mo | $515,000 | $201 | 65 |
| 42 Chestnut St | 0.31mi | 4/2.5 | 2,200 (-13%) | 6mo | $730,000 | $332 | 60 |
| 15 Canterbury Dr | 0.57mi | 4/2.5 | 2,333 (-7%) | 2mo | $615,101 | $264 | 60 |
| 113 Pine St | 0.71mi | 4/2.5 | 2,511 (-0%) | 10mo | $740,000 | $295 | 58 |
| 70 Fairfax Dr | 0.50mi | 4/2.5 | 2,300 (-9%) | 8mo | $725,000 | $315 | 56 |
| 44 Winside Ln | 0.57mi | 4/3.0 | 2,350 (-7%) | 11mo | $700,000 | $298 | 51 |
| 98 Wedgewood Dr | 0.53mi | 4/2.5 | 2,170 (-14%) | 7mo | $650,000 | $300 | 46 |
| 51 Gaetano Ln N | 0.67mi | 4/2.5 | 2,236 (-11%) | 5mo | $655,000 | $293 | 46 |
| 123 Wedgewood Dr | 0.67mi | 4/2.5 | 2,170 (-14%) | 3mo | $743,000 | $342 | 43 |
| 6 Barclay Dr | 0.63mi | 4/2.0 | 2,237 (-11%) | 10mo | $494,000 | $221 | 42 |
| 17 Whitmore Ln | 0.67mi | 4/2.0 | 2,200 (-13%) | 6mo | $546,500 | $248 | 40 |
| 41 Wedgewood Dr | 0.74mi | 4/3.0 | 2,321 (-8%) | 13mo | $635,000 | $274 | 40 |
Match score weights: distance 35% · size 25% · config 20% · recency 20%. Top-matched comps best support the ARV.
Projected returns pro-forma
-3.0% appreciation · 4.66% rent growth · sell at horizon
- IRR
- -22.5%
- Equity multiple
- 0.22×
- Total profit
- $-142,463
- Equity at exit
- $96,768
- IRR
- -13.0%
- Equity multiple
- 0.19×
- Total profit
- $-147,912
- Equity at exit
- $56,114
Cash invested: $181,720 (down + closing). Projections, not guarantees.
Landlord ↔ Tenant lean methodology
- Overall (STATE)
- 15 Strongly Tenant-Friendly
- State New York
- 15 Strongly Tenant-Friendly · D+10
- County
- — inherits STATE
- City
- — inherits STATE
ZIP-level market 11727
- Rents YoY
- 4.7%
- Active inventory
- 232
- Price-to-rent
- 11.3×
Monthly cashflow live
- Estimated rent
- $4,774 medium interval (Pro) →
- Mortgage (P&I)
- −$3,403
- Tax est. 1.5%
- −$811 /mo · $9,735/yr
- Insurance
- −$270
- HOA
- −$0
- Vacancy / Maint / Mgmt
- −$1,002
- Net cashflow
- $-714
Break-even live
Sensitivity live
| Price | -10% $-265 | -5% $-490 | +0% $-714 | +5% $-938 | +10% $-1,162 |
|---|---|---|---|---|---|
| Rent | -10% $-1,091 | -5% $-903 | +0% $-714 | +5% $-525 | +10% $-337 |
| Rate | -1.0pp $-387 | -0.5pp $-549 | base $-714 | +0.5pp $-882 | +1.0pp $-1,053 |
UW: 25.0% down · 7.5% · 30yr · 1.5% tax · 5.0% vac · 8.0% maint · 8.0% mgmt
Financing live
Cash to close
- Down payment
- $162,250
- Closing costs
- $19,470
- Reserves months
- —
- Total cash needed
- —
Loan-product check · same deal, 3 products live
Conventional
25% down · 7.5% · 30yr
- Down + closing
- —
- Monthly P&I
- —
- Monthly cashflow
- —
- DSCR
- —
- Eligible?
- —
Personal DTI + credit; lowest rate.
DSCR
20% down · 8.5% · 30yr
- Down + closing
- —
- Monthly P&I
- —
- Monthly cashflow
- —
- DSCR
- —
- Eligible?
- —
No personal income docs; deal must DSCR.
Hard money
10% down · 12.0% · 12mo
- Down + closing
- —
- Monthly P&I
- —
- Monthly cashflow
- —
- DSCR
- —
- Eligible?
- —
Short-term bridge; refi at stabilization.
Rent comps 3 comps
| Address | Beds | Baths | Sqft | Rent | $/sqft | DOM | Units | Dist |
|---|---|---|---|---|---|---|---|---|
| 7 Wicket St Coram, NY | 4.0 | 4.0 | 2398 | $5,500 | $2.29 | 0d | 1 | 0.88mi |
| 52 Huron St Port Jefferson Station, NY | 3.0 | 2.0 | 2161 | $4,350 | $2.01 | 0d | 1 | 1.44mi |
| 11 Oak Pl Selden, NY | 4.0 | 2.0 | 1976 | $4,200 | $2.13 | 24d | 1 | 1.46mi |
Listing history 11 events
-
2026-06-09days on market $649,000 Active 76 DOM
-
2026-06-08days on market $649,000 Active 75 DOM
-
2026-06-07days on market $649,000 Active 74 DOM
-
2026-06-04days on market $649,000 Active 71 DOM
-
2026-06-03days on market $649,000 Active 70 DOM
-
2026-06-02days on market $649,000 Active 69 DOM
-
2026-06-01days on market $649,000 Active 68 DOM
-
2026-05-31days on market $649,000 Active 67 DOM
-
2026-03-25$649,000 Active 89-char remark
Show marketing remark (89 chars)
INVESTOR SPECIAL! Renovation ready fixer-upper, Great Investment Potential. Selling AS-IS
-
2024-11-13historical
-
2024-11-07$499,000 Active
ⓘ Source: listings_history table (triggers on properties + properties_extension) + one-shot
backfill from property_details.listing_events for pre-trigger history.
Climate risk First Street
- Flood 1/10 Low FEMA zone X (unshaded) · 0% chance over 30 yrs
- Wildfire 1/10 Low
- Heat 5/10 Major 7 d/yr ≥93°F today · 18 d/yr by 30 yrs out
- Wind 6/10 Major 72% chance of damaging wind over 30 yrs
- Air quality 4/10 Moderate 3 unhealthy d/yr today · 5 by 30 yrs out
Nearby sold comps map
Loading sold comps map…
Walkable amenities ~0.75 mi
Loading nearby amenities…
Taxation est. · year 1
- Rental income
- $57,283
- − Mortgage interest
- −$36,354
- − Property taxes
- −$9,735
- − Insurance
- −$3,245
- − Repairs & maintenance
- −$4,583
- − Management
- −$4,583
- − Depreciation
- −$18,880
- Taxable loss
- −$20,097
- Est. tax savings @ 24.0%
- +$4,823
- After-tax cash flow
- $-3,745/yr
For passive investors: Depreciation is non-cash, so a rental often shows a tax loss while cash-flowing — sheltering income. Rental losses are passive: they offset passive income freely, and up to $25,000/yr can offset ordinary (W-2) income if you actively participate and your MAGI is under $100k (phasing out to $0 by $150k); unused losses carry forward. On sale, claimed depreciation is recaptured at up to 25%, and gains may owe capital-gains tax (a 1031 exchange can defer both). Figures are a year-1 estimate at your 24.0% rate — not tax advice; consult a CPA.
Schools (NCES district)
- District
- Longwood Central School District
- NCES district ID
- 3619230
- Math proficiency
- 61% ▬ 0.00%
- Reading proficiency
- 55% ▼ -1.00%
- Median HH income
- $72,748
- Composite
- 51.63/100
- National rank
- #1703
- State rank
- #235 of 590 in NY
Livability — Coram
- Score
- 66/100
- State rank
- #646
- US rank
- #12097
Category grades
Schools grade is shown separately in the Schools card above.
Census & demographics
- Census place
- Coram, NY
- County
- Suffolk County · 679,920 people
- City population
- 28,495
- Metro
- New York-Newark-Jersey City, NY-NJ-PA
- Population (ZIP)
- 28,495
- Household income
- $103,287
- Rent vs Own
- Severe rent burden
- 994.0
Population outlook (Suffolk County) Hauer SSP2
- Today (2025)
- 1,505,262 people
- By 2030
- 1,498,318 · -0.5%
- By 2040
- 1,471,101 · -2.3%
- By 2050
- 1,424,848 · -5.3%
- By 2075
- 1,337,157 · -11.2%
- By 2100
- 1,217,720 · -19.1%
Race, ethnicity, and origin ACS 2023
- Neighborhood character
- Diverse neighborhood (Simpson 0.69)
- Race & ethnicity
- White 50% Hispanic / Latino 19% Two or more races 18% Black 15% Asian 6%
- Hispanic origin (detail)
- Mexican 1% Puerto Rican 8% Dominican 4%
- Common ancestry
- Romanian 4% Scotch-Irish 2% Lithuanian 1%
- Foreign-born
- 22% · Canada, South Korea, Jamaica
- Languages at home
- 72% English-only · Spanish 12% Other Indo-European 8% Arabic 2%
Political lean MEDSL · Suffolk
- 2024 margin
- Lean R (+10.0) · D 45.0% · R 55.0%
- 2008→2024 swing
- -16.0pp toward R · 2008: 6.0pp · 2024: -10.0pp
- All cycles
- 2024: R+10.0 2020: R+0.0 2016: R+8.2 2012: D+2.9 2008: D+6.0
Not yet ingested
- Civics
- —
Market trends
- HPI YoY
- ▼ -571.88%
- Current HPI
- 388.8297
- Rent YoY
- ▲ 4.66%
- Metro
- New York-Newark-Jersey City, NY-NJ-PA
- State GDP YoY
- ▲ 2.60%
- F500 in state
- 92
Industry mix (Fortune 500 HQ in NY)
| Industry | F500 HQs | Revenue |
|---|---|---|
| Financial Services | 10 | $950B |
|
||
| Consumer Goods | 9 | $162B |
|
||
| Insurance | 4 | $225B |
|
||
| Telecommunications | 2 | $144B |
|
||
| Pharmaceuticals | 2 | $112B |
|
||
| Media / Entertainment | 2 | $69B |
|
||
Price history
+30.1% since first listed3 events — show timeline
- 2026-03-25 Listed $649,000 OneKey® MLS as Distributed by MLS Grid
- 2024-11-13 Listing Removed — OneKey® MLS as Distributed by MLS Grid
- 2024-11-07 Listed $499,000 OneKey® MLS as Distributed by MLS Grid
Cash-flow waterfall
monthlySold comps — $/sqft
last 12 mo · ≤1 miLoading sold comps…