16450 Frontage Rd #26 · North Edwards, CA
Flood risk 1/10 · Minimal
- FEMA flood zone
- A
- Chance of flooding over 30 yrs
- 0.0%
- Est. flood insurance / yr
- $1,009 – $1,996
Fire risk 1/10 · Minimal
- Est. fire insurance / yr
- $659 – $1,223
Heat risk 8/10 · Major
- Hot days now (above 101°F)
- 7 days/yr
- Hot days in 30 yrs
- 20 days/yr
Wind risk 1/10 · Minimal
- Chance of severe wind over 30 yrs
- —
Air-quality risk 6/10 · Moderate
- Unhealthy air days now
- 10 days/yr
- Unhealthy air days in 30 yrs
- 13 days/yr
Risk factors via First Street. Map © Google.
Why this score? — see what drove the B grade
The composite is a weighted blend of 9 inputs, each scored 0–100. Each bar is that input's sub-score; the figure is the points it added to the 100-point composite (weight × sub-score).
- Cash flow +30.0/30.0
- 1% rule +10.0/10.0
- DSCR +10.0/10.0
- ARV discount +7.5/15.0
- Appreciation +4.7/10.0
- Livability +2.7/5.0
- Schools +2.6/10.0
- Rent growth +2.5/5.0
- Condition / age +2.5/5.0
$42,500
🖨 Deal sheet 📄 Offer letter ✓ Due diligence
Listing remarks MLS
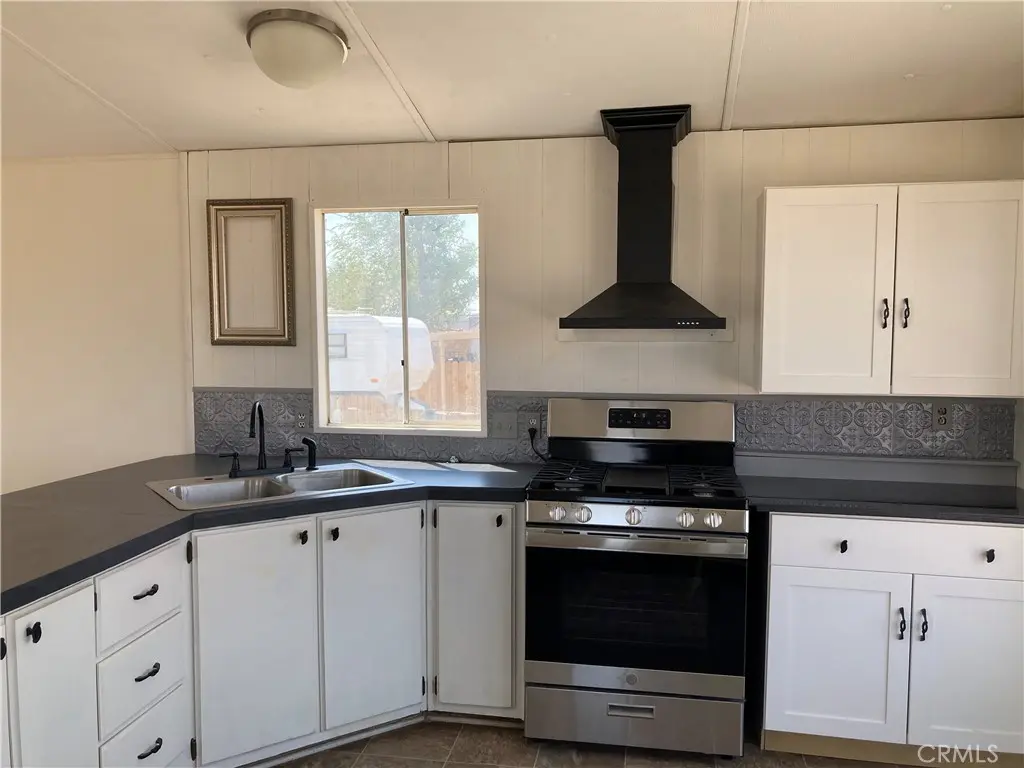
Affordable & Updated Mobile Home – Minutes from Base Jobs & Easy Freeway Access! Looking for convenience and comfort? This well-maintained 2-bedroom, 1-bath mobile home is perfectly located just minutes from local military bases and major employers. Enjoy an easy commute with quick access to the freeway, while coming home to updated comfort.
Key facts
- Built 1984
- Listed 345 days
Neighborhood map
What this means for you Summary
Snapshot
- This is a 2-bed/1.0-bath manufactured listed at $42k.
Deal economics
- At list price, monthly cash flow is $772 ($9k/yr) — positive.
- The deal already cash-flows at list — no discount required.
- Meets the 1% rule at list price ($1k rent vs $42k).
- Recommended offer: $37k (12.0% below list) — sets the bar for market timing.
Location & tenants
- Location reads 53/100 on livability (#930 in CA) — a working-class tenant base; expect higher turnover. Strengths: housing A+, cost of living A; Watch: employment D, schools F, crime F.
- Muroc Joint Unified (rural): math 22% / reading 39% proficiency, ranked #340 of 517 in CA (top 66%) — families likely to look elsewhere, expect single-tenant / working-renter base with shorter leases.
- Market conditions: 92 active listings in the ZIP; 3,244 units permitted in Kern County in 2024 (73 in 5+ unit buildings).
Forward outlook
- In year one you build about $5 of equity ($294 loan paydown + $-289 appreciation (-0.7% local appreciation)).
- Kern County population projected at +17% by 2050 — long-run rental-demand tailwind backs the buy-and-hold thesis.
- At projected returns (-0.7% appreciation + 3.0% rent growth), your $12k cash investment doubles in ~2 years — after that, you're playing with house money.
Negotiation context
- It's been on market 345 days — a 12% lower offer ($37k) is reasonable based on typical stale-listing flexibility.
Risks & watch-outs
- Watch-outs: flood insurance adds $125/mo.
- Climate carrying-cost: in FEMA flood zone A (mandatory federal flood insurance); extreme-heat days projected 7→20/yr by 2055 (HVAC capex compounding) — expect insurance premiums to compound above CPI over the hold.
Questions for the listing agent
- It's been on market 345 days. Have you received any prior offers? Is the seller open to a 12% concession, seller financing, or rate buy-down credit?
- What's the actual annual flood-insurance premium (NFIP or private), and is the property in a SFHA with mandatory coverage?
- Why hasn't it sold? Are there any deal-killer items the seller is aware of (foundation, flood, title, zoning, code violations)?
- Is there a deadline driving the sale (1031 exchange, divorce, estate, relocation)? That informs how much negotiation room exists.
- Schools are F-rated, which usually means shorter tenancies and higher turnover. Who's the typical renter profile here, and what's been the actual vacancy rate?
- Crime grade is F in this area — have there been break-ins, vandalism, or insurance claims at this property in the last 3 years? What carrier currently insures it and at what premium?
- What's the average days-on-market for RENTAL listings here right now (not sales)? A rising rental-DOM trend means longer vacancies and softer asking-rent achievability than the comps imply.
- What's the recent tenant-quality profile in this submarket — average credit score on applications, eviction rate, late-payment / NSF rate, and stable-employment percentage? A property-management company in the area should have these aggregated.
- How much new for-sale + rental construction is in the pipeline within 1–3 miles? Heavy new supply typically softens prices + rents 12–24 months out; constrained supply supports both.
Investment metrics
- 1% rule
- 3.45% ✓
- Cap rate
- 31.62%
- Cash-on-cash
- 90.46%
- DSCR
- 5.03
- GRM
- 2.4
CMA / ARV
No comps found within radius.
Projected returns pro-forma
-0.68% appreciation · 3.0% rent growth · sell at horizon
- IRR
- 79.6%
- Equity multiple
- 4.92×
- Total profit
- $46,657
- Equity at exit
- $10,914
- IRR
- 81.6%
- Equity multiple
- 10.11×
- Total profit
- $108,362
- Equity at exit
- $12,029
Cash invested: $11,900 (down + closing). Projections, not guarantees.
Landlord ↔ Tenant lean methodology
- Overall (STATE)
- 18 Strongly Tenant-Friendly
- State California
- 18 Strongly Tenant-Friendly · D+13
- County
- — inherits STATE
- City
- — inherits STATE
ZIP-level market 93523
- Home prices YoY
- -0.2%
- Active inventory
- 92
- Price-to-rent
- 2.4×
Monthly cashflow live
- Estimated rent
- $1,468 medium interval (Pro) →
- Mortgage (P&I)
- −$223
- Tax from tax record
- −$22 /mo · $267/yr
- Insurance
- −$18
- Flood insurance flood zone
- −$125 /mo · $1,502/yr
- HOA
- −$0
- Vacancy / Maint / Mgmt
- −$308
- Net cashflow
- $772
Break-even live
UW: 25.0% down · 7.5% · 30yr · 1.5% tax · 5.0% vac · 8.0% maint · 8.0% mgmt
Financing live
Cash to close
- Down payment
- $10,625
- Closing costs
- $1,275
- Reserves months
- —
- Total cash needed
- —
Loan-product check · same deal, 3 products live
Conventional
25% down · 7.5% · 30yr
- Down + closing
- —
- Monthly P&I
- —
- Monthly cashflow
- —
- DSCR
- —
- Eligible?
- —
Personal DTI + credit; lowest rate.
DSCR
20% down · 8.5% · 30yr
- Down + closing
- —
- Monthly P&I
- —
- Monthly cashflow
- —
- DSCR
- —
- Eligible?
- —
No personal income docs; deal must DSCR.
Hard money
10% down · 12.0% · 12mo
- Down + closing
- —
- Monthly P&I
- —
- Monthly cashflow
- —
- DSCR
- —
- Eligible?
- —
Short-term bridge; refi at stabilization.
Listing history 20 events
-
2026-06-18days on market $42,500 Active 345 DOM
-
2026-06-17days on market $42,500 Active 344 DOM
-
2026-06-16days on market $42,500 Active 343 DOM
-
2026-06-15days on market $42,500 Active 342 DOM
-
2026-06-13days on market $42,500 Active 340 DOM
-
2026-06-13days on market $42,500 Active 339 DOM
-
2026-06-09days on market $42,500 Active 336 DOM
-
2026-06-08days on market $42,500 Active 335 DOM
-
2026-06-07days on market $42,500 Active 334 DOM
-
2026-06-04days on market $42,500 Active 331 DOM
-
2026-06-03days on market $42,500 Active 330 DOM
-
2026-06-02days on market $42,500 Active 329 DOM
-
2026-06-01days on market $42,500 Active 328 DOM
-
2026-05-31days on market $42,500 Active 327 DOM
-
2026-03-25price $42,500 361-char remark
Show marketing remark (361 chars)
Affordable & Updated Mobile Home – Minutes from Base Jobs & Easy Freeway Access! Looking for convenience and comfort? This well-maintained 2-bedroom, 1-bath mobile home is perfectly located just minutes from local military bases and major employers. Enjoy an easy commute with quick access to the freeway, while coming home to updated comfort.
-
2026-01-02price $50,000 361-char remark
Show marketing remark (361 chars)
Affordable & Updated Mobile Home – Minutes from Base Jobs & Easy Freeway Access! Looking for convenience and comfort? This well-maintained 2-bedroom, 1-bath mobile home is perfectly located just minutes from local military bases and major employers. Enjoy an easy commute with quick access to the freeway, while coming home to updated comfort.
-
2025-12-03price $54,500 361-char remark
Show marketing remark (361 chars)
Affordable & Updated Mobile Home – Minutes from Base Jobs & Easy Freeway Access! Looking for convenience and comfort? This well-maintained 2-bedroom, 1-bath mobile home is perfectly located just minutes from local military bases and major employers. Enjoy an easy commute with quick access to the freeway, while coming home to updated comfort.
-
2025-08-03price $55,000 361-char remark
Show marketing remark (361 chars)
Affordable & Updated Mobile Home – Minutes from Base Jobs & Easy Freeway Access! Looking for convenience and comfort? This well-maintained 2-bedroom, 1-bath mobile home is perfectly located just minutes from local military bases and major employers. Enjoy an easy commute with quick access to the freeway, while coming home to updated comfort.
-
2025-07-18price $65,000 361-char remark
Show marketing remark (361 chars)
Affordable & Updated Mobile Home – Minutes from Base Jobs & Easy Freeway Access! Looking for convenience and comfort? This well-maintained 2-bedroom, 1-bath mobile home is perfectly located just minutes from local military bases and major employers. Enjoy an easy commute with quick access to the freeway, while coming home to updated comfort.
-
2025-07-08$92,000 Active 361-char remark
Show marketing remark (361 chars)
Affordable & Updated Mobile Home – Minutes from Base Jobs & Easy Freeway Access! Looking for convenience and comfort? This well-maintained 2-bedroom, 1-bath mobile home is perfectly located just minutes from local military bases and major employers. Enjoy an easy commute with quick access to the freeway, while coming home to updated comfort.
ⓘ Source: listings_history table (triggers on properties + properties_extension) + one-shot
backfill from property_details.listing_events for pre-trigger history.
Tax reassessment forecast CA · Resets to sale price
- Current annual tax
- $267 · $22/mo
- Projected year-2 tax
- $323 · $27/mo
- Expected delta
- +$56/yr (+$5/mo · 20.8%)
ⓘ Screening estimate from a state-policy table — verify with the county assessor before closing.
Climate risk First Street
- Flood 1/10 Low FEMA zone A · 0% chance over 30 yrs
- Wildfire 1/10 Low
- Heat 8/10 Severe 7 d/yr ≥101°F today · 20 d/yr by 30 yrs out
- Wind 1/10 Low
- Air quality 6/10 Major 10 unhealthy d/yr today · 13 by 30 yrs out
Nearby sold comps map
Loading sold comps map…
Walkable amenities ~0.75 mi
Loading nearby amenities…
Taxation est. · year 1
- Rental income
- $17,619
- − Mortgage interest
- −$2,381
- − Property taxes
- −$267
- − Insurance
- −$1,715
- − Repairs & maintenance
- −$1,410
- − Management
- −$1,410
- − Depreciation
- −$1,236
- Taxable income
- $9,201
- Est. tax owed @ 24.0%
- −$2,208
- After-tax cash flow
- $7,054/yr
For passive investors: Depreciation is non-cash, so a rental often shows a tax loss while cash-flowing — sheltering income. Rental losses are passive: they offset passive income freely, and up to $25,000/yr can offset ordinary (W-2) income if you actively participate and your MAGI is under $100k (phasing out to $0 by $150k); unused losses carry forward. On sale, claimed depreciation is recaptured at up to 25%, and gains may owe capital-gains tax (a 1031 exchange can defer both). Figures are a year-1 estimate at your 24.0% rate — not tax advice; consult a CPA.
Schools (NCES district)
- District
- Muroc Joint Unified
- NCES district ID
- 0626490
- Math proficiency
- 22% ▼ -13.00%
- Reading proficiency
- 39% ▼ -9.00%
- Median HH income
- $47,457
- Composite
- 26.31/100
- National rank
- #7241
- State rank
- #340 of 517 in CA
Livability — North Edwards
- Score
- 53/100
- State rank
- #930
- US rank
- #24267
Category grades
Schools grade is shown separately in the Schools card above.
Census & demographics
- Census place
- North Edwards, CA
- Population (ZIP)
- 3,681
Population outlook (Kern County) Hauer SSP2
- Today (2025)
- 947,286 people
- By 2030
- 978,984 · +3.3%
- By 2040
- 1,045,018 · +10.3%
- By 2050
- 1,105,232 · +16.7%
- By 2075
- 1,229,538 · +29.8%
- By 2100
- 1,238,059 · +30.7%
Race, ethnicity, and origin ACS 2023
- Neighborhood character
- Diverse neighborhood (Simpson 0.67)
- Race & ethnicity
- White 54% Two or more races 22% Hispanic / Latino 13% Black 12% Asian 3% Native American 1%
- Hispanic origin (detail)
- Mexican 4% Puerto Rican 2%
- Common ancestry
- Italian 6% Lithuanian 3% Iranian 2%
- Foreign-born
- 5% · Canada
- Languages at home
- 92% English-only · Spanish 4% Other Asian/Pacific 1% Tagalog/Filipino 1%
Political lean MEDSL · Kern
- 2024 margin
- Strong R (+21.1) · D 38.2% · R 59.3% · Other 2.5%
- 2008→2024 swing
- -3.3pp toward R · 2008: -17.8pp · 2024: -21.1pp
- All cycles
- 2024: R+21.1 2020: R+10.2 2016: R+15.0 2012: R+20.9 2008: R+17.8
Not yet ingested
- Civics
- —
Market trends
- HPI YoY
- ▼ -0.68%
- Current HPI
- 354.8553
- Rent YoY
- —
- Metro
- —
- State GDP YoY
- ▲ 3.21%
- F500 in state
- 116
Industry mix (Fortune 500 HQ in CA)
| Industry | F500 HQs | Revenue |
|---|---|---|
| Technology | 27 | $1,492B |
|
||
| Financial Services | 3 | $174B |
|
||
| Retail | 3 | $44B |
|
||
| Insurance | 3 | $26B |
|
||
| Media / Entertainment | 2 | $115B |
|
||
| Pharmaceuticals / Biotech | 2 | $62B |
|
||
Price history
-53.8% since first listed6 events — show timeline
- 2026-03-25 Price Changed $42,500 CRMLS
- 2026-01-02 Price Changed $50,000 CRMLS
- 2025-12-03 Price Changed $54,500 CRMLS
- 2025-08-03 Price Changed $55,000 CRMLS
- 2025-07-18 Price Changed $65,000 CRMLS
- 2025-07-08 Listed $92,000 CRMLS
Property tax history
+278.8%/yrLatest (2025): $267 · +3860.3% YoY. Source: county tax records.
Cash-flow waterfall
monthlySold comps — $/sqft
last 12 mo · ≤1 miLoading sold comps…