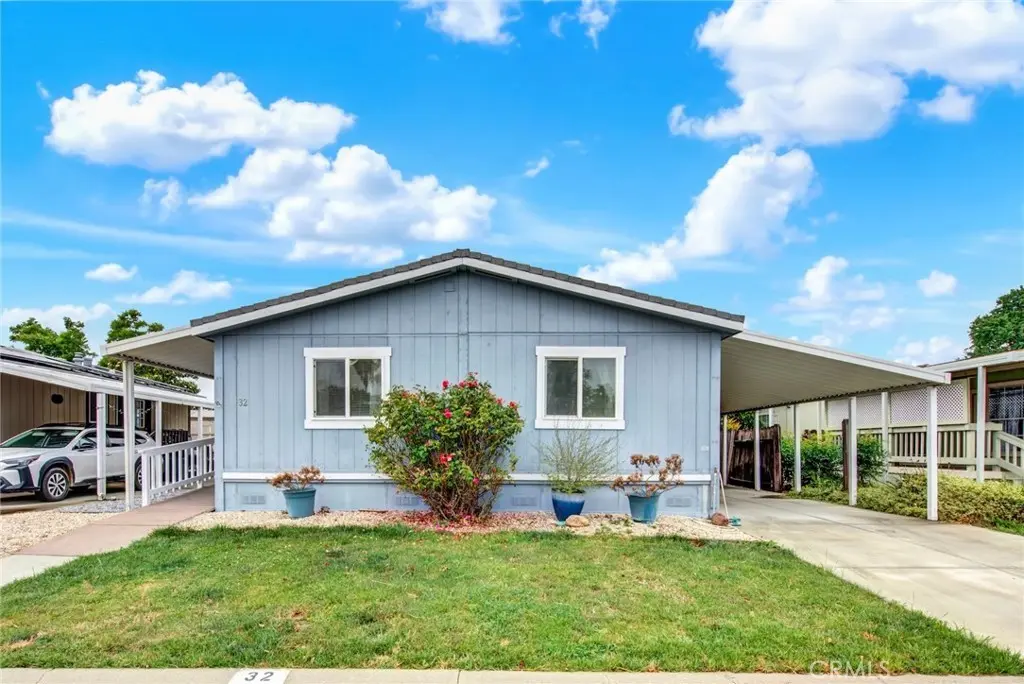
3835 GARDINER Fry #32 · Vina, CA
Flood risk 4/10 · Minor
- FEMA flood zone
- X (unshaded)
- Chance of flooding over 30 yrs
- 0.21%
- Est. flood insurance / yr
- $507 – $1,088
Fire risk 8/10 · Major
- Est. fire insurance / yr
- $659 – $1,223
Heat risk 8/10 · Major
- Hot days now (above 106°F)
- 7 days/yr
- Hot days in 30 yrs
- 16 days/yr
Wind risk 1/10 · Minimal
- Chance of severe wind over 30 yrs
- —
Air-quality risk 10/10 · Severe
- Unhealthy air days now
- 35 days/yr
- Unhealthy air days in 30 yrs
- 38 days/yr
Risk factors via First Street. Map © Google.
Why this score? — see what drove the D grade
The composite is a weighted blend of 9 inputs, each scored 0–100. Each bar is that input's sub-score; the figure is the points it added to the 100-point composite (weight × sub-score).
- Cash flow +22.0/30.0
- DSCR +7.0/10.0
- 1% rule +4.9/10.0
- Rent growth +2.5/5.0
- Schools +2.5/10.0
- Condition / age +2.5/5.0
- Livability +2.2/5.0
- ARV discount +0.0/15.0
- Appreciation +0.0/10.0
$162,000
🖨 Deal sheet 📄 Offer letter ✓ Due diligence
Listing remarks MLS
Welcome Home! This fully remodeled 3 bedroom 2 bath is immaculate! As you enter you are welcomed with an open bright living and dining area with a private den/office. The updated kitchen is nestled next to the dining area with new appliances and granite countertops with a built in desk. Adorable breakfast nook area with door to backyard. The laundry room is next to the kitchen for easy access. Spacious master bedroom has full bathroom with walk-in shower and granite countertops. Guest bedrooms are located on the opposite side of the home for privacy. Guest bathroom has a tub for soaking with granite countertops. Boasts new flooring, paint, fixtures, doors and windows throughout! The roof is one year old. The deck was built with Trex decking for durability and includes a ramp for easy access. A large carport allows for up to 3 cars. Backyard includes storage shed and low maintenance landscaping making it easy to care for. This home has been meticulously maintained and is ready for you to move right in! Close to Hwy 99 and I-5 for an easy commute. Right next to the beautiful Sacramento River and park. BACK ON THE MARKET AT NO FAULT TO THE SELLER! SELLER IS MOTIVATAED! COME SEE THIS BEAUTIFUL HOME TODAY BEFORE ITS GONE!
Key facts
- Breakfast nook
- Ample counter space
- Deep carport
Tags
Property features AI
Finance
- Other: Living area and year-built sourced from assessor; Lot size estimated, lot classified 0-1 unit/acre
- Financial info: Land lease (park) of $745 per month; Rent includes trash, pool, water and sewer
- HOA & community: Part of an association with monthly fees; Association amenities: card room, pool, barbecue/outdoor cooking area, spa, picnic area; Senior community; Community features include biking and fishing; Park name: WOODSON BRIDGE ESTATES; Manager approval required; Pets allowed with breed restrictions
Exterior
- Parking: Attached carport
- Utilities: Septic tank sewer; Well water
- Home design: Single-story mobile home; Mobile home dimensions approximately 28' x 53'; Has a view
- Construction: Mobile home (year built from assessor); Single-story construction
- Exterior features: Wood fencing in new condition; Community pool; Community amenities include pool and spa
Interior
- Kitchen: Gas range
- Flooring: Carpet
- Bathrooms: 2 full bathrooms
- Heating & cooling: Central heating (furnace); Central cooling
- Interior features: One-level home with front entry; Association and community spa
- Laundry & utility: Inside laundry
Neighborhood map
What this means for you Summary
Snapshot
- This is a 3-bed/2.0-bath manufactured listed at $162k.
Deal economics
- At list price, monthly cash flow is $258 ($3k/yr) — positive.
- The deal already cash-flows at list — no discount required.
- To meet the 1% rule (rent ≥ 1% of price), the offer needs to be $161k (0.5% below list).
- Recommended offer: $160k (1.5% below list) — sets the bar for market timing.
Location & tenants
- Location reads 44/100 on livability (#1,345 in CA) — a working-class tenant base; expect higher turnover. Strengths: housing A+, crime A; Watch: schools F, amenities F, commute F.
- Corning Union High (rural): math 12% / reading 41% proficiency, ranked #1,151 of 1,400 in CA (top 82%) — low school quality limits family demand, transient renter base, plan for 1-2y turnover.
- Market conditions: 175 active listings in the ZIP; 186 units permitted in Tehama County in 2024 (0 in 5+ unit buildings).
Forward outlook
- Local home prices are declining (-3.0%/yr); year-one equity from $1k of loan paydown is wiped out by about $5k of value loss. Plan a longer hold.
- Tehama County population projected at -14% by 2050 — secular population decline; favor cash flow + early exit over multi-decade hold.
Negotiation context
- It's been on market 17 days — a 2% lower offer ($160k) is reasonable based on typical stale-listing flexibility.
- 4 sale attempts since 8y ago with the ask held roughly flat each time — persistent listings suggest the price (not the market) is what's stuck; bring a comps-based counter.
- Current owner paid $118k; 37% above their basis — modest negotiation headroom, anchor on the comps not their cost.
Risks & watch-outs
- Climate carrying-cost: severe wildfire risk; extreme-heat days projected 7→16/yr by 2055 (HVAC capex compounding) — expect insurance premiums to compound above CPI over the hold.
Questions for the listing agent
- Is there a deadline driving the sale (1031 exchange, divorce, estate, relocation)? That informs how much negotiation room exists.
- Schools are F-rated, which usually means shorter tenancies and higher turnover. Who's the typical renter profile here, and what's been the actual vacancy rate?
- The area grade is low — what's the realistic commute time and amenity access for the typical tenant pool here? Any planned neighborhood developments (good or bad) we should know about?
- What's the average days-on-market for RENTAL listings here right now (not sales)? A rising rental-DOM trend means longer vacancies and softer asking-rent achievability than the comps imply.
- What's the recent tenant-quality profile in this submarket — average credit score on applications, eviction rate, late-payment / NSF rate, and stable-employment percentage? A property-management company in the area should have these aggregated.
- How much new for-sale + rental construction is in the pipeline within 1–3 miles? Heavy new supply typically softens prices + rents 12–24 months out; constrained supply supports both.
Investment metrics
- 1% rule
- 0.99% ✗
- Cap rate
- 8.21%
- Cash-on-cash
- 6.84%
- DSCR
- 1.30
- GRM
- 8.4
CMA / ARV
- ARV (on-the-fly)
- $120,848
- Comps found
- 11
Show comp detail 11 sales within ~0.75 mi
| Address | Dist | Beds/Ba | Sqft | Sold | Price | $/sf | Match |
|---|---|---|---|---|---|---|---|
| 3835 Gardiner Ferry Rd #1 | 0.00mi | 2/2.0 (-1) | 1,416 (-3%) | 3mo | $135,000 | $95 | 88 |
| 3835 Gardiner Ferry Rd #105 | 0.00mi | 3/2.0 | 1,440 (-1%) | 13mo | $128,500 | $89 | 87 |
| 3835 GARDINER Fry #82 | 0.00mi | 3/2.0 | 1,440 (-1%) | 14mo | $110,000 | $76 | 87 |
| 3835 Gardiner Ferry Rd #28 | 0.00mi | 2/2.0 (-1) | 1,440 (-1%) | 9mo | $105,000 | $73 | 85 |
| 3835 Gardiner Ferry Rd #94 | 0.00mi | 2/2.0 (-1) | 1,440 (-1%) | 16mo | $120,000 | $83 | 80 |
| 3835 Gardiner Ferry Rd #5 | 0.00mi | 2/2.0 (-1) | 1,560 (+7%) | 8mo | $122,500 | $79 | 76 |
| 3835 GARDINER Fry #102 | 0.01mi | 3/2.0 | 1,568 (+8%) | 23mo | $165,000 | $105 | 68 |
| 3835 GARDINER FERRY #13 #13 | 0.01mi | 3/2.0 | 1,580 (+8%) | 23mo | $16,000 | $10 | 66 |
| 3835 Gardiner Ferry Rd #104 | 0.01mi | 3/2.0 | 1,600 (+10%) | 22mo | $160,000 | $100 | 65 |
| 3835 Gardiner Ferry Rd #89 | 0.00mi | 2/2.0 (-1) | 1,248 (-14%) | 23mo | $95,000 | $76 | 52 |
| 24895 New Jersey Ave | 0.62mi | 3/2.0 | 1,560 (+7%) | 12mo | $549,000 | $352 | 49 |
Match score weights: distance 35% · size 25% · config 20% · recency 20%. Top-matched comps best support the ARV.
Projected returns pro-forma
-3.0% appreciation · 3.0% rent growth · sell at horizon
- IRR
- -5.8%
- Equity multiple
- 0.78×
- Total profit
- $-9,836
- Equity at exit
- $24,155
- IRR
- 3.8%
- Equity multiple
- 1.27×
- Total profit
- $12,461
- Equity at exit
- $14,007
Cash invested: $45,360 (down + closing). Projections, not guarantees.
Landlord ↔ Tenant lean methodology
- Overall (STATE)
- 18 Strongly Tenant-Friendly
- State California
- 18 Strongly Tenant-Friendly · D+13
- County
- — inherits STATE
- City
- — inherits STATE
ZIP-level market 96021
- Home prices YoY
- -34.8%
- Active inventory
- 175
- Price-to-rent
- 8.4×
Monthly cashflow live
- Estimated rent
- $1,612 medium interval (Pro) →
- Mortgage (P&I)
- −$850
- Tax from tax record
- −$98 /mo · $1,172/yr
- Insurance
- −$68
- HOA
- −$0
- Vacancy / Maint / Mgmt
- −$338
- Net cashflow
- $258
Break-even live
UW: 25.0% down · 7.5% · 30yr · 1.5% tax · 5.0% vac · 8.0% maint · 8.0% mgmt
Financing live
Cash to close
- Down payment
- $40,500
- Closing costs
- $4,860
- Reserves months
- —
- Total cash needed
- —
Loan-product check · same deal, 3 products live
Conventional
25% down · 7.5% · 30yr
- Down + closing
- —
- Monthly P&I
- —
- Monthly cashflow
- —
- DSCR
- —
- Eligible?
- —
Personal DTI + credit; lowest rate.
DSCR
20% down · 8.5% · 30yr
- Down + closing
- —
- Monthly P&I
- —
- Monthly cashflow
- —
- DSCR
- —
- Eligible?
- —
No personal income docs; deal must DSCR.
Hard money
10% down · 12.0% · 12mo
- Down + closing
- —
- Monthly P&I
- —
- Monthly cashflow
- —
- DSCR
- —
- Eligible?
- —
Short-term bridge; refi at stabilization.
Listing history 14 events
-
2026-06-19days on market $162,000 Active 17 DOM
-
2026-06-18days on market $162,000 Active 16 DOM
-
2026-06-17days on market $162,000 Active 15 DOM
-
2026-06-16days on market $162,000 Active 14 DOM
-
2026-06-15days on market $162,000 Active 13 DOM
-
2026-06-14days on market $162,000 Active 11 DOM
-
2026-06-13days on market $162,000 Active 10 DOM
-
2026-06-10days on market $162,000 Active 8 DOM
-
2026-06-09days on market $162,000 Active 7 DOM
-
2026-06-08days on market $162,000 Active 6 DOM
-
2026-06-07days on market $162,000 Active 5 DOM
-
2026-06-05days on market $162,000 Active 2 DOM
-
2026-06-03remarks 699-char remark
-
2026-06-03$162,000 Active 1 DOM
ⓘ Source: listings_history table (triggers on properties + properties_extension) + one-shot
backfill from property_details.listing_events for pre-trigger history.
Tax reassessment forecast CA · Resets to sale price
- Current annual tax
- $1,172 · $98/mo
- Projected year-2 tax
- $1,231 · $103/mo
- Expected delta
- +$59/yr (+$5/mo · 5.0%)
ⓘ Screening estimate from a state-policy table — verify with the county assessor before closing.
Climate risk First Street
- Flood 4/10 Moderate FEMA zone X (unshaded) · 21% chance over 30 yrs
- Wildfire 8/10 Severe
- Heat 8/10 Severe 7 d/yr ≥106°F today · 16 d/yr by 30 yrs out
- Wind 1/10 Low
- Air quality 10/10 Extreme 35 unhealthy d/yr today · 38 by 30 yrs out
Nearby sold comps map
Loading sold comps map…
Walkable amenities ~0.75 mi
Loading nearby amenities…
Taxation est. · year 1
- Rental income
- $19,338
- − Mortgage interest
- −$9,075
- − Property taxes
- −$1,172
- − Insurance
- −$810
- − Repairs & maintenance
- −$1,547
- − Management
- −$1,547
- − Depreciation
- −$4,713
- Taxable income
- $475
- Est. tax owed @ 24.0%
- −$114
- After-tax cash flow
- $2,986/yr
For passive investors: Depreciation is non-cash, so a rental often shows a tax loss while cash-flowing — sheltering income. Rental losses are passive: they offset passive income freely, and up to $25,000/yr can offset ordinary (W-2) income if you actively participate and your MAGI is under $100k (phasing out to $0 by $150k); unused losses carry forward. On sale, claimed depreciation is recaptured at up to 25%, and gains may owe capital-gains tax (a 1031 exchange can defer both). Figures are a year-1 estimate at your 24.0% rate — not tax advice; consult a CPA.
Schools (NCES district)
- District
- Corning Union High
- NCES district ID
- 0609810
- Math proficiency
- 12% ▼ -10.00%
- Reading proficiency
- 41% ▼ -2.00%
- Median HH income
- $39,060
- Composite
- 25.18/100
- National rank
- #12925
- State rank
- #1151 of 1400 in CA
Livability — Vina
- Score
- 44/100
- State rank
- #1345
- US rank
- #26820
Category grades
Schools grade is shown separately in the Schools card above.
Census & demographics
- Population (ZIP)
- 15,076
Population outlook (Tehama County) Hauer SSP2
- Today (2025)
- 61,058 people
- By 2030
- 59,493 · -2.6%
- By 2040
- 56,076 · -8.2%
- By 2050
- 52,372 · -14.2%
- By 2075
- 43,895 · -28.1%
- By 2100
- 34,186 · -44.0%
Race, ethnicity, and origin ACS 2023
- Neighborhood character
- Diverse neighborhood (Simpson 0.55)
- Race & ethnicity
- Hispanic / Latino 51% White 44% Two or more races 20% Asian 3%
- Hispanic origin (detail)
- Mexican 46%
- Common ancestry
- Slovak 2% Serbian 2% Portuguese 1%
- Foreign-born
- 23% · Canada
- Languages at home
- 59% English-only · Spanish 40%
Political lean MEDSL · Tehama
- 2024 margin
- Solid R (+41.8) · D 27.9% · R 69.7% · Other 2.3%
- 2008→2024 swing
- -17.7pp toward R · 2008: -24.1pp · 2024: -41.8pp
- All cycles
- 2024: R+41.8 2020: R+35.6 2016: R+36.8 2012: R+27.4 2008: R+24.1
Not yet ingested
- Civics
- —
Market trends
- HPI YoY
- ▼ -145.81%
- Current HPI
- 272.9407
- Rent YoY
- —
- Metro
- —
- State GDP YoY
- ▲ 3.21%
- F500 in state
- 116
Industry mix (Fortune 500 HQ in CA)
| Industry | F500 HQs | Revenue |
|---|---|---|
| Technology | 27 | $1,492B |
|
||
| Financial Services | 3 | $174B |
|
||
| Retail | 3 | $44B |
|
||
| Insurance | 3 | $26B |
|
||
| Media / Entertainment | 2 | $115B |
|
||
| Pharmaceuticals / Biotech | 2 | $62B |
|
||
Price history
+149.2% since first listed9 events — show timeline
- 2026-06-02 Listed $162,000 CRMLS
- 2022-06-14 Sold (MLS) $118,000 CRMLS
- 2022-06-13 Pending — CRMLS
- 2022-06-06 Contingent — CRMLS
- 2022-05-26 Relisted — CRMLS
- 2022-05-11 Contingent — CRMLS
- 2022-03-03 Listed $125,000 CRMLS
- 2018-12-31 Sold (MLS) $65,000 CRMLS
- 2018-12-08 Listed $65,000 CRMLS
Property tax history
+18.6%/yrLatest (2025): $1,172 · +0.7% YoY. Source: county tax records.
Cash-flow waterfall
monthlySold comps — $/sqft
last 12 mo · ≤1 miLoading sold comps…