 🏷️ Likely Rental
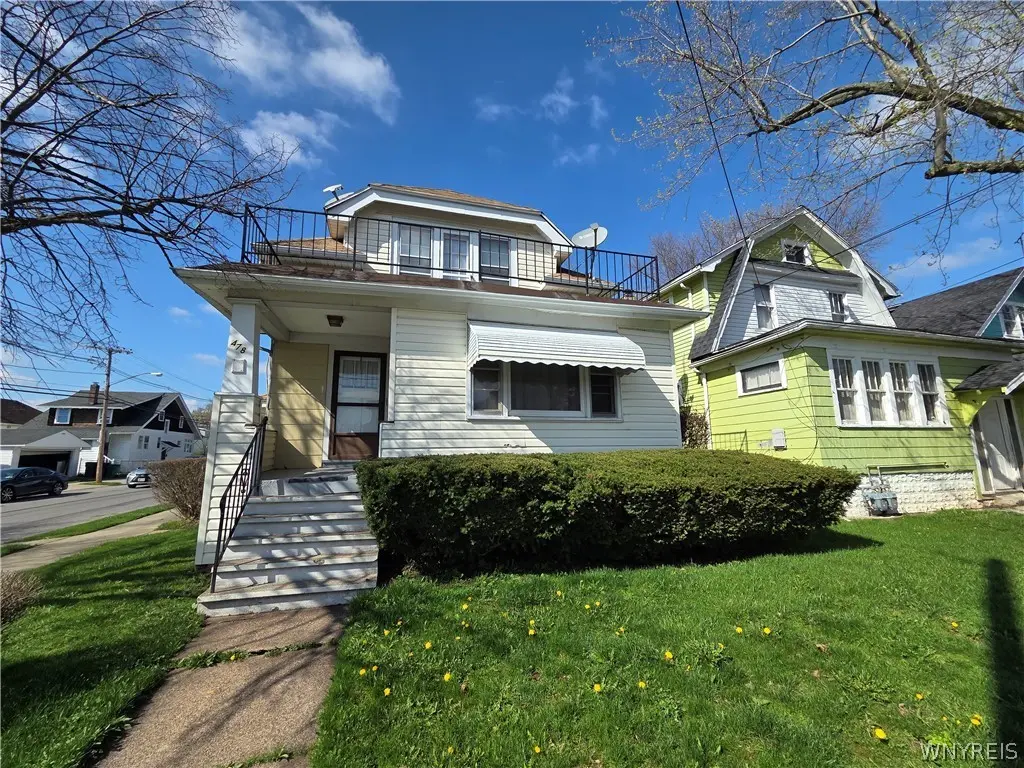
478 Lisbon Ave · Buffalo, NY
Flood risk 1/10 · Minimal
- FEMA flood zone
- X (unshaded)
- Chance of flooding over 30 yrs
- 0.0%
- Est. flood insurance / yr
- $473 – $860
Fire risk 1/10 · Minimal
- Est. fire insurance / yr
- $691 – $1,283
Heat risk 3/10 · Minor
- Hot days now (above 92°F)
- 7 days/yr
- Hot days in 30 yrs
- 15 days/yr
Wind risk 1/10 · Minimal
- Chance of severe wind over 30 yrs
- —
Air-quality risk 3/10 · Minor
- Unhealthy air days now
- 2 days/yr
- Unhealthy air days in 30 yrs
- 3 days/yr
Risk factors via First Street. Map © Google.
Why this score? — see what drove the C+ grade
The composite is a weighted blend of 9 inputs, each scored 0–100. Each bar is that input's sub-score; the figure is the points it added to the 100-point composite (weight × sub-score).
- Cash flow +22.8/30.0
- ARV discount +15.0/15.0
- DSCR +7.3/10.0
- 1% rule +6.0/10.0
- Livability +3.9/5.0
- Schools +3.3/10.0
- Rent growth +2.7/5.0
- Condition / age +2.5/5.0
- Appreciation +0.0/10.0
$219,900
🖨 Deal sheet (PDF) 📄 Offer letter ✓ Due diligence
Multi-family units
County records classify this as Multi-Family (2-4 Unit). Listing-text estimate: 1 unit. estimate disagrees with records
Listing remarks MLS
Exceptional opportunity to own a well-maintained multifamily property in a highly desirable location! Each unit features 2 spacious bedrooms, offering strong rental appeal and excellent income potential. Enjoy added amenities including a 2-car garage, private balcony, and covered front entrance. The full, clean, dry basement provides ample storage and peace of mind. Ideally situated just minutes from UB, major thoroughfares, shopping, and popular restaurants, this property offers both convenience and consistent tenant demand. A standout feature: separate utilities and thoughtful layout make management easy and maximize profitability. Whether you're expanding your portfolio or looking to owner-occupy, this is a smart investment you won’t want to miss!
Key facts
- Separate utilities
- Private balcony
- Multifamily property
Tags
Neighborhood map
What this means for you Summary
Snapshot
- This is a 4-bed/2.0-bath multifamily listed at $220k.
Deal economics
- At list price, monthly cash flow is $384 ($5k/yr) — positive.
- The deal already cash-flows at list — no discount required.
- Meets the 1% rule at list price ($2k rent vs $220k).
- Recommended offer: $217k (1.5% below list) — sets the bar for market timing.
Location & tenants
- Location reads 77/100 on livability (#195 in NY, #3,011 nationally) — a middle-class / working-renter tenant base. Strengths: commute A+, housing A+, health & safety A+; Watch: crime F, employment D-.
- Buffalo City School District (urban): math 41% / reading 40% proficiency, ranked #535 of 590 in NY (top 91%) — families likely to look elsewhere, expect single-tenant / working-renter base with shorter leases; 75% free/reduced lunch — lower-income household profile, screen leases tightly.
- Zoned schools: International School (math 8% / reading 17%, grade F, #2,048 of 2,108 statewide, top 97%, 981 students, 92% FRL); Hutchinson Central Technical High School (math 96% / reading 32%, grade B-, #807 of 1,100 statewide, top 73%, 1,175 students, 78% FRL).
- Market conditions: Rents flat; 239 active listings in the ZIP; 22 comparable units currently listed for rent nearby; rentals at typical pace (median 16d on market — plan ~3-4 weeks tenant-placement turnaround); lower-income renter base — watch delinquency; 1,244 units permitted in Erie County in 2024 (563 in 5+ unit buildings).
- At $2,410/mo this rent would consume 64% of the median local household income ($45k/yr) (locally 2873% of renters already pay >50% of income on rent) — very limited rent-growth headroom before tenants either downsize or default.
Forward outlook
- Local home prices are declining (-3.0%/yr); year-one equity from $2k of loan paydown is wiped out by about $7k of value loss. Plan a longer hold.
Negotiation context
- It's been on market 17 days — a 2% lower offer ($217k) is reasonable based on typical stale-listing flexibility.
- 2 sale attempts with the ask held roughly flat each time — persistent listings suggest the price (not the market) is what's stuck; bring a comps-based counter.
- Current owner paid $55k; list at $220k implies a 300% gain — meaningful room to come down on a strong offer.
Risks & watch-outs
- Watch-outs: built in 1902 — expect roof / HVAC / electrical / plumbing capex.
Questions for the listing agent
- Built in 1902 — when were the roof, HVAC, electrical panel, plumbing, and water heater last replaced?
- Is there a deadline driving the sale (1031 exchange, divorce, estate, relocation)? That informs how much negotiation room exists.
- Crime grade is F in this area — have there been break-ins, vandalism, or insurance claims at this property in the last 3 years? What carrier currently insures it and at what premium?
- What's the average days-on-market for RENTAL listings here right now (not sales)? A rising rental-DOM trend means longer vacancies and softer asking-rent achievability than the comps imply.
- What's the recent tenant-quality profile in this submarket — average credit score on applications, eviction rate, late-payment / NSF rate, and stable-employment percentage? A property-management company in the area should have these aggregated.
- How much new apartment / multifamily construction is in the pipeline within 1–3 miles? Heavy new supply (>2% of stock underway) typically softens rents 12–24 months out; light construction supports rent growth.
Investment metrics
- 1% rule
- 1.10% ✓
- Cap rate
- 8.39%
- Cash-on-cash
- 7.49%
- DSCR
- 1.33
- GRM
- 7.6
CMA / ARV
- ARV (median comp)
- $315,017
- List price
- $219,900
- Delta
- -30.19%
- Verdict
- UNDERPRICED
- Comps
- 20 within 1.0 mi
Show comp detail 12 sales within ~0.75 mi
| Address | Dist | Beds/Ba | Sqft | Sold | Price | $/sf | Match |
|---|---|---|---|---|---|---|---|
| 516 Winspear Ave | 0.23mi | 3/2.0 (-1) | 2,017 (+3%) | 2mo | $220,000 | $109 | 77 |
| 638 Highgate Ave | 0.35mi | 4/2.0 | 1,900 (-3%) | 6mo | $178,000 | $94 | 74 |
| 622 Minnesota Ave | 0.22mi | 4/2.0 | 1,800 (-8%) | 3mo | $175,000 | $97 | 73 |
| 626 Lisbon Ave | 0.28mi | 5/2.0 (+1) | 1,919 (-2%) | 8mo | $250,000 | $130 | 72 |
| 132 Hewitt Ave | 0.53mi | 4/2.0 | 1,946 (-1%) | 5mo | $125,000 | $64 | 70 |
| 192 Berkshire Ave | 0.56mi | 4/2.0 | 1,955 (-0%) | 10mo | $129,000 | $66 | 65 |
| 314 Lasalle Ave | 0.42mi | 4/2.0 | 1,675 (-14%) | 8mo | $170,000 | $101 | 50 |
| 171 Davidson Ave | 0.70mi | 4/2.5 | 1,857 (-5%) | 10mo | $200,000 | $108 | 48 |
| 591 Eggert Rd | 0.42mi | 5/2.0 (+1) | 1,725 (-12%) | 12mo | $250,000 | $145 | 46 |
| 486 Hewitt Ave | 0.34mi | 3/2.0 (-1) | 2,233 (+14%) | 13mo | $176,000 | $79 | 45 |
| 19 Dunlop Ave | 0.70mi | 5/2.0 (+1) | 2,160 (+10%) | 6mo | $160,000 | $74 | 40 |
| 208 Davidson Ave | 0.69mi | 5/2.0 (+1) | 2,199 (+12%) | 8mo | $170,000 | $77 | 36 |
Match score weights: distance 35% · size 25% · config 20% · recency 20%. Top-matched comps best support the ARV.
Projected returns pro-forma
-3.0% appreciation · 0.67% rent growth · sell at horizon
- IRR
- -7.5%
- Equity multiple
- 0.73×
- Total profit
- $-16,647
- Equity at exit
- $32,788
- IRR
- -1.2%
- Equity multiple
- 0.93×
- Total profit
- $-4,462
- Equity at exit
- $19,013
Cash invested: $61,572 (down + closing). Projections, not guarantees.
Landlord ↔ Tenant lean methodology
- Overall (STATE)
- 15 Strongly Tenant-Friendly
- State New York
- 15 Strongly Tenant-Friendly · D+10
- County
- — inherits STATE
- City
- — inherits STATE
ZIP-level market 14215
- Home prices YoY
- -30.0%
- Rents YoY
- 0.7%
- Active inventory
- 239
- Price-to-rent
- 15.2×
Monthly cashflow live
- Estimated rent
- $2,410 high interval (Pro) →
- Mortgage (P&I)
- −$1,153
- Tax est. 1.5%
- −$275 /mo · $3,298/yr
- Insurance
- −$92
- HOA
- −$0
- Vacancy / Maint / Mgmt
- −$506
- Net cashflow
- $384
Break-even live
Sensitivity live
| Price | -10% $536 | -5% $460 | +0% $384 | +5% $308 | +10% $232 |
|---|---|---|---|---|---|
| Rent | -10% $194 | -5% $289 | +0% $384 | +5% $479 | +10% $575 |
| Rate | -1.0pp $495 | -0.5pp $440 | base $384 | +0.5pp $327 | +1.0pp $269 |
2-unit breakdown (identical units grouped — click to expand)
| Units | Beds | Baths | Est. rent |
|---|---|---|---|
| 2× units | 2 | 1 | $2,410 |
| #1 | 2 | 1 | $1,205 |
| #2 | 2 | 1 | $1,205 |
| Total (2 units) | $2,410 | ||
UW: 25.0% down · 7.5% · 30yr · 1.5% tax · 5.0% vac · 8.0% maint · 8.0% mgmt
Financing live
Cash to close
- Down payment
- $54,975
- Closing costs
- $6,597
- Reserves months
- —
- Total cash needed
- —
Loan-product check · same deal, 3 products live
Conventional
25% down · 7.5% · 30yr
- Down + closing
- —
- Monthly P&I
- —
- Monthly cashflow
- —
- DSCR
- —
- Eligible?
- —
Personal DTI + credit; lowest rate.
DSCR
20% down · 8.5% · 30yr
- Down + closing
- —
- Monthly P&I
- —
- Monthly cashflow
- —
- DSCR
- —
- Eligible?
- —
No personal income docs; deal must DSCR.
Hard money
10% down · 12.0% · 12mo
- Down + closing
- —
- Monthly P&I
- —
- Monthly cashflow
- —
- DSCR
- —
- Eligible?
- —
Short-term bridge; refi at stabilization.
Rent comps 22 comps
| Address | Beds | Baths | Sqft | Rent | $/sqft | DOM | Units | Dist |
|---|---|---|---|---|---|---|---|---|
| 263 Minnesota Ave Unit Upper Buffalo, NY | 3.0 | 1.0 | 1242 | $1,500 | $1.21 | 16d | 1 | 0.45mi |
| 222 Lisbon Ave Buffalo, NY | 4.0 | 1.0 | 1300 | $1,400 | $1.08 | 25d | 1 | 0.48mi |
| 222 Lisbon Ave Unit Upper Buffalo, NY | 3.0 | 1.0 | 1400 | $1,400 | $1.00 | 45d | 1 | 0.48mi |
| 175 Lisbon Ave Buffalo, NY | 5.0 | 2.0 | 2000 | $2,500 | $1.25 | 16d | 1 | 0.57mi |
| 65 Northrup Pl Buffalo, NY | 5.0 | 2.0 | 1467 | $2,500 | $1.70 | 16d | 1 | 0.69mi |
| 85 Highgate Ave Buffalo, NY | 5.0 | 2.0 | 2193 | $3,750 | $1.71 | 16d | 1 | 0.70mi |
| 59 Lisbon Ave Buffalo, NY | 3.0 | 1.0 | 2521 | $1,250 | $0.50 | 25d | 1 | 0.79mi |
| 89 Lasalle Ave Buffalo, NY | 1.0–4.0 | 1.0–4.0 | 1024 | $2,997 | $2.93 | 3d | 10 | 0.86mi |
| 60 Englewood Ave Buffalo, NY | 4.0 | 1.0 | 1400 | $1,650 | $1.18 | 3d | 1 | 0.89mi |
| 24 Custer St Buffalo, NY | 5.0 | 2.0 | 2500 | $3,000 | $1.20 | 16d | 1 | 0.90mi |
| 25 Parkridge Ave Buffalo, NY | 3.0 | 1.0 | 1914 | $1,350 | $0.71 | 16d | 1 | 0.95mi |
| 80 Capen Blvd Buffalo, NY | 5.0 | 2.5 | 2591 | $2,800 | $1.08 | 3d | 1 | 0.95mi |
| 91 Englewood Ave Buffalo, NY | 4.0 | 1.0 | 2500 | $2,000 | $0.80 | 3d | 1 | 0.95mi |
| 102 Englewood Ave Buffalo, NY | 4.0 | 1.0 | 2426 | $2,750 | $1.13 | 3d | 1 | 0.97mi |
| 91 Springville Ave Buffalo, NY | 4.0 | 2.0 | 1660 | $2,350 | $1.42 | 25d | 1 | 1.01mi |
| 63 Montrose Ave Buffalo, NY | 4.0 | 1.0 | 2240 | $2,000 | $0.89 | 3d | 1 | 1.02mi |
| 196 Englewood Ave Buffalo, NY | 5.0 | 1.5 | 2560 | $2,000 | $0.78 | 3d | 1 | 1.14mi |
| 44 Aurora Dr Buffalo, NY | 3.0 | 1.0 | 1272 | $3,300 | $2.59 | 3d | 1 | 1.30mi |
| 4098 Bailey Ave Buffalo, NY | 5.0 | 2.5 | 2108 | $2,200 | $1.04 | 45d | 1 | 1.37mi |
| 163 Carmel Rd Buffalo, NY | 3.0 | 1.0 | 1400 | $1,800 | $1.29 | 4d | 1 | 1.39mi |
| 69 Berryman Dr Buffalo, NY | 4.0 | 1.5 | 2056 | $2,950 | $1.43 | 3d | 1 | 1.40mi |
| 348 Capen Blvd Buffalo, NY | 3.0 | 1.5 | 1424 | $2,200 | $1.54 | 3d | 1 | 1.40mi |
Listing history 8 events
-
2026-05-06status Pending 766-char remark
Show marketing remark (766 chars)
Exceptional opportunity to own a well-maintained multifamily property in a highly desirable location! Each unit features 2 spacious bedrooms, offering strong rental appeal and excellent income potential. Enjoy added amenities including a 2-car garage, private balcony, and covered front entrance. The full, clean, dry basement provides ample storage and peace of mind. Ideally situated just minutes from UB, major thoroughfares, shopping, and popular restaurants, this property offers both convenience and consistent tenant demand. A standout feature: separate utilities and thoughtful layout make management easy and maximize profitability. Whether you're expanding your portfolio or looking to owner-occupy, this is a smart investment you won’t want to miss!
-
2026-04-18$219,900 Active 766-char remark
Show marketing remark (766 chars)
Exceptional opportunity to own a well-maintained multifamily property in a highly desirable location! Each unit features 2 spacious bedrooms, offering strong rental appeal and excellent income potential. Enjoy added amenities including a 2-car garage, private balcony, and covered front entrance. The full, clean, dry basement provides ample storage and peace of mind. Ideally situated just minutes from UB, major thoroughfares, shopping, and popular restaurants, this property offers both convenience and consistent tenant demand. A standout feature: separate utilities and thoughtful layout make management easy and maximize profitability. Whether you're expanding your portfolio or looking to owner-occupy, this is a smart investment you won’t want to miss!
-
2025-12-20historical
-
2025-12-14historical
-
2025-12-14historical
-
2025-12-13historical
-
2025-11-01$219,900 Active
-
2003-09-29soldstatus $55,000
ⓘ Source: listings_history table (triggers on properties + properties_extension) + one-shot
backfill from property_details.listing_events for pre-trigger history.
Climate risk First Street
- Flood 1/10 Low FEMA zone X (unshaded) · 0% chance over 30 yrs
- Wildfire 1/10 Low
- Heat 3/10 Moderate 7 d/yr ≥92°F today · 15 d/yr by 30 yrs out
- Wind 1/10 Low
- Air quality 3/10 Moderate 2 unhealthy d/yr today · 3 by 30 yrs out
Nearby sold comps map
Loading sold comps map…
Walkable amenities ~0.75 mi
Loading nearby amenities…
Taxation est. · year 1
- Rental income
- $28,920
- − Mortgage interest
- −$12,318
- − Property taxes
- −$3,298
- − Insurance
- −$1,100
- − Repairs & maintenance
- −$2,314
- − Management
- −$2,314
- − Depreciation
- −$6,397
- Taxable income
- $1,180
- Est. tax owed @ 24.0%
- −$283
- After-tax cash flow
- $4,327/yr
For passive investors: Depreciation is non-cash, so a rental often shows a tax loss while cash-flowing — sheltering income. Rental losses are passive: they offset passive income freely, and up to $25,000/yr can offset ordinary (W-2) income if you actively participate and your MAGI is under $100k (phasing out to $0 by $150k); unused losses carry forward. On sale, claimed depreciation is recaptured at up to 25%, and gains may owe capital-gains tax (a 1031 exchange can defer both). Figures are a year-1 estimate at your 24.0% rate — not tax advice; consult a CPA.
Schools (NCES district)
- District
- Buffalo City School District
- NCES district ID
- 3605850
- Math proficiency
- 41% ▲ 11.00%
- Reading proficiency
- 40% ▲ 7.00%
- Median HH income
- $31,665
- Composite
- 33.17/100
- National rank
- #5544
- State rank
- #535 of 590 in NY
Livability — Buffalo
- Score
- 77/100
- State rank
- #195
- US rank
- #3011
Category grades
Schools grade is shown separately in the Schools card above.
Census & demographics
- Census place
- Buffalo, NY
- County
- Erie County · 714,559 people
- City population
- 440,021
- Metro
- Buffalo-Cheektowaga, NY
- Population (ZIP)
- 42,524
- Household income
- $44,955
- Rent vs Own
- Severe rent burden
- 2873.0
Population outlook (Erie County) Hauer SSP2
- Today (2025)
- 933,037 people
- By 2030
- 935,181 · +0.2%
- By 2040
- 928,531 · -0.5%
- By 2050
- 905,725 · -2.9%
- By 2075
- 834,037 · -10.6%
- By 2100
- 708,033 · -24.1%
Race, ethnicity, and origin ACS 2023
- Neighborhood character
- Predominantly Black (67%)
- Race & ethnicity
- Black 67% White 15% Asian 7% Hispanic / Latino 6% Two or more races 6%
- Hispanic origin (detail)
- Puerto Rican 4%
- Common ancestry
- Romanian 4% Lithuanian 1% Italian 1%
- Foreign-born
- 9% · Canada, China
- Languages at home
- 88% English-only · Other Indo-European 4% Spanish 4% Chinese 1%
Political lean MEDSL · Erie
- 2024 margin
- Lean D (+9.7) · D 54.8% · R 45.2%
- 2008→2024 swing
- -7.9pp toward R · 2008: 17.5pp · 2024: 9.7pp
- All cycles
- 2024: D+9.7 2020: D+14.7 2016: D+4.8 2012: D+15.6 2008: D+17.5
Not yet ingested
- Civics
- —
Market trends
- HPI YoY
- ▼ -126.29%
- Current HPI
- 295.2966
- Rent YoY
- ▲ 0.67%
- Metro
- Buffalo-Cheektowaga, NY
- State GDP YoY
- ▲ 2.60%
- F500 in state
- 92
Industry mix (Fortune 500 HQ in NY)
| Industry | F500 HQs | Revenue |
|---|---|---|
| Financial Services | 10 | $950B |
|
||
| Consumer Goods | 9 | $162B |
|
||
| Insurance | 4 | $225B |
|
||
| Telecommunications | 2 | $144B |
|
||
| Pharmaceuticals | 2 | $112B |
|
||
| Media / Entertainment | 2 | $69B |
|
||
Price history
+299.8% since first listed8 events — show timeline
- 2026-05-06 Pending — WNYREIS
- 2026-04-18 Listed $219,900 WNYREIS
- 2025-12-20 Listing Removed — WNYREIS
- 2025-12-14 Listing Removed — WNYREIS
- 2025-12-14 Listing Removed — WNYREIS
- 2025-12-13 Listing Removed — WNYREIS
- 2025-11-01 Listed $219,900 WNYREIS
- 2003-09-29 Sold (Public Records) $55,000 Public Records
Property tax history
+2.0%/yrLatest (2025): $370 · +0.0% YoY. Source: county tax records.
Cash-flow waterfall
monthlySold comps — $/sqft
last 12 mo · ≤1 miLoading sold comps…