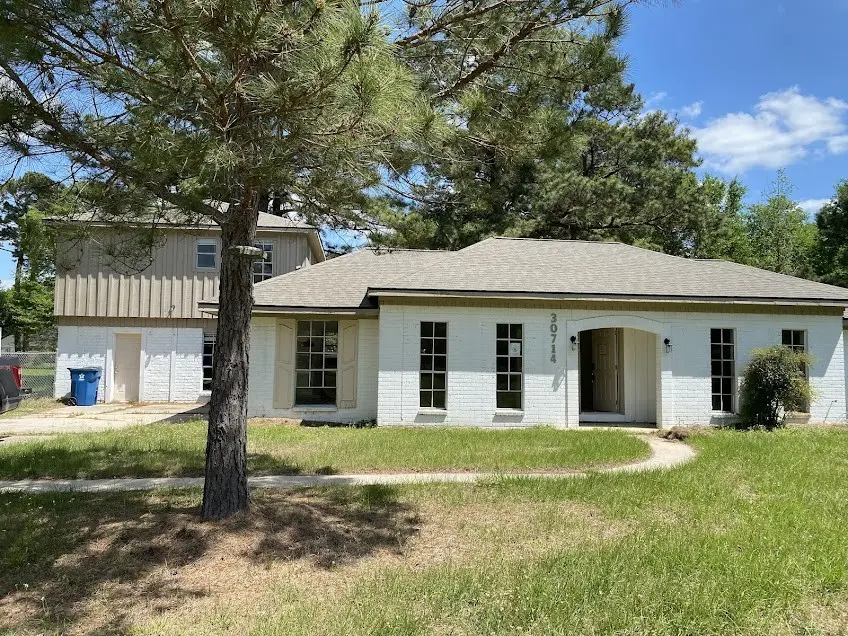
30714 Meadow Wood Lot 64 Dr · Pinehurst, TX
Flood risk 1/10 · Minimal
- FEMA flood zone
- X (unshaded)
- Chance of flooding over 30 yrs
- 0.0%
- Est. flood insurance / yr
- $507 – $1,088
Fire risk 3/10 · Minor
- Est. fire insurance / yr
- $1,222 – $2,270
Heat risk 8/10 · Major
- Hot days now (above 111°F)
- 7 days/yr
- Hot days in 30 yrs
- 22 days/yr
Wind risk 8/10 · Major
- Chance of severe wind over 30 yrs
- 99.0%
Air-quality risk 2/10 · Minimal
- Unhealthy air days now
- 2 days/yr
- Unhealthy air days in 30 yrs
- 2 days/yr
Risk factors via First Street. Map © Google.
Why this score? — see what drove the D+ grade
The composite is a weighted blend of 9 inputs, each scored 0–100. Each bar is that input's sub-score; the figure is the points it added to the 100-point composite (weight × sub-score).
- ARV discount +15.0/15.0
- Appreciation +10.0/10.0
- Cash flow +8.1/30.0
- Schools +3.9/10.0
- Livability +2.8/5.0
- 1% rule +2.6/10.0
- Rent growth +2.6/5.0
- Condition / age +2.5/5.0
- DSCR +2.2/10.0
$299,999
🖨 Deal sheet (PDF) 📄 Offer letter ✓ Due diligence
Listing remarks MLS
LARGE HOME WITH AN OPTION FOR EXTRA 4 LOTS! This charming single-family home offers a spacious living environment with 4 bedrooms and 3 bathrooms. the residence sits on a large ONE ACRE lot in the serene Cripple Creek Farms subdivision. The interior features a versatile floor plan, including an office and two living areas, providing ample space for both relaxation and productivity. The master bedroom offers privacy with a pleasant view of the backyard and convenient access to the main entrance. The property includes a detached carport and an electric gate, ensuring both convenience and security. WANT EXTRA LOTS? You can buy just the house or get a package deal with four extra lots (Lots 63,64,65 and 66) for $534,999. WE MAKE IT EASY TO OWN. This is a great opportunity! Don't wait, call us today to get more information on the owner's easy terms and smooth process that may be able to put the deed in your name and make this your dream home.
Key facts
- Office
- Detached carport
- Electric gate
Tags
Neighborhood map
What this means for you Summary
Snapshot
- This is a 4-bed/1.5-bath single-family listed at $300k.
Deal economics
- At list price, monthly cash flow is $-291 ($-3k/yr) — negative.
- To cash-flow at today's rent, offer at most $249k (17.1% below list).
- To meet the 1% rule (rent ≥ 1% of price), the offer needs to be $229k (23.8% below list).
- Recommended offer: $229k (23.8% below list) — sets the bar for 1% rule.
- Cap rate 5.1% vs local median 2.0% in Pinehurst — top-decile yield for the area; either an underpriced asset or a hidden risk that comps aren't pricing in. Stress-test before assuming the spread holds.
Location & tenants
- Location reads 55/100 on livability (#1,350 in TX) — a working-class tenant base; expect higher turnover. Strengths: cost of living A+, housing B+; Watch: employment C-, crime D-, amenities F.
- Magnolia ISD (rural): math 42% / reading 45% proficiency, ranked #247 of 826 in TX (top 30%) — families likely to look elsewhere, expect single-tenant / working-renter base with shorter leases.
- Zoned schools: Willie E Williams El (math 46% / reading 41%, grade F, #1,269 of 4,322 statewide, top 30%, 869 students, 70% FRL); Magnolia J H (math 35% / reading 37%, grade F, #805 of 1,662 statewide, top 50%, 1,103 students, 57% FRL); Magnolia West H S (math 41% / reading 53%, grade D-, #591 of 1,632 statewide, top 38%, 2,208 students, 52% FRL) — zoned schools average 60% FRL vs 39% district-wide (21 pts higher); higher-poverty schools than district average — tighter screening recommended.
- Market conditions: Rents flat; 1622 active listings in the ZIP; 1 comparable units currently listed for rent nearby; high-income renter base; 13,259 units permitted in Montgomery County in 2024 (1,402 in 5+ unit buildings).
Forward outlook
- In year one you build about $32k of equity ($2k loan paydown + $30k appreciation (10.0% local appreciation)).
- Montgomery County population projected at +65% by 2050 — long-run rental-demand tailwind backs the buy-and-hold thesis.
- By year 2, paydown + projected appreciation supports a ~$52k cash-out refi (75% LTV) — recoverable capital for the next deal without selling this one.
Negotiation context
- It's been on market 390 days — a 12% lower offer ($264k) is reasonable based on typical stale-listing flexibility.
- 11 sale attempts since 23y ago; this cycle's ask has dropped $30k (9%) from the opening price — seller is motivated, your offer sets the floor, not the list.
- Current owner paid $60k; list at $300k implies a 400% gain — meaningful room to come down on a strong offer.
Risks & watch-outs
- Climate carrying-cost: severe wind risk, 99% chance of damaging wind over 30y; extreme-heat days projected 7→22/yr by 2055 (HVAC capex compounding) — expect insurance premiums to compound above CPI over the hold.
Questions for the listing agent
- What do current leases actually rent for vs. the listed asking? Can we see a recent rent roll and the last 12 months of T-12 income?
- It's been on market 390 days. Have you received any prior offers? Is the seller open to a 24% concession, seller financing, or rate buy-down credit?
- Built in 1970 — when were the roof, HVAC, electrical panel, plumbing, and water heater last replaced?
- Why hasn't it sold? Are there any deal-killer items the seller is aware of (foundation, flood, title, zoning, code violations)?
- Is there a deadline driving the sale (1031 exchange, divorce, estate, relocation)? That informs how much negotiation room exists.
- Schools are F-rated, which usually means shorter tenancies and higher turnover. Who's the typical renter profile here, and what's been the actual vacancy rate?
- Crime grade is D in this area — have there been break-ins, vandalism, or insurance claims at this property in the last 3 years? What carrier currently insures it and at what premium?
- The area grade is low — what's the realistic commute time and amenity access for the typical tenant pool here? Any planned neighborhood developments (good or bad) we should know about?
- What's the average days-on-market for RENTAL listings here right now (not sales)? A rising rental-DOM trend means longer vacancies and softer asking-rent achievability than the comps imply.
- What's the recent tenant-quality profile in this submarket — average credit score on applications, eviction rate, late-payment / NSF rate, and stable-employment percentage? A property-management company in the area should have these aggregated.
- How much new for-sale + rental construction is in the pipeline within 1–3 miles? Heavy new supply typically softens prices + rents 12–24 months out; constrained supply supports both.
Investment metrics
- 1% rule
- 0.76% ✗
- Cap rate
- 5.13%
- Cash-on-cash
- -4.15%
- DSCR
- 0.82
- GRM
- 10.9
CMA / ARV
- ARV (median comp)
- $380,143
- List price
- $299,999
- Delta
- -21.08%
- Verdict
- UNDERPRICED
- Comps
- 20 within 1.0 mi
Show comp detail 5 sales within ~0.75 mi
| Address | Dist | Beds/Ba | Sqft | Sold | Price | $/sf | Match |
|---|---|---|---|---|---|---|---|
| 37703 Galleria Oaks Ln | 0.20mi | 3/2.5 (-1) | 3,040 (+10%) | 2mo | $425,000 | $140 | 63 |
| 30918 Sweetwater Cir | 0.61mi | 5/2.5 (+1) | 2,664 (-3%) | 9mo | $300,000 | $113 | 50 |
| 37411 Pierce Hill Ln | 0.69mi | 4/2.5 | 2,631 (-4%) | 13mo | $574,900 | $219 | 45 |
| 37111 Fawn Ln | 0.49mi | 4/2.0 | 2,486 (-10%) | 24mo | $180,000 | $72 | 39 |
| 30003 Misty Meadow Dr | 0.62mi | 3/2.0 (-1) | 2,348 (-15%) | 23mo | $335,000 | $143 | 20 |
Match score weights: distance 35% · size 25% · config 20% · recency 20%. Top-matched comps best support the ARV.
Projected returns pro-forma
10.0% appreciation · 0.32% rent growth · sell at horizon
- IRR
- 20.6%
- Equity multiple
- 2.65×
- Total profit
- $138,908
- Equity at exit
- $270,263
- IRR
- 18.2%
- Equity multiple
- 5.91×
- Total profit
- $412,823
- Equity at exit
- $582,832
Cash invested: $84,000 (down + closing). Projections, not guarantees.
Landlord ↔ Tenant lean methodology
- Overall (STATE)
- 87 Strongly Landlord-Friendly
- State Texas
- 87 Strongly Landlord-Friendly · R+5
- County
- — inherits STATE
- City
- — inherits STATE
ZIP-level market 77354
- Home prices YoY
- 2.4%
- Rents YoY
- 0.3%
- Active inventory
- 1622
- Price-to-rent
- 10.9×
Monthly cashflow live
- Estimated rent
- $2,287 medium interval (Pro) →
- Mortgage (P&I)
- −$1,573
- Tax from tax record
- −$399 /mo · $4,794/yr
- Insurance
- −$125
- HOA
- −$0
- Vacancy / Maint / Mgmt
- −$480
- Net cashflow
- $-291
Break-even live
Sensitivity live
| Price | -10% $-121 | -5% $-206 | +0% $-291 | +5% $-376 | +10% $-461 |
|---|---|---|---|---|---|
| Rent | -10% $-472 | -5% $-381 | +0% $-291 | +5% $-200 | +10% $-110 |
| Rate | -1.0pp $-140 | -0.5pp $-215 | base $-291 | +0.5pp $-369 | +1.0pp $-448 |
UW: 25.0% down · 7.5% · 30yr · 1.5% tax · 5.0% vac · 8.0% maint · 8.0% mgmt
Financing live
Cash to close
- Down payment
- $75,000
- Closing costs
- $9,000
- Reserves months
- —
- Total cash needed
- —
Loan-product check · same deal, 3 products live
Conventional
25% down · 7.5% · 30yr
- Down + closing
- —
- Monthly P&I
- —
- Monthly cashflow
- —
- DSCR
- —
- Eligible?
- —
Personal DTI + credit; lowest rate.
DSCR
20% down · 8.5% · 30yr
- Down + closing
- —
- Monthly P&I
- —
- Monthly cashflow
- —
- DSCR
- —
- Eligible?
- —
No personal income docs; deal must DSCR.
Hard money
10% down · 12.0% · 12mo
- Down + closing
- —
- Monthly P&I
- —
- Monthly cashflow
- —
- DSCR
- —
- Eligible?
- —
Short-term bridge; refi at stabilization.
Rent comps 1 comps
| Address | Beds | Baths | Sqft | Rent | $/sqft | DOM | Units | Dist |
|---|---|---|---|---|---|---|---|---|
| 30906 Sweetwater Cir Magnolia, TX | 4.0 | 2.5 | 2154 | $1,949 | $0.90 | 23d | 1 | 0.63mi |
Listing history 47 events
-
2026-06-21days on market $299,999 Active 390 DOM
-
2026-06-18days on market $299,999 Active 387 DOM
-
2026-06-17days on market $299,999 Active 386 DOM
-
2026-06-16days on market $299,999 Active 385 DOM
-
2026-06-15days on market $299,999 Active 384 DOM
-
2026-06-13days on market $299,999 Active 382 DOM
-
2026-06-09days on market $299,999 Active 378 DOM
-
2026-06-08days on market $299,999 Active 377 DOM
-
2026-06-07days on market $299,999 Active 376 DOM
-
2026-06-04days on market $299,999 Active 373 DOM
-
2026-06-03days on market $299,999 Active 372 DOM
-
2026-06-02days on market $299,999 Active 371 DOM
-
2026-06-01days on market $299,999 Active 370 DOM
-
2026-05-31days on market $299,999 Active 369 DOM
-
2026-04-17price $299,999 952-char remark
Show marketing remark (952 chars)
LARGE HOME WITH AN OPTION FOR EXTRA 4 LOTS! This charming single-family home offers a spacious living environment with 4 bedrooms and 3 bathrooms. the residence sits on a large ONE ACRE lot in the serene Cripple Creek Farms subdivision. The interior features a versatile floor plan, including an office and two living areas, providing ample space for both relaxation and productivity. The master bedroom offers privacy with a pleasant view of the backyard and convenient access to the main entrance. The property includes a detached carport and an electric gate, ensuring both convenience and security. WANT EXTRA LOTS? You can buy just the house or get a package deal with four extra lots (Lots 63,64,65 and 66) for $534,999. WE MAKE IT EASY TO OWN. This is a great opportunity! Don't wait, call us today to get more information on the owner's easy terms and smooth process that may be able to put the deed in your name and make this your dream home.
-
2026-02-17price $319,999 952-char remark
Show marketing remark (952 chars)
LARGE HOME WITH AN OPTION FOR EXTRA 4 LOTS! This charming single-family home offers a spacious living environment with 4 bedrooms and 3 bathrooms. the residence sits on a large ONE ACRE lot in the serene Cripple Creek Farms subdivision. The interior features a versatile floor plan, including an office and two living areas, providing ample space for both relaxation and productivity. The master bedroom offers privacy with a pleasant view of the backyard and convenient access to the main entrance. The property includes a detached carport and an electric gate, ensuring both convenience and security. WANT EXTRA LOTS? You can buy just the house or get a package deal with four extra lots (Lots 63,64,65 and 66) for $534,999. WE MAKE IT EASY TO OWN. This is a great opportunity! Don't wait, call us today to get more information on the owner's easy terms and smooth process that may be able to put the deed in your name and make this your dream home.
-
2025-07-17historical
-
2025-05-27$329,999 Active 952-char remark
Show marketing remark (952 chars)
LARGE HOME WITH AN OPTION FOR EXTRA 4 LOTS! This charming single-family home offers a spacious living environment with 4 bedrooms and 3 bathrooms. the residence sits on a large ONE ACRE lot in the serene Cripple Creek Farms subdivision. The interior features a versatile floor plan, including an office and two living areas, providing ample space for both relaxation and productivity. The master bedroom offers privacy with a pleasant view of the backyard and convenient access to the main entrance. The property includes a detached carport and an electric gate, ensuring both convenience and security. WANT EXTRA LOTS? You can buy just the house or get a package deal with four extra lots (Lots 63,64,65 and 66) for $534,999. WE MAKE IT EASY TO OWN. This is a great opportunity! Don't wait, call us today to get more information on the owner's easy terms and smooth process that may be able to put the deed in your name and make this your dream home.
-
2024-09-09price $106,699
-
2024-09-06soldstatus $60,000
-
2024-07-22historical
-
2024-07-17$109,999 Active
-
2024-06-19price $350,000
-
2024-05-07price $360,000
-
2024-04-13$375,000 Active
-
2024-01-01historical
-
2022-04-19soldstatus
-
2022-04-01$109,999 Active
-
2022-03-01soldstatus Sold
-
2022-02-25status Pending
-
2021-08-24$279,999 Active
-
2014-06-11historical
-
2014-06-01status Pending
-
2012-10-01soldstatus $500
-
2012-09-01historical
-
2012-05-31$99,900
-
2011-01-26historical
-
2009-09-04$185,000
-
2009-09-04historical
-
2009-02-12$185,000
-
2006-01-17soldstatus $75,501
-
2006-01-12historical
-
2006-01-10$185,000
-
2003-05-31historical
-
2003-05-19$155,000
-
2003-05-12historical
-
2003-02-13$155,000
ⓘ Source: listings_history table (triggers on properties + properties_extension) + one-shot
backfill from property_details.listing_events for pre-trigger history.
Tax reassessment forecast TX · Resets to sale price
- Current annual tax
- $4,794 · $399/mo
- Projected year-2 tax
- $5,490 · $457/mo
- Expected delta
- +$696/yr (+$58/mo · 14.5%)
ⓘ Screening estimate from a state-policy table — verify with the county assessor before closing.
Climate risk First Street
- Flood 1/10 Low FEMA zone X (unshaded) · 0% chance over 30 yrs
- Wildfire 3/10 Moderate
- Heat 8/10 Severe 7 d/yr ≥111°F today · 22 d/yr by 30 yrs out
- Wind 8/10 Severe 99% chance of damaging wind over 30 yrs
- Air quality 2/10 Low 2 unhealthy d/yr today · 2 by 30 yrs out
Nearby sold comps map
Loading sold comps map…
Walkable amenities ~0.75 mi
Loading nearby amenities…
Taxation est. · year 1
- Rental income
- $27,447
- − Mortgage interest
- −$16,805
- − Property taxes
- −$4,794
- − Insurance
- −$1,500
- − Repairs & maintenance
- −$2,196
- − Management
- −$2,196
- − Depreciation
- −$8,727
- Taxable loss
- −$8,771
- Est. tax savings @ 24.0%
- +$2,105
- After-tax cash flow
- $-1,385/yr
For passive investors: Depreciation is non-cash, so a rental often shows a tax loss while cash-flowing — sheltering income. Rental losses are passive: they offset passive income freely, and up to $25,000/yr can offset ordinary (W-2) income if you actively participate and your MAGI is under $100k (phasing out to $0 by $150k); unused losses carry forward. On sale, claimed depreciation is recaptured at up to 25%, and gains may owe capital-gains tax (a 1031 exchange can defer both). Figures are a year-1 estimate at your 24.0% rate — not tax advice; consult a CPA.
Schools (NCES district)
- District
- Magnolia ISD
- NCES district ID
- 4828740
- Math proficiency
- 42% ▼ -7.00%
- Reading proficiency
- 45% ▼ -4.00%
- Median HH income
- $71,692
- Composite
- 39.46/100
- National rank
- #3958
- State rank
- #247 of 826 in TX
Livability — Pinehurst
- Score
- 55/100
- State rank
- #1350
- US rank
- #23272
Category grades
Schools grade is shown separately in the Schools card above.
Census & demographics
- Census place
- Pinehurst, TX
- County
- Montgomery County · 663,713 people
- Metro
- Houston-The Woodlands-Sugar Land, TX
- Population (ZIP)
- 44,900
- Household income
- $112,504
- Rent vs Own
- Severe rent burden
- 586.0
Population outlook (Montgomery County) Hauer SSP2
- Today (2025)
- 713,896 people
- By 2030
- 805,263 · +12.8%
- By 2040
- 992,708 · +39.1%
- By 2050
- 1,179,590 · +65.2%
- By 2075
- 1,628,084 · +128.1%
- By 2100
- 1,937,880 · +171.5%
Race, ethnicity, and origin ACS 2023
- Neighborhood character
- Predominantly White (66%)
- Race & ethnicity
- White 66% Hispanic / Latino 25% Two or more races 18% Black 3% Asian 1%
- Hispanic origin (detail)
- Mexican 14% Puerto Rican 1%
- Common ancestry
- Lithuanian 4% Slovak 2% Italian 2%
- Foreign-born
- 11% · Canada, Vietnam
- Languages at home
- 83% English-only · Spanish 15% Other Indo-European 1% German/W. Germanic 1%
Political lean MEDSL · Montgomery
- 2024 margin
- Solid R (+45.5) · D 26.8% · R 72.3%
- 2008→2024 swing
- +7.2pp toward D · 2008: -52.7pp · 2024: -45.5pp
- All cycles
- 2024: R+45.5 2020: R+43.8 2016: R+51.4 2012: R+60.7 2008: R+52.7
Not yet ingested
- Civics
- —
Market trends
- HPI YoY
- ▲ 12.09%
- Current HPI
- 512.87
- Rent YoY
- ▲ 0.32%
- Metro
- Houston-The Woodlands-Sugar Land, TX
- State GDP YoY
- ▲ 3.95%
- F500 in state
- 110
Industry mix (Fortune 500 HQ in TX)
| Industry | F500 HQs | Revenue |
|---|---|---|
| Energy | 16 | $1,198B |
|
||
| Technology | 5 | $198B |
|
||
| Engineering / Construction | 4 | $72B |
|
||
| Energy Services | 3 | $60B |
|
||
| Utilities | 3 | $41B |
|
||
| Healthcare | 2 | $330B |
|
||
Price history
+93.5% since first listed33 events — show timeline
- 2026-04-17 Price Changed $299,999 HARMLS
- 2026-02-17 Price Changed $319,999 HARMLS
- 2025-07-17 Listing Removed — HARMLS
- 2025-05-27 Listed $329,999 HARMLS
- 2024-09-09 Price Changed $106,699 HARMLS
- 2024-09-06 Sold (Public Records) $60,000 Public Records
- 2024-07-22 Listing Removed — HARMLS
- 2024-07-17 Listed $109,999 HARMLS
- 2024-06-19 Price Changed $350,000 HARMLS
- 2024-05-07 Price Changed $360,000 HARMLS
- 2024-04-13 Listed $375,000 HARMLS
- 2024-01-01 Listing Removed — HARMLS
- 2022-04-19 Sold (Public Records) — Public Records
- 2022-04-01 Listed $109,999 HARMLS
- 2022-03-01 Sold (MLS) — HARMLS
- 2022-02-25 Pending — HARMLS
- 2021-08-24 Listed $279,999 HARMLS
- 2014-06-11 Listing Removed — HARMLS
- 2014-06-01 Pending — HARMLS
- 2012-10-01 Sold (Public Records) $500 Public Records
- 2012-09-01 Listing Removed — HARMLS
- 2012-05-31 Listed $99,900 HARMLS
- 2011-01-26 Listing Removed — HARMLS
- 2009-09-04 Listing Removed — HARMLS
- 2009-09-04 Listed $185,000 HARMLS
- 2009-02-12 Listed $185,000 HARMLS
- 2006-01-17 Sold (Public Records) $75,501 Public Records
- 2006-01-12 Listing Removed — HARMLS
- 2006-01-10 Listed $185,000 HARMLS
- 2003-05-31 Listing Removed — HARMLS
- 2003-05-19 Listed $155,000 HARMLS
- 2003-05-12 Listing Removed — HARMLS
- 2003-02-13 Listed $155,000 HARMLS
Property tax history
+3.7%/yrLatest (2025): $4,794 · -1.7% YoY. Source: county tax records.
Cash-flow waterfall
monthlySold comps — $/sqft
last 12 mo · ≤1 miLoading sold comps…