 30-Plex
400 W Forest Ave · Coalinga, CA
Flood risk 3/10 · Minor
- FEMA flood zone
- X (unshaded)
- Chance of flooding over 30 yrs
- 0.1%
- Est. flood insurance / yr
- $507 – $1,088
Fire risk 7/10 · Major
- Est. fire insurance / yr
- $659 – $1,223
Heat risk 8/10 · Major
- Hot days now (above 105°F)
- 6 days/yr
- Hot days in 30 yrs
- 15 days/yr
Wind risk 1/10 · Minimal
- Chance of severe wind over 30 yrs
- —
Air-quality risk 9/10 · Severe
- Unhealthy air days now
- 20 days/yr
- Unhealthy air days in 30 yrs
- 21 days/yr
Risk factors via First Street. Map © Google.
Why this score? — see what drove the C- grade
The composite is a weighted blend of 9 inputs, each scored 0–100. Each bar is that input's sub-score; the figure is the points it added to the 100-point composite (weight × sub-score).
- Cash flow +22.2/30.0
- ARV discount +7.5/15.0
- DSCR +7.1/10.0
- 1% rule +5.1/10.0
- Livability +2.7/5.0
- Rent growth +2.5/5.0
- Condition / age +2.5/5.0
- Schools +2.3/10.0
- Appreciation +0.0/10.0
$4,780,000
🖨 Deal sheet (PDF) 📄 Offer letter ✓ Due diligence
Multi-family units
County records classify this as Multi-Family (5+ Unit). Listing-text estimate: 30 units. confirmed
5+ unit building — per-unit beds/baths from public records are typically unavailable; the breakdown below (if shown) is an estimate from the listing text.
Listing remarks
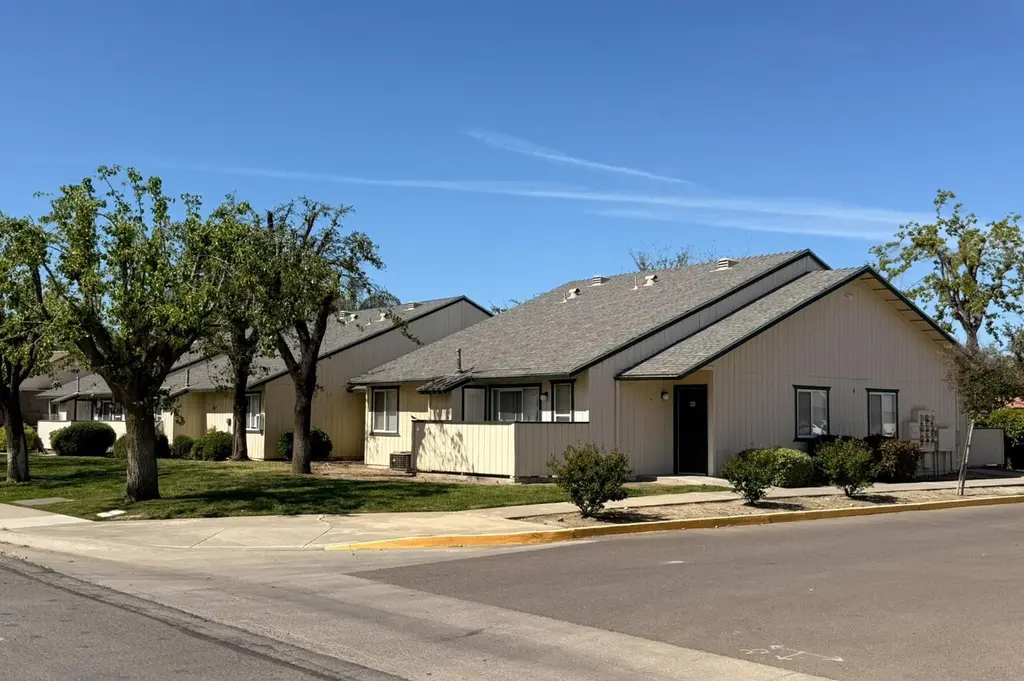
Ridgeview Apartments was built in 1995, a single-story garden-style Class B community consisting of 6 one-bedroom, 18 two-bedroom/one-bath, 6 two-bedroom/two-bath, and 12 three-bedroom/two-bath units - 42 spacious units across 8 buildings on 5.19 acres. The property's single-story layout offers a family-friendly living environment that appeals strongly to long-term renters, contributing to the property's current 100% occupancy. Considered by local residents as their preferred community in Coalinga, when a unit becomes available it's rented quickly. Multiple units are below establish units rents already in place giving a clear path to increased NOI for a new owner.
Key facts
- 5.19 acre lot
- Community pool
- Built 1995
Property features AI
Finance
- HOA & community: On-site manager; Community pool; Playground
Exterior
- Parking: Carport; Covered parking; Open parking available; More than one parking space per unit
- Utilities: Electric service available; Public sewer; Public utilities
- Home design: Multi-family property; Composition roof; Wood siding; Concrete perimeter foundation
- Construction: Wood siding construction; Composition roof; Concrete perimeter foundation
- Exterior features: One level; Patio; Suburban setting; Automatic sprinkler system; Mature landscaping
Interior
- Kitchen: Refrigerator; Dishwasher; Garbage disposal; Stove
- Bathrooms: Multiple bathrooms (total indicated as 60 across property)
- Heating & cooling: Central heating and cooling
- Interior features: Refrigerator included in all units; Dishwasher included in all units; Garbage disposal included in all units; Stove included in all units; In-unit laundry; No fireplaces; Central heat and air
- Laundry & utility: Laundry in each unit
Neighborhood map
What this means for you Summary
Snapshot
- This is a 30 × 3-bed/?-bath units multifamily listed at $4.78M.
Deal economics
- At list price, monthly cash flow is $8k ($93k/yr) — positive. Per door: $258/mo.
- The deal already cash-flows at list — no discount required.
- Meets the 1% rule at list price ($48k rent vs $4.78M).
- Recommended offer: $4.64M (3.0% below list) — sets the bar for market timing.
- Cap rate 8.2% vs local median 3.9% in Coalinga — top-decile yield for the area; either an underpriced asset or a hidden risk that comps aren't pricing in. Stress-test before assuming the spread holds.
Location & tenants
- Location reads 53/100 on livability (#946 in CA) — a working-class tenant base; expect higher turnover. Strengths: housing A+; Watch: cost of living D+, amenities F, commute F.
- Coalinga-Huron Unified (town): math 14% / reading 40% proficiency, ranked #384 of 517 in CA (top 74%) — low school quality limits family demand, transient renter base, plan for 1-2y turnover; 73% free/reduced lunch — lower-income household profile, screen leases tightly.
- Zoned schools: Nell Dawson Elementary (453 students, 81% FRL); Coalinga Middle (684 students, 84% FRL); Coalinga High (math 17% / reading 42%, grade F, #750 of 1,170 statewide, top 66%, 1,266 students, 89% FRL).
- Market conditions: 76 active listings in the ZIP; 2,426 units permitted in Fresno County in 2024 (296 in 5+ unit buildings).
- At $48,378/mo this rent would consume 776% of the median local household income ($75k/yr) (locally 336% of renters already pay >50% of income on rent) — very limited rent-growth headroom before tenants either downsize or default.
Forward outlook
- Local home prices are declining (-3.0%/yr); year-one equity from $33k of loan paydown is wiped out by about $143k of value loss. Plan a longer hold.
- Fresno County population projected at +11% by 2050 — modest demand growth; plan on rents tracking national, not racing it.
Negotiation context
- It's been on market 48 days — a 3% lower offer ($4.64M) is reasonable based on typical stale-listing flexibility.
- 5 sale attempts since 23y ago with the ask held roughly flat each time — persistent listings suggest the price (not the market) is what's stuck; bring a comps-based counter.
- Current owner paid $3.00M; list at $4.78M implies a 59% gain — meaningful room to come down on a strong offer.
Risks & watch-outs
- Climate carrying-cost: major wildfire risk; extreme-heat days projected 6→15/yr by 2055 (HVAC capex compounding) — expect insurance premiums to compound above CPI over the hold.
Questions for the listing agent
- It's been on market 48 days. Have you received any prior offers? Is the seller open to a 3% concession, seller financing, or rate buy-down credit?
- Can we see the unit-by-unit rent roll, current vacancy, and any below-market leases? What's the average tenancy length?
- What capital expenditures (roof, boiler, parking lot, exteriors) have been made in the last 5 years, and what's planned in the next 2?
- Is there a deadline driving the sale (1031 exchange, divorce, estate, relocation)? That informs how much negotiation room exists.
- Schools are F-rated, which usually means shorter tenancies and higher turnover. Who's the typical renter profile here, and what's been the actual vacancy rate?
- What's the average days-on-market for RENTAL listings here right now (not sales)? A rising rental-DOM trend means longer vacancies and softer asking-rent achievability than the comps imply.
- What's the recent tenant-quality profile in this submarket — average credit score on applications, eviction rate, late-payment / NSF rate, and stable-employment percentage? A property-management company in the area should have these aggregated.
- How much new apartment / multifamily construction is in the pipeline within 1–3 miles? Heavy new supply (>2% of stock underway) typically softens rents 12–24 months out; light construction supports rent growth.
Investment metrics
- 1% rule
- 1.01% ✓
- Cap rate
- 8.24%
- Cash-on-cash
- 6.95%
- DSCR
- 1.31
- GRM
- 8.2
CMA / ARV
No comps found within radius.
Projected returns pro-forma
-3.0% appreciation · 3.0% rent growth · sell at horizon
- IRR
- -5.7%
- Equity multiple
- 0.79×
- Total profit
- $-281,601
- Equity at exit
- $712,714
- IRR
- 4.0%
- Equity multiple
- 1.29×
- Total profit
- $387,204
- Equity at exit
- $413,287
Cash invested: $1,338,400 (down + closing). Projections, not guarantees.
Landlord ↔ Tenant lean methodology
- Overall (STATE)
- 18 Strongly Tenant-Friendly
- State California
- 18 Strongly Tenant-Friendly · D+13
- County
- — inherits STATE
- City
- — inherits STATE
ZIP-level market 93210
- Home prices YoY
- -11.7%
- Active inventory
- 76
- Price-to-rent
- 247.0×
Monthly cashflow live
- Estimated rent
- $48,378 high interval (Pro) →
- Mortgage (P&I)
- −$25,067
- Tax from tax record
- −$3,407 /mo · $40,882/yr
- Insurance
- −$1,992
- HOA
- −$0
- Lot rent
- −$0
- Vacancy / Maint / Mgmt
- −$10,159
- Net cashflow
- $7,753
Break-even live
Sensitivity live
| Price | -10% $10,459 | -5% $9,106 | +0% $7,753 | +5% $6,400 | +10% $5,047 |
|---|---|---|---|---|---|
| Rent | -10% $3,931 | -5% $5,842 | +0% $7,753 | +5% $9,664 | +10% $11,575 |
| Rate | -1.0pp $10,161 | -0.5pp $8,969 | base $7,753 | +0.5pp $6,515 | +1.0pp $5,255 |
30-unit breakdown (identical units grouped — click to expand)
| Units | Beds | Baths | Est. rent |
|---|---|---|---|
| 30× units | 3 | — | $48,390 |
| #1 | 3 | — | $1,613 |
| #2 | 3 | — | $1,613 |
| #3 | 3 | — | $1,613 |
| #4 | 3 | — | $1,613 |
| #5 | 3 | — | $1,613 |
| #6 | 3 | — | $1,613 |
| #7 | 3 | — | $1,613 |
| #8 | 3 | — | $1,613 |
| #9 | 3 | — | $1,613 |
| #10 | 3 | — | $1,613 |
| #11 | 3 | — | $1,613 |
| #12 | 3 | — | $1,613 |
| #13 | 3 | — | $1,613 |
| #14 | 3 | — | $1,613 |
| #15 | 3 | — | $1,613 |
| #16 | 3 | — | $1,613 |
| #17 | 3 | — | $1,613 |
| #18 | 3 | — | $1,613 |
| #19 | 3 | — | $1,613 |
| #20 | 3 | — | $1,613 |
| #21 | 3 | — | $1,613 |
| #22 | 3 | — | $1,613 |
| #23 | 3 | — | $1,613 |
| #24 | 3 | — | $1,613 |
| #25 | 3 | — | $1,613 |
| #26 | 3 | — | $1,613 |
| #27 | 3 | — | $1,613 |
| #28 | 3 | — | $1,613 |
| #29 | 3 | — | $1,613 |
| #30 | 3 | — | $1,613 |
| Total (30 units) | $48,378 | ||
UW: 25.0% down · 7.5% · 30yr · 1.5% tax · 5.0% vac · 8.0% maint · 8.0% mgmt
Financing live
Cash to close
- Down payment
- $1,195,000
- Closing costs
- $143,400
- Reserves months
- —
- Total cash needed
- —
Loan-product check · same deal, 3 products live
Conventional
25% down · 7.5% · 30yr
- Down + closing
- —
- Monthly P&I
- —
- Monthly cashflow
- —
- DSCR
- —
- Eligible?
- —
Personal DTI + credit; lowest rate.
DSCR
20% down · 8.5% · 30yr
- Down + closing
- —
- Monthly P&I
- —
- Monthly cashflow
- —
- DSCR
- —
- Eligible?
- —
No personal income docs; deal must DSCR.
Hard money
10% down · 12.0% · 12mo
- Down + closing
- —
- Monthly P&I
- —
- Monthly cashflow
- —
- DSCR
- —
- Eligible?
- —
Short-term bridge; refi at stabilization.
Listing history 29 events
-
2026-06-23days on market $4,780,000 Active 48 DOM
-
2026-06-21days on market $4,780,000 Active 47 DOM
-
2026-06-19days on market $4,780,000 Active 45 DOM
-
2026-06-18days on market $4,780,000 Active 44 DOM
-
2026-06-17days on market $4,780,000 Active 43 DOM
-
2026-06-16days on market $4,780,000 Active 42 DOM
-
2026-06-15days on market $4,780,000 Active 41 DOM
-
2026-06-14days on market $4,780,000 Active 39 DOM
-
2026-06-13days on market $4,780,000 Active 38 DOM
-
2026-06-10days on market $4,780,000 Active 36 DOM
-
2026-06-09days on market $4,780,000 Active 35 DOM
-
2026-06-08days on market $4,780,000 Active 34 DOM
-
2026-06-07days on market $4,780,000 Active 33 DOM
-
2026-06-02days on market $4,780,000 Active 28 DOM
-
2026-06-01days on market $4,780,000 Active 27 DOM
-
2026-05-31days on market $4,780,000 Active 26 DOM
-
2026-05-30days on market $4,780,000 Active 25 DOM
-
2026-05-05$4,780,000 Active 670-char remark
-
2021-01-13soldstatus $3,000,000
-
2017-05-01soldstatus $2,900,000
-
2017-04-06historical
-
2017-02-01historical
-
2012-07-22$3,800,000
-
2005-08-31$3,400,000
-
2005-08-31$3,400,000
-
2004-06-25soldstatus $2,700,000
-
2004-06-25soldstatus $2,771,143
-
2003-11-01historical
-
2003-08-30$2,700,000
ⓘ Source: listings_history table (triggers on properties + properties_extension) + one-shot
backfill from property_details.listing_events for pre-trigger history.
Tax reassessment forecast CA · Resets to sale price
- Current annual tax
- $40,882 · $3,407/mo
- Projected year-2 tax
- $40,882 · $3,407/mo
- Expected delta
- $0/yr ($0/mo · 0.0%)
ⓘ Screening estimate from a state-policy table — verify with the county assessor before closing.
Climate risk First Street
- Flood 3/10 Moderate FEMA zone X (unshaded) · 10% chance over 30 yrs
- Wildfire 7/10 Severe
- Heat 8/10 Severe 6 d/yr ≥105°F today · 15 d/yr by 30 yrs out
- Wind 1/10 Low
- Air quality 9/10 Extreme 20 unhealthy d/yr today · 21 by 30 yrs out
Nearby sold comps map
Loading sold comps map…
Walkable amenities ~0.75 mi
Loading nearby amenities…
Taxation est. · year 1
- Rental income
- $580,536
- − Mortgage interest
- −$267,754
- − Property taxes
- −$40,882
- − Insurance
- −$23,900
- − Repairs & maintenance
- −$46,443
- − Management
- −$46,443
- − Depreciation
- −$139,055
- Taxable income
- $16,060
- Est. tax owed @ 24.0%
- −$3,854
- After-tax cash flow
- $89,185/yr
For passive investors: Depreciation is non-cash, so a rental often shows a tax loss while cash-flowing — sheltering income. Rental losses are passive: they offset passive income freely, and up to $25,000/yr can offset ordinary (W-2) income if you actively participate and your MAGI is under $100k (phasing out to $0 by $150k); unused losses carry forward. On sale, claimed depreciation is recaptured at up to 25%, and gains may owe capital-gains tax (a 1031 exchange can defer both). Figures are a year-1 estimate at your 24.0% rate — not tax advice; consult a CPA.
Schools (NCES district)
- District
- Coalinga-Huron Unified
- NCES district ID
- 0609120
- Math proficiency
- 14% ▼ -3.00%
- Reading proficiency
- 40% ▲ 10.00%
- Median HH income
- $40,366
- Composite
- 22.69/100
- National rank
- #8040
- State rank
- #384 of 517 in CA
Livability — Coalinga
- Score
- 53/100
- State rank
- #946
- US rank
- #24409
Category grades
Schools grade is shown separately in the Schools card above.
Census & demographics
- Census place
- Coalinga, CA
- County
- Fresno County · 834,801 people
- City population
- 18,491
- Metro
- Fresno, CA
- Population (ZIP)
- 18,491
- Household income
- $74,817
- Rent vs Own
- Severe rent burden
- 336.0
Population outlook (Fresno County) Hauer SSP2
- Today (2025)
- 1,042,971 people
- By 2030
- 1,072,198 · +2.8%
- By 2040
- 1,122,408 · +7.6%
- By 2050
- 1,157,251 · +11.0%
- By 2075
- 1,182,575 · +13.4%
- By 2100
- 1,105,899 · +6.0%
Race, ethnicity, and origin ACS 2023
- Neighborhood character
- Predominantly Hispanic (66%)
- Race & ethnicity
- Hispanic / Latino 66% White 24% Two or more races 18% Black 4% Asian 3% Native American 2%
- Hispanic origin (detail)
- Mexican 59% Puerto Rican 1%
- Common ancestry
- Lithuanian 2% Italian 1% Slovak 1%
- Foreign-born
- 22% · Canada
- Languages at home
- 47% English-only · Spanish 50% Other Asian/Pacific 1% Tagalog/Filipino 1%
Political lean MEDSL · Fresno
- 2024 margin
- Toss-up / Even · D 46.5% · R 50.9% · Other 2.6%
- 2008→2024 swing
- -6.5pp toward R · 2008: 2.1pp · 2024: -4.4pp
- All cycles
- 2024: R+4.4 2020: D+7.8 2016: D+3.9 2012: R+2.9 2008: D+2.1
Not yet ingested
- Civics
- —
Market trends
- HPI YoY
- ▼ -39.35%
- Current HPI
- 296.6031
- Rent YoY
- —
- Metro
- Fresno, CA
- State GDP YoY
- ▲ 3.21%
- F500 in state
- 116
Industry mix (Fortune 500 HQ in CA)
| Industry | F500 HQs | Revenue |
|---|---|---|
| Technology | 27 | $1,492B |
|
||
| Financial Services | 3 | $174B |
|
||
| Retail | 3 | $44B |
|
||
| Insurance | 3 | $26B |
|
||
| Media / Entertainment | 2 | $115B |
|
||
| Pharmaceuticals / Biotech | 2 | $62B |
|
||
Price history
+77.0% since first listed12 events — show timeline
- 2026-05-05 Listed $4,780,000 FRESNOMLS
- 2021-01-13 Sold (Public Records) $3,000,000 Public Records
- 2017-05-01 Sold (Public Records) $2,900,000 Public Records
- 2017-04-06 Listing Removed — NSBCRMLS
- 2017-02-01 Listing Removed — CRMLS
- 2012-07-22 Listed $3,800,000 CRMLS
- 2005-08-31 Listed $3,400,000 CRMLS
- 2005-08-31 Listed $3,400,000 NSBCRMLS
- 2004-06-25 Sold (Public Records) $2,771,143 Public Records
- 2004-06-25 Sold (MLS) $2,700,000 FRESNOMLS
- 2003-11-01 Delisted — FRESNOMLS
- 2003-08-30 Listed $2,700,000 FRESNOMLS
Property tax history
-1.2%/yrLatest (2025): $40,882 · +1.5% YoY. Source: county tax records.
Cash-flow waterfall
monthlySold comps — $/sqft
last 12 mo · ≤1 miLoading sold comps…