281 Holland Rd · Lucedale, MS
Flood risk 1/10 · Minimal
- FEMA flood zone
- X (unshaded)
- Chance of flooding over 30 yrs
- 0.0%
- Est. flood insurance / yr
- $507 – $1,088
Fire risk 7/10 · Major
- Est. fire insurance / yr
- $1,241 – $2,305
Heat risk 8/10 · Major
- Hot days now (above 107°F)
- 7 days/yr
- Hot days in 30 yrs
- 21 days/yr
Wind risk 9/10 · Severe
- Chance of severe wind over 30 yrs
- 99.0%
Air-quality risk 1/10 · Minimal
- Unhealthy air days now
- 0 days/yr
- Unhealthy air days in 30 yrs
- 0 days/yr
Risk factors via First Street. Map © Google.
Why this score? — see what drove the C grade
The composite is a weighted blend of 9 inputs, each scored 0–100. Each bar is that input's sub-score; the figure is the points it added to the 100-point composite (weight × sub-score).
- Cash flow +20.6/30.0
- ARV discount +15.0/15.0
- DSCR +6.5/10.0
- 1% rule +5.4/10.0
- Schools +3.7/10.0
- Livability +3.2/5.0
- Rent growth +2.5/5.0
- Condition / age +2.2/5.0
- Appreciation +0.0/10.0
$97,000
🖨 Deal sheet 📄 Offer letter ✓ Due diligence
Listing remarks MLS
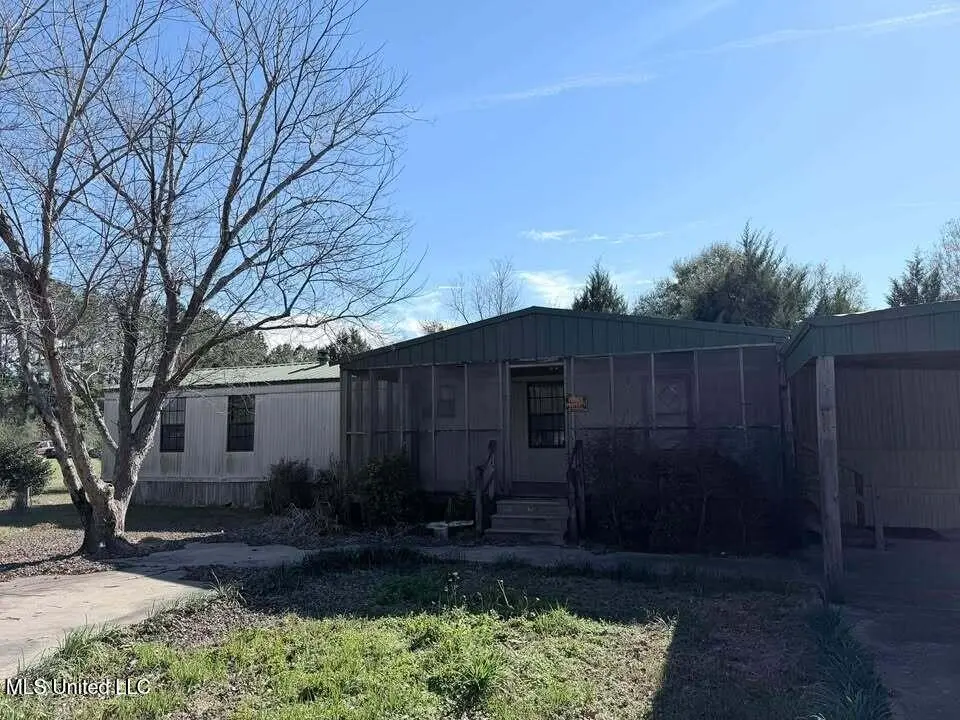
Well-located 1,280 sq ft mobile home on 1.7 acres with a carport and ample room behind the home for expansion. Convenient to town and ideal for an investment opportunity.
Key facts
- Carport
- Room for expansion
- 1.7 acres
Tags
Neighborhood map
What this means for you Summary
Snapshot
- This is a 3-bed/2.0-bath manufactured listed at $97k. Condition is rated fair.
Deal economics
- At list price, monthly cash flow is $130 ($2k/yr) — positive.
- The deal already cash-flows at list — no discount required.
- Meets the 1% rule at list price ($1k rent vs $97k).
- Recommended offer: $85k (12.0% below list) — sets the bar for market timing.
- Cap rate 7.9% vs local median 2.2% in Lucedale — top-decile yield for the area; either an underpriced asset or a hidden risk that comps aren't pricing in. Stress-test before assuming the spread holds.
Location & tenants
- Location reads 65/100 on livability (#110 in MS) — a middle-class / working-renter tenant base. Strengths: cost of living A+, housing A+, health & safety A+; Watch: schools F, crime F, amenities F.
- George County School District (rural): math 45% / reading 42% proficiency, ranked #30 of 130 in MS (top 23%) — families likely to look elsewhere, expect single-tenant / working-renter base with shorter leases; 60% free/reduced lunch — lower-income household profile, screen leases tightly.
- Market conditions: 289 active listings in the ZIP; 30 units permitted in George County in 2024 (0 in 5+ unit buildings).
Forward outlook
- Local home prices are declining (-3.0%/yr); year-one equity from $671 of loan paydown is wiped out by about $3k of value loss. Plan a longer hold.
- George County population projected at +4% by 2050 — modest demand growth; plan on rents tracking national, not racing it.
Negotiation context
- It's been on market 142 days — a 12% lower offer ($85k) is reasonable based on typical stale-listing flexibility.
Risks & watch-outs
- Climate carrying-cost: severe wind risk, 99% chance of damaging wind over 30y; major wildfire risk; extreme-heat days projected 7→21/yr by 2055 (HVAC capex compounding) — expect insurance premiums to compound above CPI over the hold.
Questions for the listing agent
- It's been on market 142 days. Have you received any prior offers? Is the seller open to a 12% concession, seller financing, or rate buy-down credit?
- Have any recent inspections been done? Can we get a copy of the seller's disclosures and any deferred-maintenance estimates?
- Why hasn't it sold? Are there any deal-killer items the seller is aware of (foundation, flood, title, zoning, code violations)?
- Is there a deadline driving the sale (1031 exchange, divorce, estate, relocation)? That informs how much negotiation room exists.
- Schools are F-rated, which usually means shorter tenancies and higher turnover. Who's the typical renter profile here, and what's been the actual vacancy rate?
- Crime grade is F in this area — have there been break-ins, vandalism, or insurance claims at this property in the last 3 years? What carrier currently insures it and at what premium?
- What's the average days-on-market for RENTAL listings here right now (not sales)? A rising rental-DOM trend means longer vacancies and softer asking-rent achievability than the comps imply.
- What's the recent tenant-quality profile in this submarket — average credit score on applications, eviction rate, late-payment / NSF rate, and stable-employment percentage? A property-management company in the area should have these aggregated.
- How much new for-sale + rental construction is in the pipeline within 1–3 miles? Heavy new supply typically softens prices + rents 12–24 months out; constrained supply supports both.
Investment metrics
- 1% rule
- 1.04% ✓
- Cap rate
- 7.90%
- Cash-on-cash
- 5.73%
- DSCR
- 1.25
- GRM
- 8.0
CMA / ARV
- ARV (median comp)
- $146,342
- List price
- $97,000
- Delta
- -33.72%
- Verdict
- UNDERPRICED
- Comps
- 2 within 2.0 mi
Projected returns pro-forma
-3.0% appreciation · 3.0% rent growth · sell at horizon
- IRR
- -7.4%
- Equity multiple
- 0.73×
- Total profit
- $-7,442
- Equity at exit
- $14,463
- IRR
- 2.2%
- Equity multiple
- 1.16×
- Total profit
- $4,219
- Equity at exit
- $8,387
Cash invested: $27,160 (down + closing). Projections, not guarantees.
Landlord ↔ Tenant lean methodology
- Overall (STATE)
- 90 Strongly Landlord-Friendly
- State Mississippi
- 90 Strongly Landlord-Friendly · R+11
- County
- — inherits STATE
- City
- — inherits STATE
ZIP-level market 39452
- Home prices YoY
- -14.8%
- Active inventory
- 289
- Price-to-rent
- 8.0×
Monthly cashflow live
- Estimated rent
- $1,013 medium interval (Pro) →
- Mortgage (P&I)
- −$509
- Tax est. 1.5%
- −$121 /mo · $1,455/yr
- Insurance
- −$40
- HOA
- −$0
- Vacancy / Maint / Mgmt
- −$213
- Net cashflow
- $130
Break-even live
UW: 25.0% down · 7.5% · 30yr · 1.5% tax · 5.0% vac · 8.0% maint · 8.0% mgmt
Financing live
Cash to close
- Down payment
- $24,250
- Closing costs
- $2,910
- Reserves months
- —
- Total cash needed
- —
Loan-product check · same deal, 3 products live
Conventional
25% down · 7.5% · 30yr
- Down + closing
- —
- Monthly P&I
- —
- Monthly cashflow
- —
- DSCR
- —
- Eligible?
- —
Personal DTI + credit; lowest rate.
DSCR
20% down · 8.5% · 30yr
- Down + closing
- —
- Monthly P&I
- —
- Monthly cashflow
- —
- DSCR
- —
- Eligible?
- —
No personal income docs; deal must DSCR.
Hard money
10% down · 12.0% · 12mo
- Down + closing
- —
- Monthly P&I
- —
- Monthly cashflow
- —
- DSCR
- —
- Eligible?
- —
Short-term bridge; refi at stabilization.
Listing history 16 events
-
2026-06-18days on market $97,000 Active 142 DOM
-
2026-06-17days on market $97,000 Active 141 DOM
-
2026-06-16days on market $97,000 Active 140 DOM
-
2026-06-15days on market $97,000 Active 139 DOM
-
2026-06-13days on market $97,000 Active 137 DOM
-
2026-06-12days on market $97,000 Active 136 DOM
-
2026-06-09days on market $97,000 Active 133 DOM
-
2026-06-08days on market $97,000 Active 132 DOM
-
2026-06-07days on market $97,000 Active 131 DOM
-
2026-06-07days on market $97,000 Active 130 DOM
-
2026-06-04days on market $97,000 Active 127 DOM
-
2026-06-02days on market $97,000 Active 126 DOM
-
2026-06-01days on market $97,000 Active 125 DOM
-
2026-05-31days on market $97,000 Active 124 DOM
-
2026-02-25price $97,000 170-char remark
Show marketing remark (170 chars)
Well-located 1,280 sq ft mobile home on 1.7 acres with a carport and ample room behind the home for expansion. Convenient to town and ideal for an investment opportunity.
-
2026-01-27$99,000 Active 170-char remark
Show marketing remark (170 chars)
Well-located 1,280 sq ft mobile home on 1.7 acres with a carport and ample room behind the home for expansion. Convenient to town and ideal for an investment opportunity.
ⓘ Source: listings_history table (triggers on properties + properties_extension) + one-shot
backfill from property_details.listing_events for pre-trigger history.
Climate risk First Street
- Flood 1/10 Low FEMA zone X (unshaded) · 0% chance over 30 yrs
- Wildfire 7/10 Severe
- Heat 8/10 Severe 7 d/yr ≥107°F today · 21 d/yr by 30 yrs out
- Wind 9/10 Extreme 99% chance of damaging wind over 30 yrs
- Air quality 1/10 Low 0 unhealthy d/yr today · 0 by 30 yrs out
Nearby sold comps map
Loading sold comps map…
Walkable amenities ~0.75 mi
Loading nearby amenities…
Taxation est. · year 1
- Rental income
- $12,153
- − Mortgage interest
- −$5,434
- − Property taxes
- −$1,455
- − Insurance
- −$485
- − Repairs & maintenance
- −$972
- − Management
- −$972
- − Depreciation
- −$2,822
- Taxable income
- $13
- Est. tax owed @ 24.0%
- −$3
- After-tax cash flow
- $1,553/yr
For passive investors: Depreciation is non-cash, so a rental often shows a tax loss while cash-flowing — sheltering income. Rental losses are passive: they offset passive income freely, and up to $25,000/yr can offset ordinary (W-2) income if you actively participate and your MAGI is under $100k (phasing out to $0 by $150k); unused losses carry forward. On sale, claimed depreciation is recaptured at up to 25%, and gains may owe capital-gains tax (a 1031 exchange can defer both). Figures are a year-1 estimate at your 24.0% rate — not tax advice; consult a CPA.
Condition & rehab AI · 12 photos
This mobile home requires significant repairs and updates to improve its condition and value. The exterior siding and interior walls are in poor condition, and the flooring and bathrooms are outdated. New siding, fresh paint, updated flooring, and modernized bathrooms would significantly enhance its appeal and value.
Repairs flagged
- Major exterior siding — Severe weathering
- Major interior walls — Worn wallpaper, peeling paint
- Major flooring — Worn carpet
- Major bathrooms — Worn fixtures, outdated design
Value-add opportunities
- Resale New siding — Enhances curb appeal
- Resale Interior paint and wallpaper — Freshens look
- Resale New flooring — Improves aesthetics
- Resale Modernized bathrooms — Updates outdated design
Renovation cost estimate screening
| Repair item | Severity | Est. cost |
|---|---|---|
| exterior siding · Severe weathering | Major | $15,000–50,000 |
| interior walls · Worn wallpaper, peeling paint | Major | $15,000–50,000 |
| flooring · Worn carpet | Major | $15,000–50,000 |
| bathrooms · Worn fixtures, outdated design | Major | $15,000–50,000 |
| Total estimated repair cost · 4 items | $60,000–200,000 |
Value-add ROI direction
- Resale New siding — Enhances curb appeal ↑
- Resale Interior paint and wallpaper — Freshens look ↑
- Resale New flooring — Improves aesthetics ↑
- Resale Modernized bathrooms — Updates outdated design ↑
ⓘ Cost ranges are severity-bucket heuristics (US national rule-of-thumb). Get contractor quotes + a written scope before underwriting a rehab budget.
Schools (NCES district)
- District
- George County School District
- NCES district ID
- 2801560
- Math proficiency
- 45% ▲ 1.00%
- Reading proficiency
- 42% ▼ -1.00%
- Median HH income
- $45,139
- Composite
- 36.95/100
- National rank
- #4533
- State rank
- #30 of 130 in MS
Livability — Lucedale
- Score
- 65/100
- State rank
- #110
- US rank
- #12690
Category grades
Schools grade is shown separately in the Schools card above.
Census & demographics
- Population (ZIP)
- 28,891
Population outlook (George County) Hauer SSP2
- Today (2025)
- 24,439 people
- By 2030
- 24,823 · +1.6%
- By 2040
- 25,399 · +3.9%
- By 2050
- 25,410 · +4.0%
- By 2075
- 24,603 · +0.7%
- By 2100
- 21,067 · -13.8%
Race, ethnicity, and origin ACS 2023
- Neighborhood character
- Predominantly White (87%)
- Race & ethnicity
- White 87% Black 7% Two or more races 4% Hispanic / Latino 3%
- Common ancestry
- Slovak 2% Lithuanian 2% Serbian 1%
- Foreign-born
- 1% · Canada
- Languages at home
- 98% English-only · Spanish 1%
Political lean MEDSL · George
- 2024 margin
- Solid R (+78.8) · D 10.3% · R 89.1%
- 2008→2024 swing
- -12.7pp toward R · 2008: -66.1pp · 2024: -78.8pp
- All cycles
- 2024: R+78.8 2020: R+76.8 2016: R+77.7 2012: R+71.2 2008: R+66.1
Not yet ingested
- Civics
- —
Market trends
- HPI YoY
- ▼ -32.03%
- Current HPI
- 183.9023
- Rent YoY
- —
- Metro
- —
- State GDP YoY
- —
- F500 in state
- 0
Price history
-2.0% since first listed2 events — show timeline
- 2026-02-25 Price Changed $97,000 MLSU
- 2026-01-27 Listed $99,000 MLSU
Cash-flow waterfall
monthlySold comps — $/sqft
last 12 mo · ≤1 miLoading sold comps…