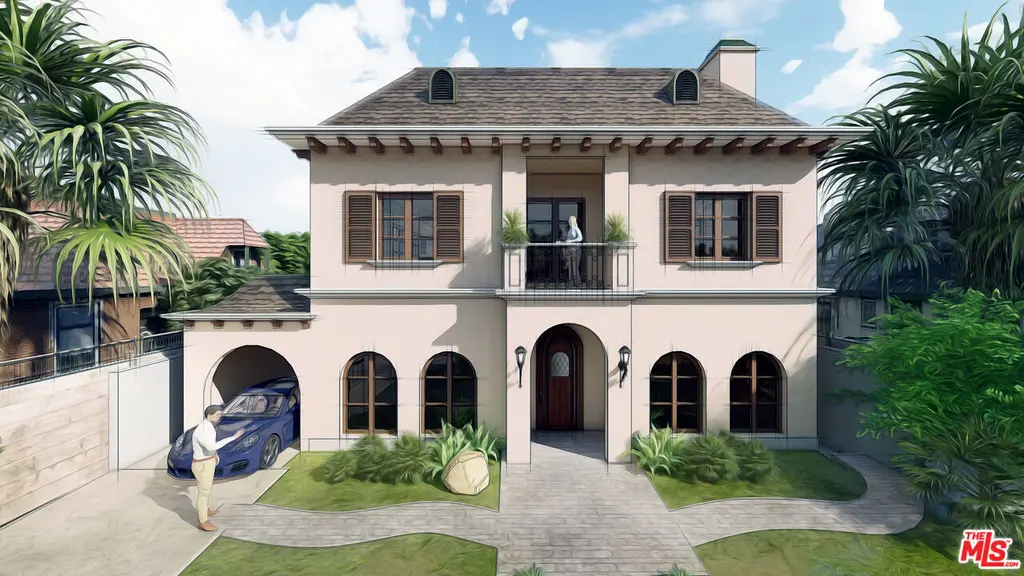
341 S Canon Dr · Beverly Hills, CA
Flood risk 1/10 · Minimal
- FEMA flood zone
- X (unshaded)
- Chance of flooding over 30 yrs
- 0.0%
- Est. flood insurance / yr
- $507 – $1,088
Fire risk 1/10 · Minimal
- Est. fire insurance / yr
- $659 – $1,223
Heat risk 6/10 · Moderate
- Hot days now (above 86°F)
- 7 days/yr
- Hot days in 30 yrs
- 21 days/yr
Wind risk 1/10 · Minimal
- Chance of severe wind over 30 yrs
- —
Air-quality risk 5/10 · Moderate
- Unhealthy air days now
- 7 days/yr
- Unhealthy air days in 30 yrs
- 7 days/yr
Risk factors via First Street. Map © Google.
Why this score? — see what drove the D- grade
The composite is a weighted blend of 9 inputs, each scored 0–100. Each bar is that input's sub-score; the figure is the points it added to the 100-point composite (weight × sub-score).
- ARV discount +15.0/15.0
- Appreciation +8.1/10.0
- Schools +5.9/10.0
- Livability +3.7/5.0
- Condition / age +2.5/5.0
- Rent growth +2.2/5.0
- Cash flow +0.1/30.0
- 1% rule +0.0/10.0
- DSCR +0.0/10.0
$3,199,000
🖨 Deal sheet 📄 Offer letter ✓ Due diligence
Listing remarks MLS
Permits in place; foundation is poured. Your dream home awaits! Build a brand-new residence with significant upside potential in one of the most iconic, sought-after locations in the world, close to the Golden Triangle of Beverly Hills and the high fashion and fine dining of Rodeo Drive. This leafy tree-lined street is positioned central to all, from the eateries and shops along South Beverly Drive and Century City to the west and Pico-Robertson and Miracle Mile to the east. Enjoy close proximity to award-winning parks, golf courses, studios, schools, and houses of worship, all with access to premier city services, top-tier public safety, and popular community and recreational programs. Financing options are available with existing lender.
Key facts
- Close to fine dining
- 6,072 sq ft lot
- 4 parking spots
Tags
Neighborhood map
What this means for you Summary
Snapshot
- This is a 3-bed/1.0-bath single-family listed at $3.20M.
Deal economics
- At list price, monthly cash flow is $-14k ($-173k/yr) — negative.
- To cash-flow at today's rent, offer at most $650k (79.7% below list).
- To meet the 1% rule (rent ≥ 1% of price), the offer needs to be $567k (82.3% below list).
- Recommended offer: $567k (82.3% below list) — sets the bar for 1% rule.
Location & tenants
- Location reads 74/100 on livability (#138 in CA, #4,810 nationally) — a middle-class / working-renter tenant base. Strengths: schools A+, amenities A+, commute A+; Watch: housing C-, health & safety C-, crime F.
- Beverly Hills Unified (suburban): math 57% / reading 73% proficiency, ranked #61 of 517 in CA (top 12%) — acceptable for families but not a draw, mixed tenant base, ~2y average lease; only 7% free/reduced lunch — higher-income household profile.
- Market conditions: Rents soft (-1.0%/yr); 51 active listings in the ZIP; 9 comparable units currently listed for rent nearby; rentals at typical pace (median 21d on market — plan ~3-4 weeks tenant-placement turnaround); high-income renter base; 19,697 units permitted in Los Angeles County in 2024 (9,426 in 5+ unit buildings).
- At $5,674/mo this rent would consume 58% of the median local household income ($118k/yr) (locally 1267% of renters already pay >50% of income on rent) — very limited rent-growth headroom before tenants either downsize or default.
Forward outlook
- In year one you build about $223k of equity ($22k loan paydown + $201k appreciation (6.3% local appreciation)).
- Los Angeles County population projected at +9% by 2050 — modest demand growth; plan on rents tracking national, not racing it.
- By year 2, paydown + projected appreciation supports a ~$357k cash-out refi (75% LTV) — recoverable capital for the next deal without selling this one.
Negotiation context
- It's been on market 34 days — a 3% lower offer ($3.10M) is reasonable based on typical stale-listing flexibility.
- 2 sale attempts with the ask held roughly flat each time — persistent listings suggest the price (not the market) is what's stuck; bring a comps-based counter.
- Current owner paid $660k; list at $3.20M implies a 385% gain — meaningful room to come down on a strong offer.
Risks & watch-outs
- Climate carrying-cost: extreme-heat days projected 7→21/yr by 2055 (HVAC capex compounding) — expect insurance premiums to compound above CPI over the hold.
Questions for the listing agent
- What do current leases actually rent for vs. the listed asking? Can we see a recent rent roll and the last 12 months of T-12 income?
- It's been on market 34 days. Have you received any prior offers? Is the seller open to a 82% concession, seller financing, or rate buy-down credit?
- Is there a deadline driving the sale (1031 exchange, divorce, estate, relocation)? That informs how much negotiation room exists.
- Schools are A-rated — typically a magnet for longer-tenancy family renters. What's the average tenant stay here, and is there a school-zone premium baked into asking?
- Crime grade is F in this area — have there been break-ins, vandalism, or insurance claims at this property in the last 3 years? What carrier currently insures it and at what premium?
- The area grade is low — what's the realistic commute time and amenity access for the typical tenant pool here? Any planned neighborhood developments (good or bad) we should know about?
- What's the average days-on-market for RENTAL listings here right now (not sales)? A rising rental-DOM trend means longer vacancies and softer asking-rent achievability than the comps imply.
- What's the recent tenant-quality profile in this submarket — average credit score on applications, eviction rate, late-payment / NSF rate, and stable-employment percentage? A property-management company in the area should have these aggregated.
- How much new for-sale + rental construction is in the pipeline within 1–3 miles? Heavy new supply typically softens prices + rents 12–24 months out; constrained supply supports both.
Investment metrics
- 1% rule
- 0.18% ✗
- Cap rate
- 0.88%
- Cash-on-cash
- -19.33%
- DSCR
- 0.14
- GRM
- 47.0
CMA / ARV
- ARV (median comp)
- $5,452,252
- List price
- $3,199,000
- Delta
- -41.33%
- Verdict
- UNDERPRICED
- Comps
- 20 within 1.0 mi
Show comp detail 1 sale within ~0.75 mi
| Address | Dist | Beds/Ba | Sqft | Sold | Price | $/sf | Match |
|---|---|---|---|---|---|---|---|
| 137 S Wetherly Dr | 0.59mi | 4/7.0 (+1) | 6,127 (+4%) | 9mo | $6,600,000 | $1,077 | 38 |
Match score weights: distance 35% · size 25% · config 20% · recency 20%. Top-matched comps best support the ARV.
Projected returns pro-forma
6.28% appreciation · 0.0% rent growth · sell at horizon
- IRR
- 0.6%
- Equity multiple
- 1.04×
- Total profit
- $38,638
- Equity at exit
- $2,067,083
- IRR
- 4.0%
- Equity multiple
- 1.88×
- Total profit
- $786,668
- Equity at exit
- $3,797,919
Cash invested: $895,720 (down + closing). Projections, not guarantees.
Landlord ↔ Tenant lean methodology
- Overall (STATE)
- 18 Strongly Tenant-Friendly
- State California
- 18 Strongly Tenant-Friendly · D+13
- County
- — inherits STATE
- City
- — inherits STATE
ZIP-level market 90212
- Home prices YoY
- 1.9%
- Rents YoY
- -1.0%
- Active inventory
- 51
- Price-to-rent
- 47.0×
Monthly cashflow live
- Estimated rent
- $5,674 medium interval (Pro) →
- Mortgage (P&I)
- −$16,776
- Tax from tax record
- −$805 /mo · $9,665/yr
- Insurance
- −$1,333
- HOA
- −$0
- Vacancy / Maint / Mgmt
- −$1,192
- Net cashflow
- $-14,432
Break-even live
UW: 25.0% down · 7.5% · 30yr · 1.5% tax · 5.0% vac · 8.0% maint · 8.0% mgmt
Financing live
Cash to close
- Down payment
- $799,750
- Closing costs
- $95,970
- Reserves months
- —
- Total cash needed
- —
Loan-product check · same deal, 3 products live
Conventional
25% down · 7.5% · 30yr
- Down + closing
- —
- Monthly P&I
- —
- Monthly cashflow
- —
- DSCR
- —
- Eligible?
- —
Personal DTI + credit; lowest rate.
DSCR
20% down · 8.5% · 30yr
- Down + closing
- —
- Monthly P&I
- —
- Monthly cashflow
- —
- DSCR
- —
- Eligible?
- —
No personal income docs; deal must DSCR.
Hard money
10% down · 12.0% · 12mo
- Down + closing
- —
- Monthly P&I
- —
- Monthly cashflow
- —
- DSCR
- —
- Eligible?
- —
Short-term bridge; refi at stabilization.
Rent comps 9 comps
| Address | Beds | Baths | Sqft | Rent | $/sqft | DOM | Units | Dist |
|---|---|---|---|---|---|---|---|---|
| 425 S Palm Dr Beverly Hills, CA | 3.0 | 2.5 | 4345 | $4,800 | $1.10 | 20d | 1 | 0.33mi |
| 1128 Rexford Dr Unit 3 Los Angeles, CA | 2.0 | 2.0 | 6240 | $3,100 | $0.50 | 44d | 1 | 0.38mi |
| 1128 S Oakhurst Dr Unit 1 Los Angeles, CA | 2.0 | 2.0 | 4972 | $2,795 | $0.56 | 18d | 1 | 0.49mi |
| 204 Foothill Rd Beverly Hills, CA | 4.0 | 4.5 | 4114 | $25,500 | $6.20 | 18d | 1 | 0.60mi |
| 213 S La Peer Dr Beverly Hills, CA | 4.0 | 6.0 | 5821 | $27,500 | $4.72 | 24d | 1 | 0.62mi |
| 1 W Century Dr Los Angeles, CA | 2.0–4.0 | 3.5–5.5 | 4780 | $40,000 | $8.37 | 2d | 2 | 1.06mi |
| 1 W Century Dr Unit 38B Los Angeles, CA | 2.0 | 3.5 | 5320 | $95,000 | $17.86 | 43d | 1 | 1.07mi |
| 1118 S Holt Ave Unit 2 Los Angeles, CA | 2.0 | 2.0 | 5977 | $3,750 | $0.63 | 3d | 1 | 1.13mi |
| 6721 Drexel Ave Los Angeles, CA | 4.0 | 6.0 | 4619 | $22,000 | $4.76 | 43d | 1 | 1.43mi |
Listing history 4 events
-
2026-04-22$3,199,000 Active 749-char remark
Show marketing remark (749 chars)
Permits in place; foundation is poured. Your dream home awaits! Build a brand-new residence with significant upside potential in one of the most iconic, sought-after locations in the world, close to the Golden Triangle of Beverly Hills and the high fashion and fine dining of Rodeo Drive. This leafy tree-lined street is positioned central to all, from the eateries and shops along South Beverly Drive and Century City to the west and Pico-Robertson and Miracle Mile to the east. Enjoy close proximity to award-winning parks, golf courses, studios, schools, and houses of worship, all with access to premier city services, top-tier public safety, and popular community and recreational programs. Financing options are available with existing lender.
-
2025-01-04Active
-
2024-12-16historical
-
2000-11-28soldstatus $660,000
ⓘ Source: listings_history table (triggers on properties + properties_extension) + one-shot
backfill from property_details.listing_events for pre-trigger history.
Tax reassessment forecast CA · Resets to sale price
- Current annual tax
- $9,665 · $805/mo
- Projected year-2 tax
- $24,312 · $2,026/mo
- Expected delta
- +$14,647/yr (+$1,221/mo · 151.5%)
ⓘ Screening estimate from a state-policy table — verify with the county assessor before closing.
Climate risk First Street
- Flood 1/10 Low FEMA zone X (unshaded) · 0% chance over 30 yrs
- Wildfire 1/10 Low
- Heat 6/10 Major 7 d/yr ≥86°F today · 21 d/yr by 30 yrs out
- Wind 1/10 Low
- Air quality 5/10 Major 7 unhealthy d/yr today · 7 by 30 yrs out
Nearby sold comps map
Loading sold comps map…
Walkable amenities ~0.75 mi
Loading nearby amenities…
Taxation est. · year 1
- Rental income
- $68,086
- − Mortgage interest
- −$179,194
- − Property taxes
- −$9,665
- − Insurance
- −$15,995
- − Repairs & maintenance
- −$5,447
- − Management
- −$5,447
- − Depreciation
- −$93,062
- Taxable loss
- −$240,724
- Est. tax savings @ 24.0%
- +$57,774
- After-tax cash flow
- $-115,409/yr
For passive investors: Depreciation is non-cash, so a rental often shows a tax loss while cash-flowing — sheltering income. Rental losses are passive: they offset passive income freely, and up to $25,000/yr can offset ordinary (W-2) income if you actively participate and your MAGI is under $100k (phasing out to $0 by $150k); unused losses carry forward. On sale, claimed depreciation is recaptured at up to 25%, and gains may owe capital-gains tax (a 1031 exchange can defer both). Figures are a year-1 estimate at your 24.0% rate — not tax advice; consult a CPA.
Schools (NCES district)
- District
- Beverly Hills Unified
- NCES district ID
- 0604830
- Math proficiency
- 57% ▼ -7.00%
- Reading proficiency
- 73% ▼ -2.00%
- Median HH income
- $89,439
- Composite
- 58.93/100
- National rank
- #969
- State rank
- #61 of 517 in CA
Livability — Beverly Hills
- Score
- 74/100
- State rank
- #138
- US rank
- #4810
Category grades
Schools grade is shown separately in the Schools card above.
Census & demographics
- Census place
- Beverly Hills, CA
- County
- Los Angeles County · 9,444,647 people
- City population
- 38,852
- Metro
- Los Angeles-Long Beach-Anaheim, CA
- Population (ZIP)
- 10,728
- Household income
- $118,019
- Rent vs Own
- Severe rent burden
- 1267.0
Population outlook (Los Angeles County) Hauer SSP2
- Today (2025)
- 10,940,515 people
- By 2030
- 11,256,481 · +2.9%
- By 2040
- 11,729,929 · +7.2%
- By 2050
- 11,948,407 · +9.2%
- By 2075
- 11,818,114 · +8.0%
- By 2100
- 10,842,928 · -0.9%
Race, ethnicity, and origin ACS 2023
- Neighborhood character
- Predominantly White (70%)
- Race & ethnicity
- White 70% Asian 12% Two or more races 10% Hispanic / Latino 9% Black 3%
- Hispanic origin (detail)
- Mexican 2%
- Common ancestry
- Scotch-Irish 8% Romanian 7% Lithuanian 4%
- Foreign-born
- 33% · Canada, China, Jamaica
- Languages at home
- 64% English-only · Other Indo-European 13% Spanish 9% French/Haitian/Cajun 3%
Political lean MEDSL · Los Angeles
- 2024 margin
- Solid D (+32.9) · D 64.8% · R 31.9% · Other 3.3%
- 2008→2024 swing
- -7.4pp toward R · 2008: 40.4pp · 2024: 32.9pp
- All cycles
- 2024: D+32.9 2020: D+44.2 2016: D+48.0 2012: D+40.0 2008: D+40.4
Not yet ingested
- Civics
- —
Market trends
- HPI YoY
- ▲ 6.28%
- Current HPI
- 327.6332
- Rent YoY
- ▼ -1.02%
- Metro
- Los Angeles-Long Beach-Anaheim, CA
- State GDP YoY
- ▲ 3.21%
- F500 in state
- 116
Industry mix (Fortune 500 HQ in CA)
| Industry | F500 HQs | Revenue |
|---|---|---|
| Technology | 27 | $1,492B |
|
||
| Financial Services | 3 | $174B |
|
||
| Retail | 3 | $44B |
|
||
| Insurance | 3 | $26B |
|
||
| Media / Entertainment | 2 | $115B |
|
||
| Pharmaceuticals / Biotech | 2 | $62B |
|
||
Price history
+384.7% since first listed4 events — show timeline
- 2026-04-22 Listed $3,199,000 TheMLS
- 2025-01-04 Listed — TheMLS
- 2024-12-16 Coming Soon — TheMLS
- 2000-11-28 Sold (Public Records) $660,000 Public Records
Property tax history
+0.9%/yrLatest (2025): $9,665 · -67.9% YoY. Source: county tax records.
Cash-flow waterfall
monthlySold comps — $/sqft
last 12 mo · ≤1 miLoading sold comps…