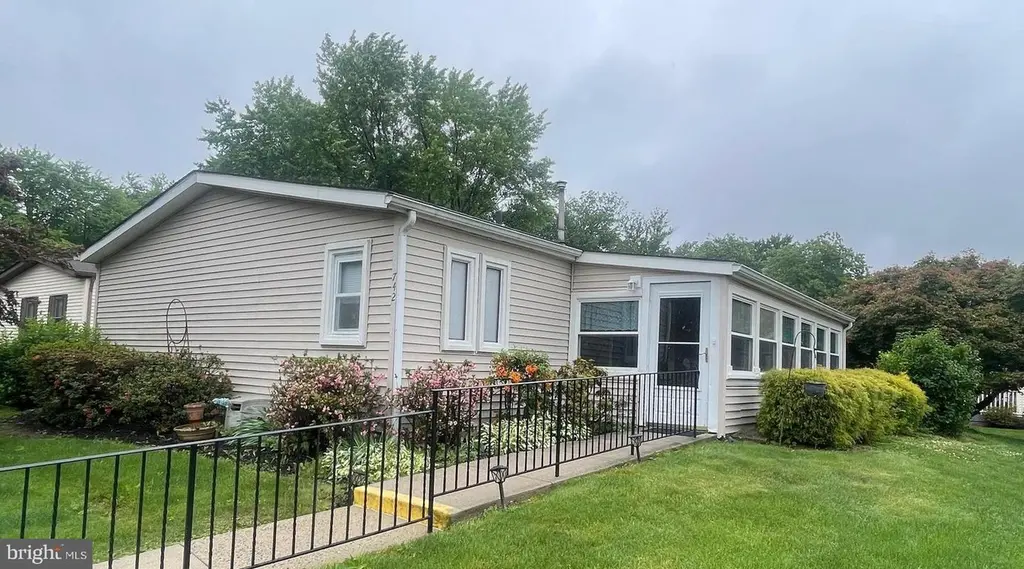
742 Dogwood Dr · Montgomeryville, PA
Flood risk 1/10 · Minimal
- FEMA flood zone
- X (unshaded)
- Chance of flooding over 30 yrs
- 0.0%
- Est. flood insurance / yr
- $507 – $1,088
Fire risk 1/10 · Minimal
- Est. fire insurance / yr
- $511 – $949
Heat risk 5/10 · Moderate
- Hot days now (above 100°F)
- 7 days/yr
- Hot days in 30 yrs
- 15 days/yr
Wind risk 6/10 · Moderate
- Chance of severe wind over 30 yrs
- 27.0%
Air-quality risk 4/10 · Minor
- Unhealthy air days now
- 4 days/yr
- Unhealthy air days in 30 yrs
- 7 days/yr
Risk factors via First Street. Map © Google.
Why this score? — see what drove the C+ grade
The composite is a weighted blend of 9 inputs, each scored 0–100. Each bar is that input's sub-score; the figure is the points it added to the 100-point composite (weight × sub-score).
- Cash flow +26.7/30.0
- DSCR +9.1/10.0
- ARV discount +7.5/15.0
- 1% rule +6.5/10.0
- Schools +5.2/10.0
- Livability +3.9/5.0
- Rent growth +3.7/5.0
- Condition / age +2.5/5.0
- Appreciation +0.0/10.0
$249,800
🖨 Deal sheet (PDF) 📄 Offer letter ✓ Due diligence
Listing remarks
Fabulous 3 bed, 2 bath home offering 1,680 sqft of interior living space; one of the largest models available! Features an enclosed front porch and a spacious rear patio with an electric awning, providing comfortable outdoor space for relaxing and entertaining. Bright, open floor plan seamlessly connects the living room dining area and den. Remodeled bathrooms and a wood pellet stove in the living room for added warmth and charm! Excellent location with convenient one-step entry into the home. The Village of Neshaminy Falls is a 55+ Active Adult Community with a gorgeous newly rebuilt clubhouse featuring a library, fitness room and game room. From the clubhouse walk out to the wrap around
Key facts
- Wrap around veranda
- Wood pellet stove
- Heated inground pool
Tags
Property features AI
Finance
- Other: Above-grade finished area reported by assessor; No basement; Total rooms: 8
- HOA & community: Ground rent of $750 paid monthly; Ground rent ownership interest (ground rent)
Exterior
- Parking: Property manager present
- Utilities: Public water; Public sewer; Electric service with circuit breakers
- Home design: Manufactured home; Located in a senior community (55+)
- Construction: Vinyl siding; Slab foundation
- Exterior features: Porch(es); Street lights; Front yard; Shed
Interior
- Kitchen: Oven (self-cleaning); Dishwasher
- Bedrooms: 3 bedrooms on the main level
- Flooring: Fully carpeted; Vinyl
- Bathrooms: 2 full bathrooms (both on the main level)
- Heating & cooling: Forced air heating; Heat pump with electric backup; Electric hot water; Central air conditioning
- Interior features: Master bath(s); Kitchen island; Ceiling fan(s); Whirlpool/hot tub; Eat-in kitchen; Breakfast area; Living room; Dining room; Family room
- Laundry & utility: Laundry on the main floor
Neighborhood map
What this means for you Summary
Snapshot
- This is a 3-bed/2.0-bath manufactured listed at $250k.
Deal economics
- At list price, monthly cash flow is $674 ($8k/yr) — positive.
- The deal already cash-flows at list — no discount required.
- Meets the 1% rule at list price ($3k rent vs $250k).
- Recommended offer: $246k (1.5% below list) — sets the bar for market timing.
- Cap rate 9.5% vs local median 2.9% in Montgomeryville — top-decile yield for the area; either an underpriced asset or a hidden risk that comps aren't pricing in. Stress-test before assuming the spread holds.
Location & tenants
- Location reads 77/100 on livability (#327 in PA, #2,871 nationally) — a middle-class / working-renter tenant base. Strengths: crime A+, employment A+, housing A+; Watch: cost of living D, commute F.
- North Penn SD (suburban): math 48% / reading 67% proficiency, ranked #76 of 539 in PA (top 14%) — acceptable for families but not a draw, mixed tenant base, ~2y average lease; only 20% free/reduced lunch — higher-income household profile.
- Zoned schools: Montgomery El Sch (math 58% / reading 74%, grade B+, #238 of 1,518 statewide, top 16%, 643 students, 17% FRL); Pennbrook Ms (math 43% / reading 70%, grade B, #66 of 512 statewide, top 13%, 807 students, 25% FRL); North Penn Shs (math 78% / reading 50%, grade B-, #67 of 437 statewide, top 15%, 3,184 students, 34% FRL).
- Market conditions: Rents rising fast (+4.6%/yr); 101 active listings in the ZIP; 6 comparable units currently listed for rent nearby; rentals lingering (median 46d on market — plan ~5-8 weeks vacancy on turnover, expect pricing pressure); 50% of comp listings sitting > 30 days — soft ceiling on asking rent; high-income renter base; 1,936 units permitted in Montgomery County in 2024 (530 in 5+ unit buildings).
Forward outlook
- Local home prices are declining (-3.0%/yr); year-one equity from $2k of loan paydown is wiped out by about $7k of value loss. Plan a longer hold.
- Montgomery County population projected at +5% by 2050 — modest demand growth; plan on rents tracking national, not racing it.
- At projected returns (-3.0% appreciation + 4.6% rent growth), your $70k cash investment doubles in ~9 years — after that, you're playing with house money.
Negotiation context
- It's been on market 28 days — a 2% lower offer ($246k) is reasonable based on typical stale-listing flexibility.
- 3 sale attempts since 30y ago with the ask held roughly flat each time — persistent listings suggest the price (not the market) is what's stuck; bring a comps-based counter.
Risks & watch-outs
- Climate carrying-cost: major wind risk, 27% chance of damaging wind over 30y; extreme-heat days projected 7→15/yr by 2055 (HVAC capex compounding) — expect insurance premiums to compound above CPI over the hold.
Questions for the listing agent
- Is there a deadline driving the sale (1031 exchange, divorce, estate, relocation)? That informs how much negotiation room exists.
- What's the average days-on-market for RENTAL listings here right now (not sales)? A rising rental-DOM trend means longer vacancies and softer asking-rent achievability than the comps imply.
- What's the recent tenant-quality profile in this submarket — average credit score on applications, eviction rate, late-payment / NSF rate, and stable-employment percentage? A property-management company in the area should have these aggregated.
- How much new for-sale + rental construction is in the pipeline within 1–3 miles? Heavy new supply typically softens prices + rents 12–24 months out; constrained supply supports both.
Investment metrics
- 1% rule
- 1.15% ✓
- Cap rate
- 9.53%
- Cash-on-cash
- 11.56%
- DSCR
- 1.51
- GRM
- 7.3
CMA / ARV
No comps found within radius.
Projected returns pro-forma
-3.0% appreciation · 4.62% rent growth · sell at horizon
- IRR
- 2.6%
- Equity multiple
- 1.10×
- Total profit
- $7,117
- Equity at exit
- $37,246
- IRR
- 13.6%
- Equity multiple
- 2.16×
- Total profit
- $81,373
- Equity at exit
- $21,598
Cash invested: $69,944 (down + closing). Projections, not guarantees.
Landlord ↔ Tenant lean methodology
- Overall (STATE)
- 62 Landlord-Friendly
- State Pennsylvania
- 62 Landlord-Friendly · EVEN
- County
- — inherits STATE
- City
- — inherits STATE
ZIP-level market 19454
- Rents YoY
- 4.6%
- Active inventory
- 101
- Price-to-rent
- 7.3×
Monthly cashflow live
- Estimated rent
- $2,863 high interval (Pro) →
- Mortgage (P&I)
- −$1,310
- Tax from tax record
- −$174 /mo · $2,087/yr
- Insurance
- −$104
- HOA
- −$0
- Vacancy / Maint / Mgmt
- −$601
- Net cashflow
- $674
Break-even live
Sensitivity live
| Price | -10% $815 | -5% $744 | +0% $674 | +5% $603 | +10% $532 |
|---|---|---|---|---|---|
| Rent | -10% $447 | -5% $560 | +0% $674 | +5% $787 | +10% $900 |
| Rate | -1.0pp $799 | -0.5pp $737 | base $674 | +0.5pp $609 | +1.0pp $543 |
UW: 25.0% down · 7.5% · 30yr · 1.5% tax · 5.0% vac · 8.0% maint · 8.0% mgmt
Financing live
Cash to close
- Down payment
- $62,450
- Closing costs
- $7,494
- Reserves months
- —
- Total cash needed
- —
Loan-product check · same deal, 3 products live
Conventional
25% down · 7.5% · 30yr
- Down + closing
- —
- Monthly P&I
- —
- Monthly cashflow
- —
- DSCR
- —
- Eligible?
- —
Personal DTI + credit; lowest rate.
DSCR
20% down · 8.5% · 30yr
- Down + closing
- —
- Monthly P&I
- —
- Monthly cashflow
- —
- DSCR
- —
- Eligible?
- —
No personal income docs; deal must DSCR.
Hard money
10% down · 12.0% · 12mo
- Down + closing
- —
- Monthly P&I
- —
- Monthly cashflow
- —
- DSCR
- —
- Eligible?
- —
Short-term bridge; refi at stabilization.
Rent comps 6 comps
| Address | Beds | Baths | Sqft | Rent | $/sqft | DOM | Units | Dist |
|---|---|---|---|---|---|---|---|---|
| 108 Filly Dr North Wales, PA | 3.0 | 2.5 | 2178 | $3,200 | $1.47 | 45d | 1 | 0.75mi |
| 302 Joshua Ct North Wales, PA | 4.0 | 2.5 | 1544 | $3,500 | $2.27 | 45d | 1 | 0.83mi |
| 415 Stump Rd North Wales, PA | 2.0 | 1.0–2.0 | 827 | $2,742 | $3.32 | 0d | 16 | 1.03mi |
| 306 General Hancock Blvd North Wales, PA | 4.0 | 2.5 | 2044 | $3,250 | $1.59 | 45d | 1 | 1.05mi |
| 204 Livingston Ct North Wales, PA | 4.0 | 1.5 | 1281 | $2,300 | $1.80 | 13d | 1 | 1.48mi |
| 204 Livingston Ct North Wales, PA | 3.0 | 1.5 | 1281 | $2,500 | $1.95 | 3d | 1 | 1.48mi |
Listing history 20 events
-
2026-06-21days on market $249,800 Active 28 DOM
-
2026-06-18days on market $249,800 Active 25 DOM
-
2026-06-17days on market $249,800 Active 24 DOM
-
2026-06-16days on market $249,800 Active 23 DOM
-
2026-06-15days on market $249,800 Active 22 DOM
-
2026-06-13days on market $249,800 Active 20 DOM
-
2026-06-13pricedays on market $249,800 Active 19 DOM
-
2026-06-09days on market $254,800 Active 16 DOM
-
2026-06-08days on market $254,800 Active 15 DOM
-
2026-06-07days on market $254,800 Active 14 DOM
-
2026-06-03days on market $254,800 Active 10 DOM
-
2026-06-02days on market $254,800 Active 9 DOM
-
2026-06-01days on market $254,800 Active 8 DOM
-
2026-05-31days on market $254,800 Active 7 DOM
-
2026-05-24$254,800 Active
-
2026-05-24historical $254,800
-
1997-01-31historical
-
1996-10-02$79,900
-
1996-09-19historical
-
1996-04-19$79,900
ⓘ Source: listings_history table (triggers on properties + properties_extension) + one-shot
backfill from property_details.listing_events for pre-trigger history.
Tax reassessment forecast PA · Partial reset (capped growth)
- Current annual tax
- $2,087 · $174/mo
- Projected year-2 tax
- $3,017 · $251/mo
- Expected delta
- +$930/yr (+$77/mo · 44.5%)
ⓘ Screening estimate from a state-policy table — verify with the county assessor before closing.
Climate risk First Street
- Flood 1/10 Low FEMA zone X (unshaded) · 0% chance over 30 yrs
- Wildfire 1/10 Low
- Heat 5/10 Major 7 d/yr ≥100°F today · 15 d/yr by 30 yrs out
- Wind 6/10 Major 27% chance of damaging wind over 30 yrs
- Air quality 4/10 Moderate 4 unhealthy d/yr today · 7 by 30 yrs out
Nearby sold comps map
Loading sold comps map…
Walkable amenities ~0.75 mi
Loading nearby amenities…
Taxation est. · year 1
- Rental income
- $34,352
- − Mortgage interest
- −$13,993
- − Property taxes
- −$2,087
- − Insurance
- −$1,249
- − Repairs & maintenance
- −$2,748
- − Management
- −$2,748
- − Depreciation
- −$7,267
- Taxable income
- $4,260
- Est. tax owed @ 24.0%
- −$1,022
- After-tax cash flow
- $7,060/yr
For passive investors: Depreciation is non-cash, so a rental often shows a tax loss while cash-flowing — sheltering income. Rental losses are passive: they offset passive income freely, and up to $25,000/yr can offset ordinary (W-2) income if you actively participate and your MAGI is under $100k (phasing out to $0 by $150k); unused losses carry forward. On sale, claimed depreciation is recaptured at up to 25%, and gains may owe capital-gains tax (a 1031 exchange can defer both). Figures are a year-1 estimate at your 24.0% rate — not tax advice; consult a CPA.
Schools (NCES district)
- District
- North Penn SD
- NCES district ID
- 4217280
- Math proficiency
- 48% ▼ -10.00%
- Reading proficiency
- 67% ▼ -9.00%
- Median HH income
- $76,866
- Composite
- 51.5/100
- National rank
- #1722
- State rank
- #76 of 539 in PA
Livability — Montgomeryville
- Score
- 77/100
- State rank
- #327
- US rank
- #2871
Category grades
Schools grade is shown separately in the Schools card above.
Census & demographics
- County
- Montgomery County · 712,331 people
- City population
- 288
- Metro
- Philadelphia-Camden-Wilmington, PA-NJ-DE-MD
- Population (ZIP)
- 27,755
- Household income
- $118,177
- Rent vs Own
- Severe rent burden
- 459.0
Population outlook (Montgomery County) Hauer SSP2
- Today (2025)
- 856,074 people
- By 2030
- 870,887 · +1.7%
- By 2040
- 891,195 · +4.1%
- By 2050
- 896,417 · +4.7%
- By 2075
- 903,212 · +5.5%
- By 2100
- 843,240 · -1.5%
Race, ethnicity, and origin ACS 2023
- Neighborhood character
- Predominantly White (69%)
- Race & ethnicity
- White 69% Asian 18% Black 6% Two or more races 5% Hispanic / Latino 4%
- Common ancestry
- Romanian 5% Scotch-Irish 2% Lithuanian 2%
- Foreign-born
- 17% · South Korea, China, Vietnam
- Languages at home
- 81% English-only · Korean 5% Other Indo-European 5% Chinese 3%
Political lean MEDSL · Montgomery
- 2024 margin
- Strong D (+22.8) · D 60.9% · R 38.1% · Other 1.1%
- 2008→2024 swing
- +2.0pp toward D · 2008: 20.8pp · 2024: 22.8pp
- All cycles
- 2024: D+22.8 2020: D+26.3 2016: D+21.1 2012: D+14.3 2008: D+20.8
Not yet ingested
- Civics
- —
Market trends
- HPI YoY
- ▼ -220.54%
- Current HPI
- 270.3006
- Rent YoY
- ▲ 4.62%
- Metro
- Philadelphia-Camden-Wilmington, PA-NJ-DE-MD
- State GDP YoY
- ▲ 1.68%
- F500 in state
- 34
Industry mix (Fortune 500 HQ in PA)
| Industry | F500 HQs | Revenue |
|---|---|---|
| Healthcare | 2 | $309B |
|
||
| Insurance | 2 | $27B |
|
||
| Telecommunications / Media | 1 | $124B |
|
||
| Industrial Distribution | 1 | $22B |
|
||
| Financial Services | 1 | $20B |
|
||
| Chemicals / Materials | 1 | $18B |
|
||
Price history
+218.9% since first listed6 events — show timeline
- 2026-05-24 Listed $254,800 BRIGHT MLS
- 2026-05-24 Coming Soon $254,800 BRIGHT MLS
- 1997-01-31 Listing Removed — BRIGHT MLS
- 1996-10-02 Listed $79,900 BRIGHT MLS
- 1996-09-19 Listing Removed — BRIGHT MLS
- 1996-04-19 Listed $79,900 BRIGHT MLS
Property tax history
+3.0%/yrLatest (2026): $2,087 · +6.8% YoY. Source: county tax records.
Cash-flow waterfall
monthlySold comps — $/sqft
last 12 mo · ≤1 miLoading sold comps…